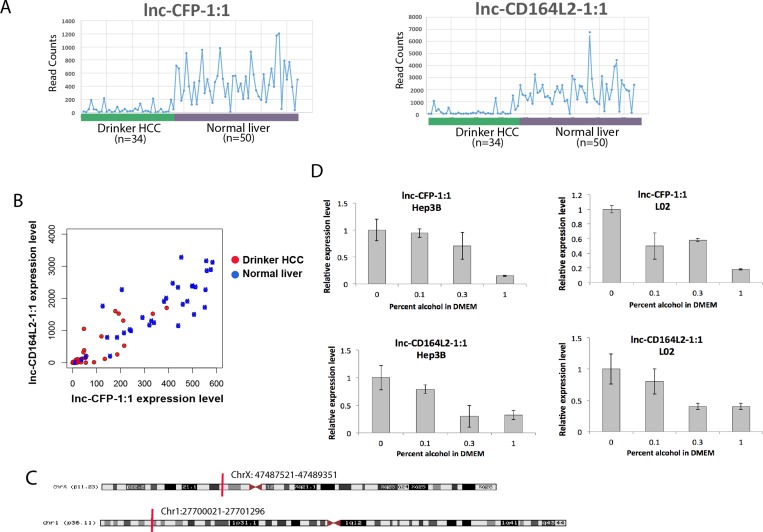
Figure 6. In vitro validation of alcohol-dysregulated lncRNAs in liver cell lines.
(A) Expression plot of lnc-CFP-1:1 and lnc-CD164L2-1:1 in HCC drinkers compared to normal liver tissues. (B) Scatter plots showing clusters of HCC drinkers and normal liver tissues with respect to expression levels of lnc-CFP-1:1 and lnc-CD164L2-1:1. (C) Loci of lnc-CFP-1:1 and lnc-CD164L2-1:1. (D) qRT-PCR verifies that 0.1%, 0.3% and 1% alcohol treatment downregulates lnc-CFP-1:1 and lnc-CD164L2-1:1 in L02 and Hep3B. All bar graphs are presented as the mean and error bars representing standard deviations.

