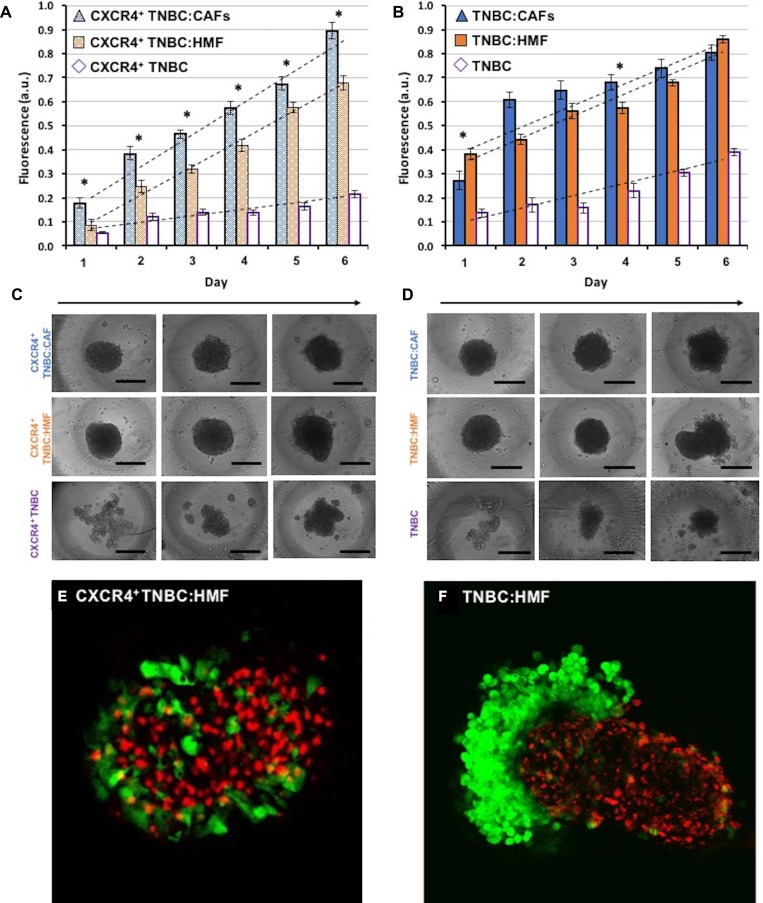
Figure 4. Proliferation of TNBC cells in co-culture spheroids measured using their endogenous eGFP signal.
(A) TNBC cells in the CXCR4+TNBC:CAFs model display consistently greater proliferation compared to spheroids of CXCR4+TNBC:HMF co-culture model and CXCR4+TNBC single culture with a larger slope of 11.4% and 77.1%, respectively. (B) TNBC cells lacking CXCR4 expression in co-culture with HMF and CAFs show a similar proliferation. (C–D) Morphology of resulting co-culture spheroids and mono-culture spheroids of breast cancer cells on days 1, 3, and 6 (left to right). Error bars represent standard error of mean. (E–F) Confocal images of the co-culture spheroids containing HMF cells on day 4. Scale bar is 200 µm. *p < 0.05.

