
Figure 4. Protein expressions of ENaCα and ENaCγ in obstructed kidneys following MnTBAP treatment.
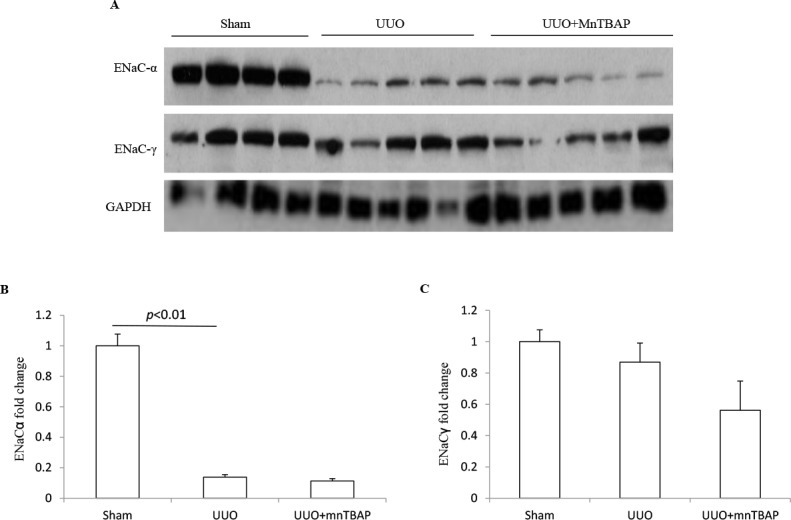
(A) Western blotting analysis of ENaCα and ENaCγ. (B) Densitometric analysis of ENaCα normalized by GAPDH. (C) Densitometric analysis of ENaCγ normalized by GAPDH. The presented data are means ± SE. N = 6 in each group.