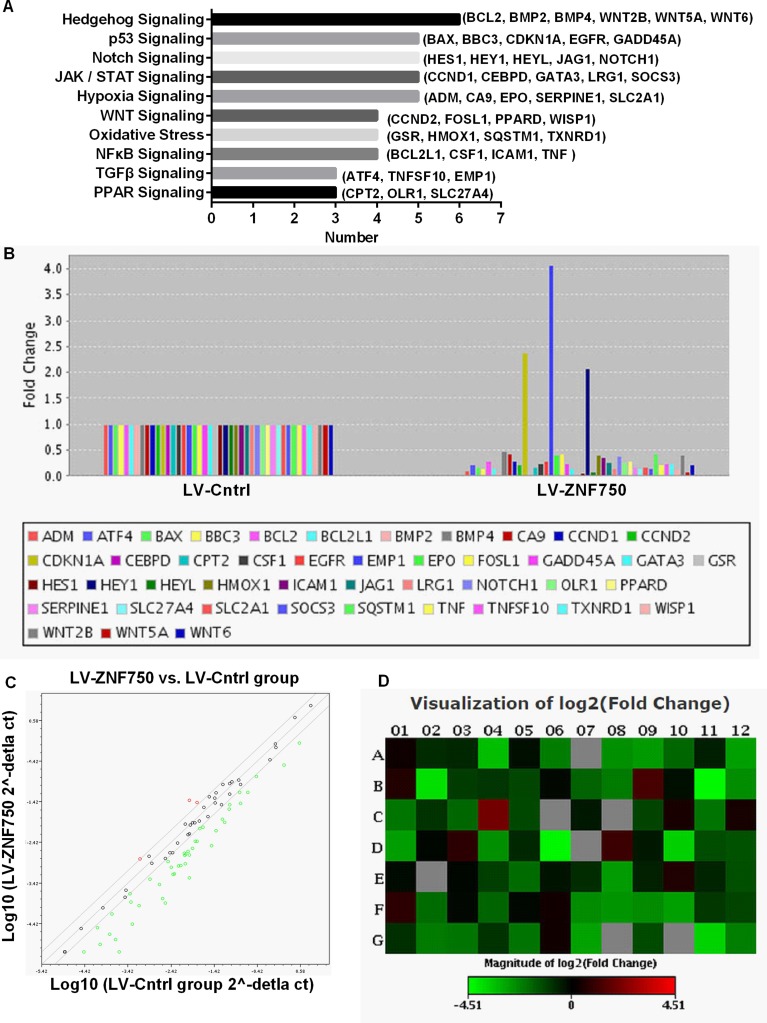
Figure 2. Effects of ZNF750 on gene expression profiles of signal transduction in CAL-27 cell.
The expression change of the 84 genes in ZNF750 groups and LV-Cntrl groups was performed by real-time PCR based array analysis. The expression levels in LV-Cntrl were set as 1. (A) The bar diagram is the clustering of differential expression genes in 10 signal transduction. (B) Genes that changed at least a two-fold differential expression in LV-ZNF750 group against LV-Cntrl group. (C) The red and green dot stands for up-regulated and down-regulated genes respectively. (D) The red and green color represent for increasing or decreasing genes in LV-ZNF750 group against LV-Cntrl group respectively showed in the heat map.

