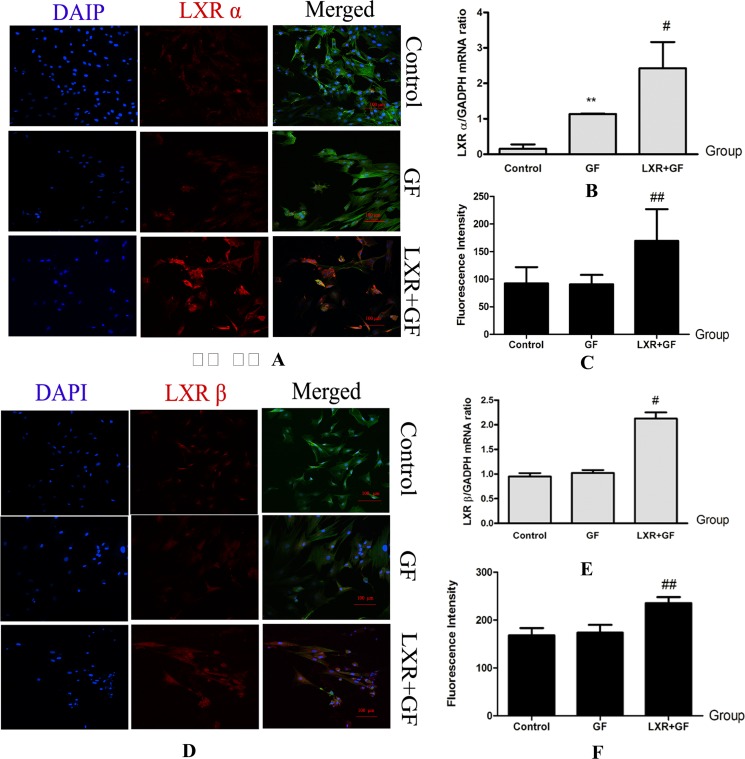
Figure 9. Changes in expressions of LXR (× 200, Scale bars = 100 μm).
(A–C) Changes in expressions of LXR α protein and mRNA. Cells in control group, GF group and LXR+GF group displays merged images of double staining with F-actin (FITC, green) and LXR α (dylight 549, red). Colocalization was identified by the yellow fluorescence in the merged images. Group data showing changes in expressions of LXR α protein and mRNA. Data are expressed as mean ± SD (n = 3–5). **P < 0.01, compared with control group; #P < 0.05 and ##P < 0.01, compared with GF group, respectively. (D–F) Changes in expressions of LXR β protein and mRNA. Cells in control group, GF group and LXR+GF group displays merged images of double staining with F-actin (FITC, green) and LXR β (dylight 549, red). Colocalization was identified by the yellow fluorescence in the merged images. Group data showing change in expressions of LXR β protein and mRNA. Data are expressed as mean ± SD (n = 3–5). #P < 0.05 and ##P < 0.01, compared with GF group, respectively.

