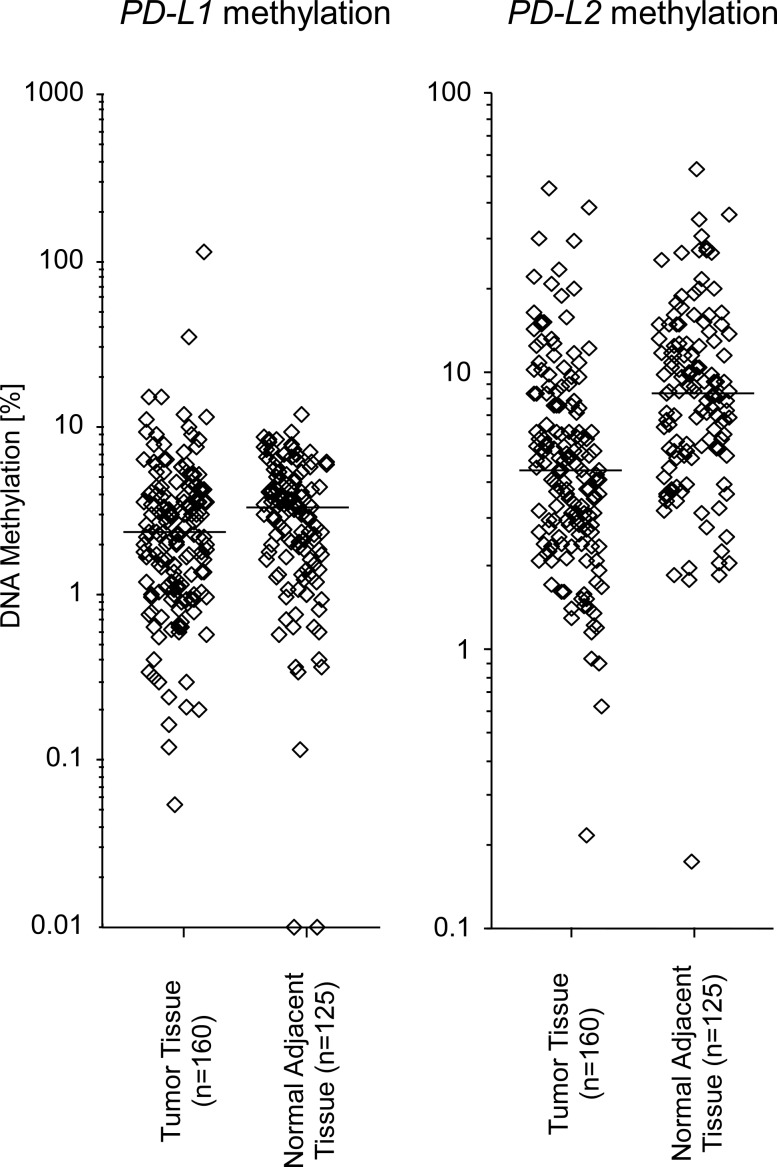
Figure 2. PD-L1 and PD-L2 methylation in HNSCC and normal adjacent tissue in the UKB cohort.
PD-L1 and PD-L2 methylation in 160 HNSCC and 125 NAT. Mean PD-L1 methylation levels were not significantly different in tumors versus NATs (PD-L1 median methylation in tumors: 2.34%, NATs: 3.28%, p = 0.077, Mann–Whitney U test; PD-L2, median methylation in tumors: 4.42%, NATs: 8.32%, p < 0.001, Mann–Whitney U test). Bars indicate median methylation levels.

