

Abstract
Myofibroblasts participate in physiological wound healing and pathological fibrosis. Myofibroblast differentiation is characterized by the expression of α-smooth muscle actin and extracellular matrix proteins and is dependent on metabolic reprogramming. In this study, we explored the role of glutaminolysis and metabolites of TCA in supporting myofibroblast differentiation. Glutaminolysis converts Gln into α-ketoglutarate (α-KG), a critical intermediate in the TCA cycle. Increases in the steady-state concentrations of TCA cycle metabolites including α-KG, succinate, fumarate, malate, and citrate were observed in TGF-β1–differentiated myofibroblasts. The concentration of glutamate was also increased in TGF-β1–differentiated myofibroblasts compared with controls, whereas glutamine levels were decreased, suggesting enhanced glutaminolysis. This was associated with TGF-β1–induced expression of the glutaminase (GLS) isoform, GLS1, which converts Gln into glutamate, at both the mRNA and protein levels. The stimulation of GLS1 expression by TGF-β1 was dependent on both SMAD3 and p38 mitogen-activated protein kinase activation. Depletion of extracellular Gln prevented TGF-β1–induced myofibroblast differentiation. The removal of extracellular Gln postmyofibroblast differentiation decreased the expression of the profibrotic markers fibronectin and hypoxia-inducible factor-1α and reversed TGF-β1–induced metabolic reprogramming. Silencing of GLS1 expression, in the presence of Gln, abrogated TGF-β1–induced expression of profibrotic markers. Treatment of GLS1-deficient myofibroblasts with exogenous glutamate or α-KG restored TGF-β1–induced expression of profibrotic markers in GLS1-deficient myofibroblasts. Together, these data demonstrate that glutaminolysis is a critical component of myofibroblast metabolic reprogramming that regulates myofibroblast differentiation.
Keywords: mitochondrial metabolism, myofibroblast, glutamine, transforming growth factor beta (TGF-B), differentiation
Introduction
Although myofibroblasts support normal wound healing, their persistence has been associated with pathological fibrosis and desmoplastic reactions in cancer (1, 2). In the lung, TGF-β1 triggers the differentiation of fibroblasts into myofibroblasts (3). Myofibroblasts are synthetic cells that secrete large amounts of extracellular matrix (4). Myofibroblasts also express α-SMA2 and myosin proteins that assemble stress fibers to facilitate their contractile activity (5). TGF-β1 has been reported to mediate myofibroblast differentiation through activation of the canonical SMAD signaling pathway. However, alternative pathways to SMAD signaling involving p38 MAPK, c-Abl, or c-Jun have also been shown to participate in myofibroblast differentiation (6–8).
The TCA cycle provides precursors for biosynthesis and energy production (9, 10). In cases of energy crisis or in response to anabolic demand, cells up-regulate anaplerotic reactions such as glutaminolysis (11–14). Anaplerotic reactions supply the TCA cycle with metabolites to support the production of reducing equivalents for oxidative phosphorylation (OXPHOS) and anabolic carbons for biosynthesis (15, 16). Glutaminolysis is a two-step reaction that converts Gln into α-ketoglutarate (α-KG). The first step of glutaminolysis leads to the deamidation of Gln to produce Glu and is catalyzed by mitochondrial glutaminase (GLS). The second step of glutaminolysis leads to the conversion of Glu to α-KG and is catalyzed by glutamate dehydrogenase (17) or aminotransferases (18). To date, three mammalian glutaminases have been identified. The liver-type glutaminase (GLS2), the kidney-type glutaminase (KGA), and glutaminase C (GAC), which is a spliced variant of KGA. Both KGA and GAC are referred to as GLS1 (19–23).
Glutaminolysis has also been reported to activate the transcription factor, hypoxia-inducible factor-1 α (HIF-1α) under normoxic conditions (24). HIF-1α regulates the expression of profibrotic markers downstream of TGF-β1–induced SMAD3 activation (25, 26). HIF-1α also regulates the expression of multiple genes involved in metabolic reprogramming (27–29).
We have previously reported that the metabolic reprogramming in TGF-β1–differentiated myofibroblasts results from the up-regulation of mitochondrial biogenesis and the expression of glycolytic enzymes such has hexokinase II and 6-phosphofructo-2-kinase/fructose-2,6-biphosphatase 3 (30, 31). In this study, we investigated the role of mitochondrial glutaminolysis in myofibroblast differentiation induced by TGF-β1. We found that TGF-β1 stimulates glutaminolysis through increasing GLS1 expression in myofibroblasts and that TGF-β1–induced glutaminolysis regulates myofibroblast differentiation.
Results
TGF-β1 increases the steady-state level of TCA cycle metabolites
To determine whether TGF-β1 modulates the activity of the TCA cycle, we analyzed steady-state levels of TCA cycle metabolites in control and TGF-β1–differentiated human lung myofibroblasts. Myofibroblasts demonstrated a marked increase in the steady-state levels of citrate, α-KG, succinate, fumarate, and malate compared with controls (Fig. 1). Glutaminolysis provides α-KG to the TCA cycle following the conversion of Gln to α-KG. The first step of glutaminolysis involves the conversion of Gln into Glu. The concentration of Gln was significantly decreased, whereas Glu levels were increased in myofibroblasts compared with controls in response to TGF-β1 treatment (Fig. 1). These data are consistent with TGF-β1 increasing the flux of TCA cycle metabolites and promoting glutaminolysis.
Figure 1.

TGF-β1 increases steady-state concentration of TCA metabolites in myofibroblasts. Shown is a diagram of targeted metabolomics analysis of human lung fibroblasts (IMR-90 cells) exposed to vehicle or TGF-β1 (2.5 ng/ml, 48 h). The bar graphs correspond to steady-state concentrations of metabolites determined in μm/106 cells. The values represent means ± S.E.; the error bars represent S.E. *, p < 0.05 compared with control (n = 9; 3 biological replicates total, 3 technical replicates per group per experiment).
TGF-β1 up-regulates the expression of glutaminase 1 in myofibroblasts
To determine whether TGF-β1 stimulates glutaminolysis via the regulation of glutaminase expression, we analyzed the protein and mRNA levels of GLS1 and 2 in TGF-β1–differentiated myofibroblasts. We observed that TGF-β1 increased the protein and mRNA levels of both GLS1 isoforms, KGA and GAC, in myofibroblasts compared with controls (Fig. 2, A–D). TGF-β1 increased both GLS1 protein and mRNA expression in a time-dependent manner (Fig. S1, A and B). GLS2 mRNA expression was significantly lower than that of GLS1 in human lung fibroblasts and was not stimulated by TGF-β1 (Fig. 2E). Together, these data suggest that TGF-β1 stimulates glutaminolysis in myofibroblasts through the up-regulation of GLS1 expression.
Figure 2.

TGF-β1 induces GLS1 expression in myofibroblasts. A, total cell lysates were isolated from IMR-90 cells treated with vehicle or TGF-β1 (2.5 ng/ml, 48 h). Then protein levels of GLS1 isoforms KGA, GAC, and β-actin were determined by Western blotting (WB); molecular mass markers are indicated on the left side of the panel. B, densitometry analysis of total GLS1 in total cell lysates from controls or TGF-β1–treated lung fibroblasts (48-h treatment). The values represent means ± S.E.; the error bars represent S.E. *, p < 0.05 compared with control (n = 3; 3 biological replicates total, 1 technical replicate per group per experiment). C and D, analysis of KGA and GAC mRNA in lung fibroblasts treated with vehicle or TGF-β1 (for 48 h) was performed using qPCR. The bar graphs correspond to the effect of TGF-β1 on the mRNA level of KGA (C) and GAC (D). ΔCt was first calculated between each target gene and 18S rRNA. The fold change of each target gene compared with control was calculated using the double ΔCt method (fold change = 2−ΔΔCt). The values represent means ± S.E.; the error bars represent S.E.; *, p < 0.05 compared with control (n = 12; 4 biological replicates total, 3 technical replicates per group per experiment). E, analysis of GLS1 and GLS2 mRNA expression in lung fibroblasts treated with vehicle or TGF-β1 (48 h) was performed using qPCR. The bar graphs correspond to the fold change of GLS2 mRNA relative to 18S rRNA in control or TGF-β1–treated cells. The values represent means ± S.E.; the error bars represent S.E. *, p < 0.001 compared with control (n = 12; 4 biological replicates total, 3 technical replicates per group per experiment).
TGF-β1 regulates the expression of GLS1 through both SMAD3- and p38 MAPK-dependent signaling pathways
TGF-β1 has been shown to mediate myofibroblast differentiation, primarily through the activation of the canonical SMAD signaling pathway. However, TGF-β1 has also been reported to stimulate alternative pathways to SMAD during differentiation such as the p38 MAPK pathway. To determine whether TGF-β1 up-regulates GLS1 expression through its binding to TGF-β type I receptor activin receptor-like kinase ALK5 (32), we analyzed the effect of a specific inhibitor (SB431542) of the ALK5 receptor on TGF-β1–induced GLS1 (33, 34). The blockade of ALK5 with SB431542 prevented the up-regulation of both KGA and GAC protein and mRNA expression in myofibroblasts compared with controls (TGF-β1–treated lung fibroblasts treated with vehicle) (Fig. 3, A–C). As a positive control for the blockade of ALK5, we analyzed the effect of SB431542 on the expression of α-SMA, a marker of myofibroblast differentiation. We observed that SB431542 prevented the expression of α-SMA in response to TGF-β1 in lung fibroblasts compared with controls (Fig. 3D). We next investigated effects of silencing SMAD3 using siRNA on TGF-β1–induced GLS1 expression. The silencing of SMAD3 inhibited TGF-β1–induced expression of GLS1 protein and mRNA compared with controls (lung fibroblasts transfected with a non-targeting (NT) siRNA). SMAD3 silencing significantly reduced baseline mRNA levels of both KGA and GAC (Fig. 3, E and F), supporting an essential role for canonical SMAD signaling in this response.
Figure 3.
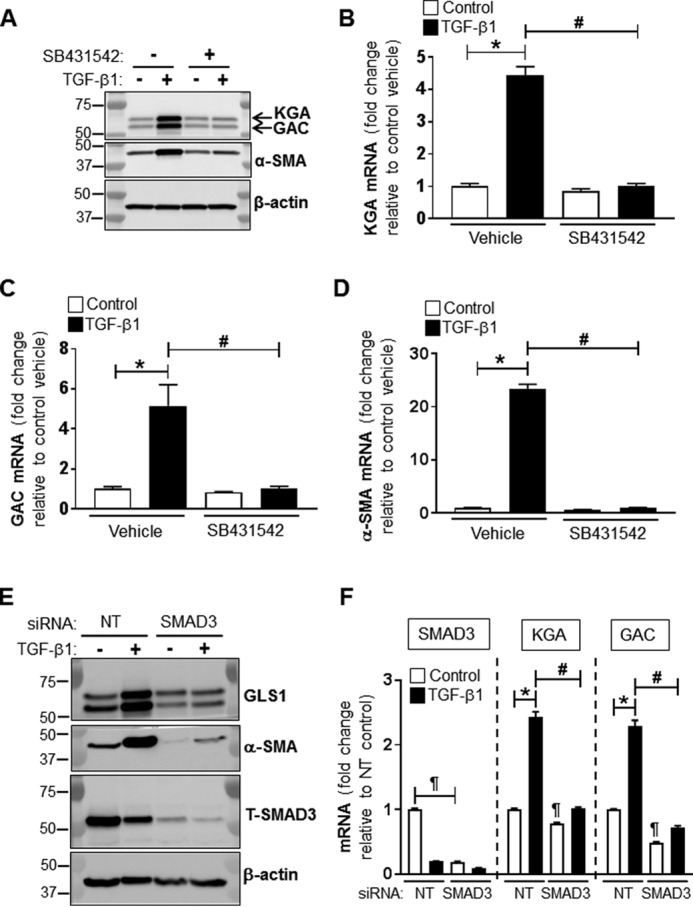
SMAD3 mediates TGF-β1–induced GLS1 expression. A, total cell lysates were isolated from lung fibroblasts treated with DMSO or SB431542 (5 μm) and with or without TGF-β1 (2.5 ng/ml, 48 h). DMSO or SB431542 were applied 30 min prior the addition of TGF-β1. Then protein levels of GLS1 (KGA and GAC isoforms), α-SMA, and β-actin were determined by WB; molecular mass markers are indicated on the left side of the panel. B–D, analysis of KGA, GAC, and α-SMA mRNA by qPCR in lung fibroblasts treated as described for A. The bar graphs correspond to the effect of SB431542 on the mRNA level of KGA (B), GAC (C), and α-SMA (D). ΔCt was first calculated between each target gene and 18S rRNA. The fold change of each target gene compared with control was calculated using the double ΔCt method (fold change = 2−ΔΔCt). The values represent means ± S.E.; the error bars represent S.E. *, p < 0.05 compared with control (n = 6; 2 biological replicates total, 3 technical replicates per group per experiment). E, total cell lysates were isolated from lung fibroblasts transfected with NT or SMAD3 siRNA (100 nm) and treated with or without TGF-β1 (2.5 ng/ml, 48 h). Then protein levels of total SMAD3 (T-SMAD3), GLS1 (KGA and GAC isoforms), α-SMA, and β-actin were determined by WB; molecular mass markers are indicated on the left side of the panel. F, analysis of SMAD3, KGA, and GAC mRNA by qPCR in lung fibroblasts treated as described for A. The values represent means ± S.E.; the error bars represent S.E. *, p < 0.05 compared with control (n = 6; 2 biological replicates total, 3 technical replicates per group per experiment).
To determine whether the p38 MAPK pathway also contributes to the stimulation of GLS1 expression by TGF-β1, we analyzed the effect of a dominant-negative mutant of p38 MAPK (35) on TGF-β1–induced GLS1 in myofibroblasts. TGF-β1–induced GLS1 protein was decreased by 23% in myofibroblasts overexpressing the p38 MAPK dominant-negative mutant compared with controls (lung fibroblasts transfected with empty pcDNA3.1 vector) (Fig. S2, A–C). Together, these data suggest that TGF-β1 mediates its action on GLS1 expression through the combined activation of the SMAD3 and p38 MAPK-dependent pathways.
Myofibroblast differentiation by TGF-β1 is dependent on the availability of glutamine
To determine whether myofibroblast differentiation requires Gln, we analyzed the effects of withdrawing extracellular Gln on the expression of myofibroblast differentiation markers. The removal of extracellular Gln prior to TGF-β1 treatment of lung fibroblasts decreased the baseline expression of fibronectin by 55% and Col1A to undetectable levels, whereas the baseline expression of α-SMA was not significantly affected (Fig. 4A). Gln depletion also reduced TGF-β1–induced expression of fibronectin and α-SMA. Protein levels of fibronectin and α-SMA were decreased by 75 and 86% at 24 h post-TGF-β1 treatment compared with controls. Gln depletion inhibited TGF-β1–induced expression of Col1A1 (Fig. 4, A and B). We next sought to determine whether the withdrawal of extracellular Gln reverses TGF-β1–induced myofibroblast differentiation. To test this possibility, Gln was removed from the culture medium post-TGF-β1 treatment of lung fibroblasts. We observed that the removal of Gln from TGF-β1–differentiated myofibroblasts reduced the protein levels of fibronectin and HIF-1α by 48 and 53%; however, the lack of Gln did not affect TGF-β1–induced α-SMA (Fig. 4, C and D). These data suggest that the sustained activation of myofibroblasts is dependent on the availability of Gln. However, Gln depletion does not promote de-differentiation of myofibroblasts.
Figure 4.

Myofibroblast differentiation and metabolic reprogramming require Gln. A, total cell lysates were isolated from lung fibroblasts treated with or without TGF-β1 (2.5 ng/ml, 0, 24, or 48 h) in the presence or absence of extracellular Gln. Then protein levels of α-SMA, FN, Col1A1, and β-actin were determined by WB; molecular mass markers are indicated on the left side of the panel. B, densitometry analysis of FN, α-SMA, and Col1A1 protein levels determined as described for A. The bar graph summarizes effects of withdrawing Gln from the extracellular culture medium on TGF-β1–induced expression of FN, α-SMA, and Col1A1. The values represent means ± S.E.; the error bars represent S.E. *, p < 0.05 compared with non-differentiated lung fibroblasts grown in the presence of Gln; #, p < 0.05 compared with TGF-β1–treated lung fibroblasts grown in the presence of Gln; ¶, p < 0.05 compared with non-differentiated lung fibroblasts grown in presence of Gln; n.s. stands for non-significant difference between means (n = 3; 3 biological replicates total, 1 technical replicate per group per experiment). C, total cell lysates were isolated from lung fibroblasts treated with or without TGF-β1 (2.5 ng/ml, 24 h) and switched or not to Gln-free medium for 24 h post–TGF-β1 treatment. Then protein levels of FN, HIF-1α, α-SMA, and GAPDH were determined by WB; molecular mass markers are indicated on the left side of the panel. D, densitometry analysis of FN, HIF-1α, and α-SMA protein levels determined as described for C. The bar graph summarizes effects of withdrawing Gln from the extracellular culture medium post–TGF-β1 treatment on the expression of FN, HIF-1α, and α-SMA. The values represent means ± S.E.; the error bars represent S.E. *, p < 0.05 compared with non-differentiated lung fibroblasts grown in presence of Gln; #, p < 0.05 compared with TGF-β1–treated lung fibroblasts grown in presence of Gln; n.s. stands for non-significant difference between means (n = 3; 3 biological replicates total, 1 technical replicate per group per experiment). E, bioenergetic map of lung fibroblasts representing the shift in OCR and ECAR following the switch of cells treated with or without TGF-β1 to Gln-free medium.
We previously reported that myofibroblast differentiation requires metabolic reprogramming characterized by an increase in OXPHOS and glycolysis (30). To determine whether this metabolic reprogramming utilizes Gln, we analyzed the effects of removing Gln post TGF-β1–induced differentiation on the oxygen consumption rate (OCR) and the extracellular acidification rate (ECAR) of myofibroblasts. As described previously, TGF-β1 treatment increased OCR and ECAR in myofibroblasts compared with undifferentiated lung fibroblasts which we have shown is due to transformation of myofibroblasts to a more oxidative and glycolytic phenotype (30). Gln depletion decreased both OCR and ECAR, at baseline, in undifferentiated lung fibroblasts. The removal of Gln post TGF-β1–induced differentiation significantly reduced both OCR and ECAR in myofibroblasts. OCR decreased from 57 to 45 pmol/min per 25,000 cells, and ECAR decreased from 47 to 28 mpH/min per 25,000 cells in myofibroblasts (Fig. 4E). OCR and ECAR traces and their analyses are shown in Figs. S3 and S4. Together, these data suggest that Gln is necessary for sustained expression of profibrotic markers and metabolic reprogramming in myofibroblasts.
GLS1 and α-KG production are required for myofibroblast differentiation
To determine whether the conversion of Gln to α-KG by glutaminolysis is required for myofibroblast differentiation, we analyzed effects of blocking glutaminolysis on myofibroblast differentiation. Glutaminolysis was inhibited by RNAi-mediated silencing of GLS1. The silencing efficiency of the GLS1 siRNA used for these studies was assessed by Western blot analysis (Fig. 5, A and F). Silencing of GLS1 inhibited TGF-β1–induced expression of the differentiation markers α-SMA, fibronectin, Col1A1, and HIF-1α in lung fibroblasts (Fig. 5, A–E). The addition of exogenous glutamate or α-KG restored TGF-β1–induced expression of α-SMA and HIF-1α in GLS1-deficient lung myofibroblasts to a level similar to that of α-SMA and HIF-1α expression in controls (Fig. 6, A and B). Together, these data suggest that myofibroblast differentiation depends on the availability of glutamate and α-KG from TGF-β1–stimulated glutaminolysis.
Figure 5.

GLS1 silencing prevent TGF-β1–induced expression of profibrotic markers. A, total cell lysates were isolated from lung fibroblasts transfected with NT or GLS1 siRNA (100 nm) and treated with or without TGF-β1 (2.5 ng/ml, 48 h). Then protein levels of α-SMA, FN, Col1A1, HIF-1α, GLS1, and β-actin were determined by WB; molecular mass markers are indicated on the left side of the panel. B–F, densitometry analyses of total protein levels of α-SMA, FN, Col1A1, HIF-1α, and GLS1 determined as described for A. The values represent means ± S.E.; the error bars represent S.E. *, p < 0.01 compared with NT transfected non-differentiated lung fibroblasts; #, p < 0.05 compared with NT transfected TGF-β1–treated lung fibroblasts; ¶, p < 0.005 compared with NT transfected non-differentiated lung fibroblasts (n = 5; 5 biological replicates total, 1 technical replicate per group per experiment).
Figure 6.
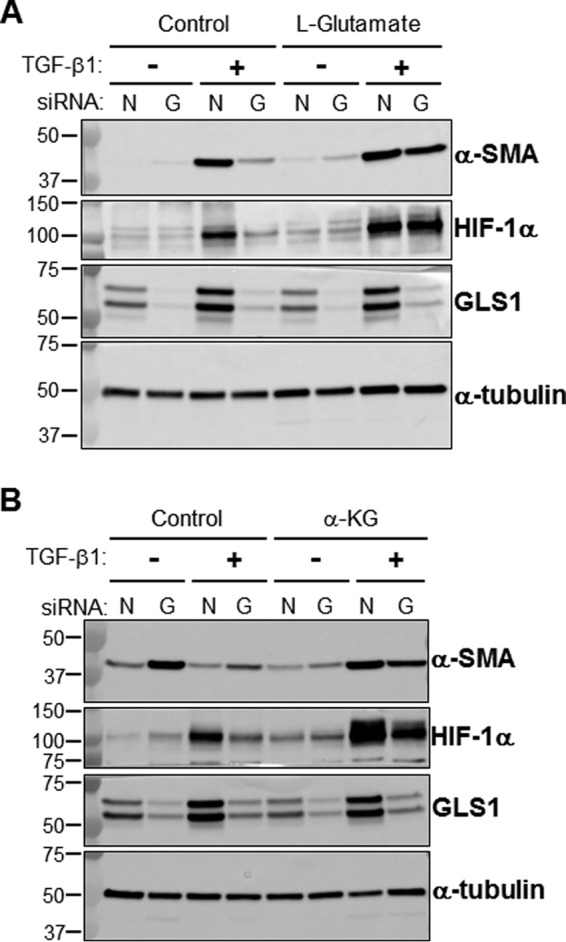
Exogenous glutamate or α-KG restores the expression of profibrotic markers in GLS1-deficient myofibroblasts. A, total cell lysates were isolated from lung fibroblasts transfected with NT (lanes N) or GLS1 (lanes G) siRNA (100 nm), treated with or without l-glutamic acid (2 mm), and treated with or without TGF-β1 (2.5 ng/ml, 48 h). l-Glutamic acid was added in the reduced serum DMEM (0.5% fetal calf serum supplemented with 2 mm l-glutamine) 1 h prior to the addition of TGF-β1. Then protein levels of α-SMA, HIF-1α, GLS1, and α-tubulin were determined by WB; molecular mass markers are indicated on the left side of the panel (representative WB of n = 3). B, total cell lysates were isolated from lung fibroblasts transfected with NT or GLS1 siRNA (100 nm), treated with or without diethyl-2-oxopentanedioate (esterified form of α-KG, 2 mm), and treated with or without TGF-β1 (2.5 ng/ml, 48 h). Diethyl-2-oxopentanedioate was added in the reduced serum DMEM (0.5% fetal calf serum supplemented with 2 mm l-glutamine) 24 h prior to the addition of TGF-β1. Then protein levels of α-SMA, HIF-1α, GLS1, and α-tubulin were determined by WB; molecular mass markers are indicated on the left side of the panel (representative WB of n = 3).
HIF-1α has been reported to control glutamine-mediated redox homeostasis via the regulation of GLS1 expression (36). Our data show that HIF-1α protein and mRNA peak at 6 h post-TGF-β1 (Fig. S1, A and B). Although reduced compared with the 6-h time point, HIF-1α protein levels remained 75% higher than baseline at 48 h post-TGF-β1 (Fig. 5, A and E, and Fig. S1). To determine whether HIF-1α participates in TGF-β1–induced GLS1 expression in human lung fibroblasts, we silenced HIF-1α expression using an RNAi-based approach. Although basal and TGF-β1–induced expression of KGA was modestly suppressed in HIF-1α–deficient fibroblasts, the levels of GAC were increased (Fig. S5, A and B). Thus, although HIF-1α may influence splicing of GLS1 isoforms, there does not appear to be an effect on the overall expression of GLS1.
Discussion
In this study we tested the role of glutaminolysis in TGF-β1–dependent myofibroblast differentiation. Our data indicate that TGF-β1 enhances glutaminolysis in myofibroblasts by increasing the expression of the glutaminase isoform, GLS1. TGF-β1 induces GLS1 expression through a SMAD3 and p38 MAPK-dependent signaling pathway. TGF-β1–induced glutaminolysis increases the TCA cycle–derived metabolite, α-KG, and its downstream intermediates including succinate, fumarate, and malate. Blockade of glutaminolysis using Gln-free culture medium or silencing of GLS1 prevented TGF-β1–induced myofibroblast differentiation. These studies identify glutaminolysis as an essential TGF-β1–regulated metabolic pathway that is utilized by myofibroblasts for their bioenergetic and biosynthetic functions (Fig. 7).
Figure 7.
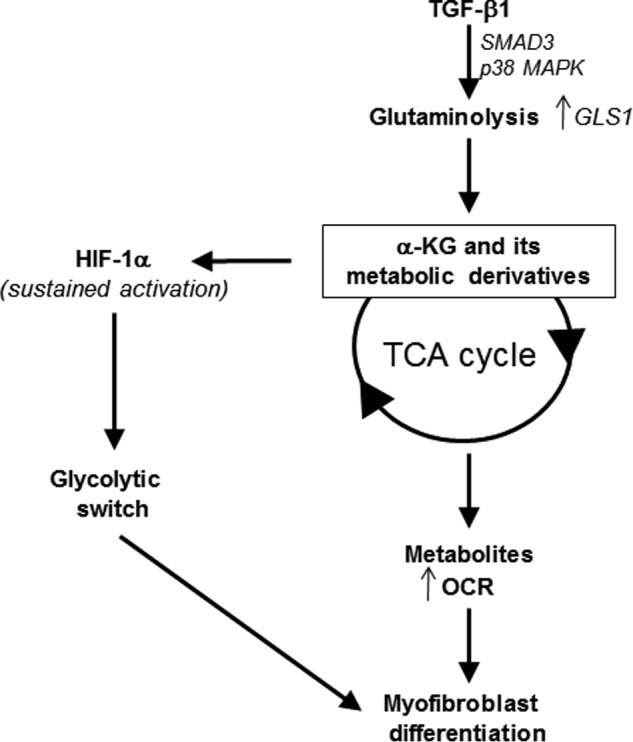
Schematic representing the regulation of myofibroblast differentiation by TGF-β1–induced glutaminolysis.
Our data suggest that glutaminolysis serves as an anaplerotic pathway in activated myofibroblast by supplying α-KG to the TCA cycle. Glutaminolysis has been well characterized as an anaplerotic reaction in cancer cells where it supports tumorigenesis and metastasis (14, 37, 38). Enhanced glutaminolysis in cancer cells provides the TCA cycle with α-KG, which is then converted into anabolic carbons through the process of oxidative metabolism. Anabolic metabolites resulting from enhanced glutaminolysis are then used by enzymatic reactions that sustain cell growth and/or proliferation. The attenuated response to TGF-β1 of lung fibroblasts deficient in GLS1 or grown in absence of Gln indicates a critical role for glutaminolysis in supporting myofibroblast differentiation in response to TGF-β1. However, the removal of Gln postdifferentiation only partially reversed the myofibroblast phenotype, indicating that the pathways responsible for inducing differentiation are not always necessary to maintain the differentiated state (39, 40).
Importantly, our data indicate that suppressing glutaminolysis after myofibroblast differentiation reverses TGF-β1–induced metabolic reprogramming. Increasing the flux of α-KG in the TCA cycle ultimately serves to provide reducing equivalents to the mitochondrial electron transport chain for the production of ATP (14, 41). Myofibroblasts are synthetic and contractile cells, and these functions of myofibroblasts are dependent on OXPHOS and ATP production (30). TGF-β1–stimulated glutaminolysis may therefore support myofibroblast functions by satisfying bioenergetic demands through an increase in OXPHOS (cataplerosis) and biosynthetic needs through providing anabolic carbons (anaplerosis). Thus, glutaminolysis during myofibroblast differentiation may be considered an amphibolic process, serving both catabolic and anabolic functions.
Myofibroblast metabolic reprogramming is characterized by an increase in both OXPHOS and glycolysis. The transcription factor HIF-1α is a key regulator of the glycolytic switch central to metabolic reprogramming. HIF-1α controls the expression of several key enzymes involved in glycolysis such as hexokinase II, GLUT-1, GLUT-3, and 6-phosphofructo-2-kinase/fructose-2,6-biphosphatase 3. Under normoxia, the stabilization of HIF-1α has been attributed to the inhibition of prolyl hydroxylases, which target HIF-1α for proteasomal degradation (42–45). The accumulation of TCA cycle-derived metabolites succinate and fumarate have been reported to block prolyl hydroxylase activity and stabilize HIF-1α in cancer cells (46–49). TGF-β1 treatment of lung fibroblasts increases steady-state concentrations of succinate and fumarate. Our data also demonstrate that stabilization of HIF-1α at 48 h post-TGF-β1 under normoxia (or relative hyperoxia) in myofibroblasts depends on GLS1 expression. Therefore, it is likely that TGF-β1–induced glutaminolysis, through augmenting succinate and fumarate levels, underlies the sustained activation (after 6 h of TGF-β1 treatment) of HIF-1α and thereby supports the glycolytic switch, which we have shown is key to myofibroblast differentiation and contraction (30).
HIF-1α has also been shown to regulate GLS1 expression (36). We examined whether upstream induction of HIF-1α was necessary for TGF-β1–induced expression of GLS1. Although silencing of HIF-1α did not prevent TGF-β1 stimulation of GLS1 expression, we found marked inhibition of HIF-1α induction when GLS1 expression was silenced; this supports our model of a downstream effect of sustained HIF-1α induction in TGF-β1/GLS1–dependent differentiation and activation of myofibroblasts.
Myofibroblasts are crucial cellular effectors of dysregulated wound repair responses that result in tissue fibrosis and the stromal response to many cancers. Our studies provide proof of concept that targeting glutaminolysis may be an effective strategy in ameliorating the progression of fibrotic diseases and/or cancers that are characterized by myofibroblast activation.
Experimental procedures
Cell culture
Human diploid fetal lung fibroblasts (IMR-90 cells) at low population doubling (PDL 7) were purchased from Coriell Cell Repositories (Camden, NJ). Lung fibroblasts were cultured in DMEM (Life Technologies Inc.) supplemented with 10% fetal calf serum (HyClone Laboratories, Logan, UT), 100 units/ml penicillin, 100 μg/ml streptomycin, 1.25 μg/ml amphotericin B, and 2 mm l-glutamine at 37 °C in 5% CO2, 95% air. Before treatment with porcine platelet-derived TGF-β1 (2.5 ng/ml; R&D Systems), the cells were switched to 0.5% fetal calf serum containing DMEM supplemented with 100 units/ml penicillin, 100 μg/ml streptomycin, and 1.25 μg/ml amphotericin B with or without 2 mm l-glutamine.
Reagents
We purchased antibodies to fibronectin (clone IST4, mouse mAb that recognizes an epitope located within the fifth type III repeat of human plasma fibronectin; catalog no. F0916, lot no. 104M4801V), β-actin (clone AC-15, mouse mAb against N-terminal peptide; catalog no. A1978, lot no. 043M4840V), and α-tubulin (clone B-5-1-2, mouse mAb against C-terminal peptide; catalog no. T5168, lot no. 103M4773V) from Sigma. SMAD3 (clone C67H9, rabbit mAb against amino residues within the amino terminus of SMAD3; catalog no. 9523, lot no. 7), HIF-1α (clone D2U3T, rabbit mAb against residues surrounding Lys-460 of human HIF-1α; catalog no. 14179, lot no. 1), and GAPDH (clone D16H11, rabbit mAb against residues near the carboxyl terminus of human GAPDH; catalog no. 5174S, lot no. 4) antibodies were purchased from Cell Signaling Technology. Antibodies to GLS1 (rabbit polyclonal antibodies directed against a KGA/GAC fusion protein; catalog no. 12885-1-AP, lot no. 00024296) was purchased from Proteintech. Antibodies to α-SMA (clone ASM-1, mouse mAb raised against a synthetic NH2 terminus decapeptide of α-smooth-muscle isoform of actin; catalog no. 03–61001, lot no. 406021) was purchased from ARP.
We purchased siRNA (Stealth siRNA) from Invitrogen, including GLS1 (GLSHSS178458; catalog no. 1299001), SMAD3 (SMAD3VHS41111; catalog no. 1299001), HIF-1α (HIF1AHSS179231; catalog no. 1299001), and NT (Stealth RNAiTM siRNA negative control kit, catalog no. 12935200). SB431542 (catalog no. 1614, batch #9A/194913) was purchased from Tocris Bioscience. l-Glutamic acid (catalog no. G1251, lot no. SLBS0553V) was purchased from Sigma, and diethyl-2-oxopentanedioate (esterified form of α-KG; catalog no. AK126628, lot no. WG0168398–170418001) was purchased from Ark Pharm, Inc. pCMV-p38DN was a generous gift from Dr. Roger Davis (University of Massachusetts) (50) and Dr. A. Brent Carter (University of Alabama at Birmingham).
Targeted metabolomics
Lung fibroblasts were plated on 100-mm dishes at 8.5 × 10⁵ cells/dish. At 80% confluency, the cells were growth arrested by switching the culture medium to a reduced serum medium (0.5% fetal calf serum containing DMEM supplemented with 100 units/ml penicillin, 100 μg/ml streptomycin, 1.25 μg/ml amphotericin B, and 2 mm l-glutamine). After 16 h in reduced serum medium, TGF-β1 was added at a final concentration of 2.5 ng/ml for 48 h. Upon completion of treatment, the cells were washed with 5 ml of ice-cold PBS. The cells were then lysed and scraped in 5 ml of HPLC grade ice-cold methanol and incubated at −80 °C for 2 h. The plates were scraped again, and the cell lysates were transferred to glass tubes, where they were centrifuged at ∼1000 × g for 20 min at 4 °C. The supernatants were transferred to new glass tubes and stored at −80 °C until further processing (51).
Standards were generated as a master mix of all compounds at 100 μg/ml in H2O and serial-diluted to 10× of the final concentrations (0.05–10 μg/ml, 9 standards). Standards were further diluted to 1× in methanol to a total volume of 1 ml and dried by a gentle stream of N2. For cell extracts, 1 ml of each were transferred to a glass tube and dried under a gentle stream of N2. Standards and samples were resuspended in 50 μl of 5% acetic acid and vortexed for 15 s. AmplifexTM Keto Reagent (SCIEX, Concord, Canada) (50 μl) was added to each sample and allowed to react for 1 h at room temperature. Standards and samples were then dried under a gentle stream of N2 and resuspended in 1 ml and 500 μl of 0.1% formic acid, respectively.
Samples were analyzed by LC–multiple reaction ion monitoring–mass spectrometry. Liquid chromatography was performed by LC20AC HPLC system (Shimadzu, Columbia, MD) with a Synergi Hydro-RP 4 μm 80 A 250 × 2-mm inner diameter column (Phenomenex, Torrance, CA). The mobile phases were: (a) 0.1% formic acid and (b) methanol, 0.1% formic acid. The compounds were eluted using a 5–40% linear gradient of B from 1 to 7 min, followed by a column wash of 40–100% B from 7 to 10 min, and re-equilibrated at 5% B from 10.5 to 15 min. Column eluent was passed into an electrospray ionization interface of an API 4000 triple-quadrupole mass spectrometer (SCIEX). The following mass transitions were monitored in the positive ion mode: m/z 261/118 for α-KG. In the negative mode, the following transitions are monitored: m/z 115/71 for fumarate, m/z 117/73 for succinate, m/z 133/115 for malate, m/z 191/87 for citrate, m/z146/102 for glutamate, and m/z 145/42 for glutamine. Each transition was monitored for 35 ms, with a total cycle time of 560 ms. MS parameters were CAD 4, CUR 15, GS1 60, GS2 30, TEM 600, and IS −3500 V for the negative polarity mode and IS 4500 for the positive polarity mode. Peak areas of metabolites in the sample extracts are compared in MultiQuant software (SCIEX) to those of the known standards to calculate metabolite concentrations in cell extracts. Dilution factors correction was also applied to samples within MultiQuant software.
Real-time PCR
Real-time PCR was performed as described in Ref. 30. The primer sequences for KGA, GAC, GLS1, GLS2, α-SMA, and SMAD3 are given in Table 1.
Table 1.
Primer sequences
| Gene (accession number) | Primer sequence (5′ → 3′) | Product size |
|---|---|---|
| bp | ||
| GLS1 variant 1, KGA (NM_014905.4) | ||
| Forward | CTGGAAGCCTGCAAAGTAAAC | 131 |
| Reverse | TGAGGTGTGTACTGGACTTGG | |
| GLS1 variant 2, GAC (NM_001256310.1) | ||
| Forward | CCTCGAAGAGAAGGTGGTGATC | 124 |
| Reverse | TGTCCTCATTTGACTCAGGTGAC | |
| GLS2 (NM_013267.3) | ||
| Forward | CTTCTGCCAGAAGTTGGTGTCTCTC | 153 |
| Reverse | GCTGCCTATAGTGGCGATGTCTC | |
| α-SMA (NM_001498) | ||
| Forward | TCCTCATCCTCCCTTGAGAA | 107 |
| Reverse | ATGAAGGATGGCTGGAACAG | |
| SMAD3 (NM_001145102.1) | ||
| Forward | CAGGGCTTTGAGGCTGTCTAC | 143 |
| Reverse | GCAAAGGCCCATTCAGGTG | |
| 18S rRNA (NR_003286.2) | ||
| Forward | GTCTGCCCTATCAACTTTCG | 111 |
| Reverse | ATGTGGTAGCCGTTTCTCAG |
Transfection
siRNA transfection was carried out in Opti-MEM (Thermo Fisher Scientific) using Lipofectamine RNAi/MAX (Invitrogen) and according to the manufacturer's instructions. The final concentration of NT, GLS1, or SMAD3 siRNA was 100 nm. 48 h post-transfection, lung fibroblasts were growth arrested by replacing the transfection medium with 0.5% fetal calf serum DMEM supplemented with 2 mm l-glutamine. Plasmid transfection was performed as described in Ref. 30. siRNA sequences for SMAD3, GLS1, HIF-1α, and NT are given in Table 2.
Table 2.
siRNA sequences
| Gene (accession number) | siRNA sequence (5′ → 3′) |
|---|---|
| SMAD3 (NM_001145102.1) | |
| Sense | CCAGAGAGUAGAGACACCAGUUCUA |
| Anti-sense | UAGAACUGGUGUCUCUACUCUCUGG |
| GLS1 (NM_014905.4) | |
| Sense | UGCAACGUUUCAGUCUGAAAGAGAA |
| Anti-sense | UUCUCUUUCAGACUGAAACGUUGCA |
| HIF-1α (NM_001243084.1) | |
| Sense | GAAAUUCCUUUAGAUAGCAAGACUU |
| Antisense | AAGUCUUGCUAUCUAAAGGAAUUUC |
Western immunoblotting
Total cell lysates were prepared in radioimmune precipitation assay buffer (150 mm NaCl, 1.0% Igepal® CA-630, 0.5% sodium deoxycholate, 0.1% SDS, 50 mm Tris, pH 8.0; Sigma–Aldrich) supplemented with protease and phosphatase inhibitor mixtures (complete, Mini, EDTA-free, and PhosSTOP, purchased from Roche). Lysates were then subjected to SDS-PAGE under reducing conditions, and Western immunoblotting was performed as described previously (3). Immunoblots were imaged using an Amersham Biosciences 600 Imager (GE Healthcare). The signals were quantitated using ImageQuant TL software.
Assessment of bioenergetics and mitochondrial assay
Lung fibroblasts were plated on Seahorse extracellular analyzer XF96 plates in reduced serum culture medium alone or supplemented with 2 mm l-glutamine. Measurements of the OCR and extracellular acidification were performed as described in Refs. 30 and 52).
Statistical analysis
Statistical analysis was performed using GraphPad software. The data are presented as means ± S.E. Statistical comparisons were made by performing unpaired Student's t tests unless otherwise indicated.
Author contributions
K. B., J. Z., and V. J. T. conceptualization; K. B. data curation; K. B., N. J. L., G. A. B., J. Z., V. M. D.-U., and V. J. T. formal analysis; K. B. supervision; K. B. validation; K. B., N. J. L., G. A. B., and Y. S. investigation; K. B. visualization; K. B. and V. M. D.-U. methodology; K. B. and V. J. T. writing-original draft; J. Z. and V. M. D.-U. writing-review and editing.
Supplementary Material
Acknowledgments
We thank Dr. Roger Davis (University of Massachusetts) and Dr. A. Brent Carter (University of Alabama at Birmingham) for providing us with the p38 MAPK mutant used in this study. We thank Dr. Stephen Barnes and Taylor F. Berryhill (Targeted Metabolomics and Proteomics Laboratory, University of Alabama at Birmingham). The University of Alabama at Birmingham O'Brien Acute Kidney Injury Center for the operation of the Targeted Metabolomics and Proteomics Laboratory, the University of Alabama at Birmingham Lung Health Center, and the University of Alabama at Birmingham Center for Free Radical Biology are supported by National Institutes of Health Grants P01 HL114470, R01 AG046210, and P30 DK079337.
This work was supported by VA Merit Award I01BX003056 (to V. J. T.). The authors declare that they have no conflicts of interest with the contents of this article. The content is solely the responsibility of the authors and does not necessarily represent the official views of the National Institutes of Health.
This article contains Figs. S1–S5.
- α-SMA
- α-smooth muscle actin
- α-KG
- α-ketoglutarate
- HIF
- hypoxia-inducible factor
- TCA
- tricarboxylic acid
- GLS
- glutaminase
- KGA
- kidney-type glutaminase
- OXPHOS
- oxidative phosphorylation
- GAC
- glutaminase C
- NT
- non-targeting
- FN
- fibronectin
- OCR
- oxygen consumption rate
- ECAR
- extracellular acidification rate
- qPCR
- quantitative PCR
- MAPK
- mitogen-activated protein kinase
- DMEM
- Dulbecco's modified Eagle's medium.
References
- 1. Radisky D. C., Kenny P. A., and Bissell M. J. (2007) Fibrosis and cancer: do myofibroblasts come also from epithelial cells via EMT? J. Cell. Biochem. 101, 830–839 10.1002/jcb.21186 [DOI] [PMC free article] [PubMed] [Google Scholar]
- 2. Duffield J. S., Lupher M., Thannickal V. J., and Wynn T. A. (2013) Host responses in tissue repair and fibrosis. Annu. Rev. Pathol. 8, 241–276 10.1146/annurev-pathol-020712-163930 [DOI] [PMC free article] [PubMed] [Google Scholar]
- 3. Thannickal V. J., Lee D. Y., White E. S., Cui Z., Larios J. M., Chacon R., Horowitz J. C., Day R. M., and Thomas P. E. (2003) Myofibroblast differentiation by transforming growth factor-β1 is dependent on cell adhesion and integrin signaling via focal adhesion kinase. J. Biol. Chem. 278, 12384–12389 10.1074/jbc.M208544200 [DOI] [PubMed] [Google Scholar]
- 4. Phan S. H. (2003) Fibroblast phenotypes in pulmonary fibrosis. Am. J. Respir. Cell Mol. Biol. 29, S87–S92 [PubMed] [Google Scholar]
- 5. Desmoulière A., Chaponnier C., and Gabbiani G. (2005) Tissue repair, contraction, and the myofibroblast. Wound Repair Regen. 13, 7–12 10.1111/j.1067-1927.2005.130102.x [DOI] [PubMed] [Google Scholar]
- 6. Derynck R., and Zhang Y. E. (2003) Smad-dependent and Smad-independent pathways in TGF-β family signalling. Nature 425, 577–584 10.1038/nature02006 [DOI] [PubMed] [Google Scholar]
- 7. Leask A., and Abraham D. J. (2004) TGF-β signaling and the fibrotic response. FASEB J. 18, 816–827 10.1096/fj.03-1273rev [DOI] [PubMed] [Google Scholar]
- 8. Horowitz J. C., Lee D. Y., Waghray M., Keshamouni V. G., Thomas P. E., Zhang H., Cui Z., and Thannickal V. J. (2004) Activation of the pro-survival phosphatidylinositol 3-kinase/AKT pathway by transforming growth factor-β1 in mesenchymal cells is mediated by p38 MAPK-dependent induction of an autocrine growth factor. J. Biol. Chem. 279, 1359–1367 10.1074/jbc.M306248200 [DOI] [PMC free article] [PubMed] [Google Scholar]
- 9. Anderson N. M., Mucka P., Kern J. G., and Feng H. (2017) The emerging role and targetability of the TCA cycle in cancer metabolism. Protein Cell, 1–22 10.1007/s13238-017-0451-1 [DOI] [PMC free article] [PubMed] [Google Scholar]
- 10. Baldwin J. E., and Krebs H. (1981) The evolution of metabolic cycles. Nature 291, 381–382 10.1038/291381a0 [DOI] [PubMed] [Google Scholar]
- 11. Portais J. C., Voisin P., Merle M., and Canioni P. (1996) Glucose and glutamine metabolism in C6 glioma cells studied by carbon 13 NMR. Biochimie 78, 155–164 10.1016/0300-9084(96)89500-9 [DOI] [PubMed] [Google Scholar]
- 12. Le A., Lane A. N., Hamaker M., Bose S., Gouw A., Barbi J., Tsukamoto T., Rojas C. J., Slusher B. S., Zhang H., Zimmerman L. J., Liebler D. C., Slebos R. J., Lorkiewicz P. K., Higashi R. M., et al. (2012) Glucose-independent glutamine metabolism via TCA cycling for proliferation and survival in B cells. Cell Metab. 15, 110–121 10.1016/j.cmet.2011.12.009 [DOI] [PMC free article] [PubMed] [Google Scholar]
- 13. Reitzer L. J., Wice B. M., and Kennell D. (1979) Evidence that glutamine, not sugar, is the major energy source for cultured HeLa cells. J. Biol. Chem. 254, 2669–2676 [PubMed] [Google Scholar]
- 14. DeBerardinis R. J., Mancuso A., Daikhin E., Nissim I., Yudkoff M., Wehrli S., and Thompson C. B. (2007) Beyond aerobic glycolysis: transformed cells can engage in glutamine metabolism that exceeds the requirement for protein and nucleotide synthesis. Proc. Natl. Acad. Sci. U.S.A. 104, 19345–19350 10.1073/pnas.0709747104 [DOI] [PMC free article] [PubMed] [Google Scholar]
- 15. Owen O. E., Kalhan S. C., and Hanson R. W. (2002) The key role of anaplerosis and cataplerosis for citric acid cycle function. J. Biol. Chem. 277, 30409–30412 10.1074/jbc.R200006200 [DOI] [PubMed] [Google Scholar]
- 16. Glick G. D., Rossignol R., Lyssiotis C. A., Wahl D., Lesch C., Sanchez B., Liu X., Hao L. Y., Taylor C., Hurd A., Ferrara J. L., Tkachev V., Byersdorfer C. A., Boros L., and Opipari A. W. (2014) Anaplerotic metabolism of alloreactive T cells provides a metabolic approach to treat graft-versus-host disease. J. Pharmacol. Exp. Ther. 351, 298–307 10.1124/jpet.114.218099 [DOI] [PMC free article] [PubMed] [Google Scholar]
- 17. Altman B. J., Stine Z. E., and Dang C. V. (2016) From Krebs to clinic: glutamine metabolism to cancer therapy. Nat. Rev. Cancer. 16, 749 10.1038/nrc.2016.114 [DOI] [PubMed] [Google Scholar]
- 18. Moreadith R. W., and Lehninger A. L. (1984) Purification, kinetic behavior, and regulation of NAD(P)+ malic enzyme of tumor mitochondria. J. Biol. Chem. 259, 6222–6227 [PubMed] [Google Scholar]
- 19. Krebs H. A. (1935) Metabolism of amino-acids: the synthesis of glutamine from glutamic acid and ammonia, and the enzymic hydrolysis of glutamine in animal tissues. Biochem. J. 29, 1951–1969 10.1042/bj0291951 [DOI] [PMC free article] [PubMed] [Google Scholar]
- 20. Shapiro R. A., Farrell L., Srinivasan M., and Curthoys N. P. (1991) Isolation, characterization, and in vitro expression of a cDNA that encodes the kidney isoenzyme of the mitochondrial glutaminase. J. Biol. Chem. 266, 18792–18796 [PubMed] [Google Scholar]
- 21. Elgadi K. M., Meguid R. A., Qian M., Souba W. W., and Abcouwer S. F. (1999) Cloning and analysis of unique human glutaminase isoforms generated by tissue-specific alternative splicing. Physiol. Genomics 1, 51–62 [DOI] [PubMed] [Google Scholar]
- 22. Lee Y. Z., Yang C. W., Chang H. Y., Hsu H. Y., Chen I. S., Chang H. S., Lee C. H., Lee J. C., Kumar C. R., Qiu Y. Q., Chao Y. S., and Lee S. J. (2014) Discovery of selective inhibitors of glutaminase-2, which inhibit mTORC1, activate autophagy and inhibit proliferation in cancer cells. Oncotarget 5, 6087–6101 10.18632/oncotarget.2173 [DOI] [PMC free article] [PubMed] [Google Scholar]
- 23. Yu D., Shi X., Meng G., Chen J., Yan C., Jiang Y., Wei J., and Ding Y. (2015) Kidney-type glutaminase (GLS1) is a biomarker for pathologic diagnosis and prognosis of hepatocellular carcinoma. Oncotarget 6, 7619–7631 10.18632/oncotarget.3196 [DOI] [PMC free article] [PubMed] [Google Scholar]
- 24. Kappler M., Pabst U., Rot S., Taubert H., Wichmann H., Schubert J., Bache M., Weinholdt C., Immel U. D., Grosse I., Vordermark D., and Eckert A. W. (2017) Normoxic accumulation of HIF1α is associated with glutaminolysis. Clin. Oral. Investig. 21, 211–224 10.1007/s00784-016-1780-9 [DOI] [PubMed] [Google Scholar]
- 25. Zhang H., Akman H. O., Smith E. L., Zhao J., Murphy-Ullrich J. E., and Batuman O. A. (2003) Cellular response to hypoxia involves signaling via Smad proteins. Blood 101, 2253–2260 10.1182/blood-2002-02-0629 [DOI] [PubMed] [Google Scholar]
- 26. Basu R. K., Hubchak S., Hayashida T., Runyan C. E., Schumacker P. T., and Schnaper H. W. (2011) Interdependence of HIF-1α and TGF-β/Smad3 signaling in normoxic and hypoxic renal epithelial cell collagen expression. Am. J. Physiol. Renal. Physiol. 300, F898–F905 10.1152/ajprenal.00335.2010 [DOI] [PMC free article] [PubMed] [Google Scholar]
- 27. Semenza G. L., Roth P. H., Fang H. M., and Wang G. L. (1994) Transcriptional regulation of genes encoding glycolytic enzymes by hypoxia-inducible factor 1. J. Biol. Chem. 269, 23757–23763 [PubMed] [Google Scholar]
- 28. Semenza G. L., Jiang B. H., Leung S. W., Passantino R., Concordet J. P., Maire P., and Giallongo A. (1996) Hypoxia response elements in the aldolase A, enolase 1, and lactate dehydrogenase A gene promoters contain essential binding sites for hypoxia-inducible factor 1. J. Biol. Chem. 271, 32529–32537 10.1074/jbc.271.51.32529 [DOI] [PubMed] [Google Scholar]
- 29. Hayashi M., Sakata M., Takeda T., Yamamoto T., Okamoto Y., Sawada K., Kimura A., Minekawa R., Tahara M., Tasaka K., and Murata Y. (2004) Induction of glucose transporter 1 expression through hypoxia-inducible factor 1α under hypoxic conditions in trophoblast-derived cells. J. Endocrinol. 183, 145–154 10.1677/joe.1.05599 [DOI] [PubMed] [Google Scholar]
- 30. Bernard K., Logsdon N. J., Ravi S., Xie N., Persons B. P., Rangarajan S., Zmijewski J. W., Mitra K., Liu G., Darley-Usmar V. M., and Thannickal V. J. (2015) Metabolic reprogramming is required for myofibroblast contractility and differentiation. J. Biol. Chem. 290, 25427–25438 10.1074/jbc.M115.646984 [DOI] [PMC free article] [PubMed] [Google Scholar]
- 31. Xie N., Tan Z., Banerjee S., Cui H., Ge J., Liu R. M., Bernard K., Thannickal V. J., and Liu G. (2015) Glycolytic reprogramming in myofibroblast differentiation and lung fibrosis. Am J Respir. Crit. Care. Med. 192, 1462–1474 10.1164/rccm.201504-0780OC [DOI] [PMC free article] [PubMed] [Google Scholar]
- 32. Shi Y., and Massagué J. (2003) Mechanisms of TGF-β signaling from cell membrane to the nucleus. Cell 113, 685–700 10.1016/S0092-8674(03)00432-X [DOI] [PubMed] [Google Scholar]
- 33. Hjelmeland M. D., Hjelmeland A. B., Sathornsumetee S., Reese E. D., Herbstreith M. H., Laping N. J., Friedman H. S., Bigner D. D., Wang X. F., and Rich J. N. (2004) SB-431542, a small molecule transforming growth factor-β-receptor antagonist, inhibits human glioma cell line proliferation and motility. Mol. Cancer Ther. 3, 737–745 [PubMed] [Google Scholar]
- 34. Shi J., Feng J., Xie J., Mei Z., Shi T., Wang S., Du Y., Yang G., Wu Y., Cheng X., Li S., Zhu L., Yang C. S., Tu S., and Jie Z. (2017) Targeted blockade of TGF-β and IL-6/JAK2/STAT3 pathways inhibits lung cancer growth promoted by bone marrow-derived myofibroblasts. Sci. Rep. 7, 8660 10.1038/s41598-017-09020-8 [DOI] [PMC free article] [PubMed] [Google Scholar]
- 35. Carter A. B., Knudtson K. L., Monick M. M., and Hunninghake G. W. (1999) The p38 mitogen-activated protein kinase is required for NF-κB-dependent gene expression. The role of TATA-binding protein (TBP). J. Biol. Chem. 274, 30858–30863 10.1074/jbc.274.43.30858 [DOI] [PubMed] [Google Scholar]
- 36. Stegen S., van Gastel N., Eelen G., Ghesquière B., D'Anna F., Thienpont B., Goveia J., Torrekens S., Van Looveren R., Luyten F. P., Maxwell P. H., Wielockx B., Lambrechts D., Fendt S. M., Carmeliet P., et al. (2016) HIF-1α promotes glutamine-mediated redox homeostasis and glycogen-dependent bioenergetics to support postimplantation bone cell survival. Cell Metab. 23, 265–279 10.1016/j.cmet.2016.01.002 [DOI] [PMC free article] [PubMed] [Google Scholar]
- 37. Wise D. R., DeBerardinis R. J., Mancuso A., Sayed N., Zhang X. Y., Pfeiffer H. K., Nissim I., Daikhin E., Yudkoff M., McMahon S. B., and Thompson C. B. (2008) Myc regulates a transcriptional program that stimulates mitochondrial glutaminolysis and leads to glutamine addiction. Proc. Natl. Acad. Sci. U.S.A. 105, 18782–18787 10.1073/pnas.0810199105 [DOI] [PMC free article] [PubMed] [Google Scholar]
- 38. Rodrigues M. F., Obre E., de Melo F. H., Santos G. C. Jr, Galina A., Jasiulionis M. G., Rossignol R., Rumjanek F. D., and Amoêdo N. D. (2016) Enhanced OXPHOS, glutaminolysis and β-oxidation constitute the metastatic phenotype of melanoma cells. Biochem. J. 473, 703–715 10.1042/BJ20150645 [DOI] [PubMed] [Google Scholar]
- 39. Sandbo N., Lau A., Kach J., Ngam C., Yau D., and Dulin N. O. (2011) Delayed stress fiber formation mediates pulmonary myofibroblast differentiation in response to TGF-β. Am. J. Physiol. Lung. Cell. Mol. Physiol. 301, L656–L666 10.1152/ajplung.00166.2011 [DOI] [PMC free article] [PubMed] [Google Scholar]
- 40. Zhou Y., Huang X., Hecker L., Kurundkar D., Kurundkar A., Liu H., Jin T. H., Desai L., Bernard K., and Thannickal V. J. (2013) Inhibition of mechanosensitive signaling in myofibroblasts ameliorates experimental pulmonary fibrosis. J. Clin. Invest. 123, 1096–1108 10.1172/JCI66700 [DOI] [PMC free article] [PubMed] [Google Scholar]
- 41. Fan J., Kamphorst J. J., Mathew R., Chung M. K., White E., Shlomi T., and Rabinowitz J. D. (2013) Glutamine-driven oxidative phosphorylation is a major ATP source in transformed mammalian cells in both normoxia and hypoxia. Mol. Syst. Biol. 9, 712 [DOI] [PMC free article] [PubMed] [Google Scholar]
- 42. Salceda S., and Caro J. (1997) Hypoxia-inducible factor 1α (HIF-1α) protein is rapidly degraded by the ubiquitin-proteasome system under normoxic conditions. Its stabilization by hypoxia depends on redox-induced changes. J. Biol. Chem. 272, 22642–22647 10.1074/jbc.272.36.22642 [DOI] [PubMed] [Google Scholar]
- 43. Huang L. E., Gu J., Schau M., and Bunn H. F. (1998) Regulation of hypoxia-inducible factor 1α is mediated by an O2-dependent degradation domain via the ubiquitin-proteasome pathway. Proc. Natl. Acad. Sci. U.S.A. 95, 7987–7992 10.1073/pnas.95.14.7987 [DOI] [PMC free article] [PubMed] [Google Scholar]
- 44. Pagé E. L., Chan D. A., Giaccia A. J., Levine M., and Richard D. E. (2008) Hypoxia-inducible factor-1α stabilization in nonhypoxic conditions: role of oxidation and intracellular ascorbate depletion. Mol. Biol. Cell 19, 86–94 10.1091/mbc.E07-06-0612 [DOI] [PMC free article] [PubMed] [Google Scholar]
- 45. Burr S. P., Costa A. S., Grice G. L., Timms R. T., Lobb I. T., Freisinger P., Dodd R. B., Dougan G., Lehner P. J., Frezza C., and Nathan J. A. (2016) Mitochondrial protein lipoylation and the 2-oxoglutarate dehydrogenase complex controls HIF1α stability in aerobic conditions. Cell Metab. 24, 740–752 10.1016/j.cmet.2016.09.015 [DOI] [PMC free article] [PubMed] [Google Scholar]
- 46. Selak M. A., Armour S. M., MacKenzie E. D., Boulahbel H., Watson D. G., Mansfield K. D., Pan Y., Simon M. C., Thompson C. B., and Gottlieb E. (2005) Succinate links TCA cycle dysfunction to oncogenesis by inhibiting HIF-α prolyl hydroxylase. Cancer Cell 7, 77–85 10.1016/j.ccr.2004.11.022 [DOI] [PubMed] [Google Scholar]
- 47. Brière J. J., Favier J., Bénit P., El Ghouzzi V., Lorenzato A., Rabier D., Di Renzo M. F., Gimenez-Roqueplo A. P., and Rustin P. (2005) Mitochondrial succinate is instrumental for HIF1α nuclear translocation in SDHA-mutant fibroblasts under normoxic conditions. Hum. Mol. Genet. 14, 3263–3269 10.1093/hmg/ddi359 [DOI] [PubMed] [Google Scholar]
- 48. Koivunen P., Hirsila M., Remes A. M., Hassinen I. E., Kivirikko K. I., and Myllyharju J. (2007) Inhibition of hypoxia-inducible factor (HIF) hydroxylases by citric acid cycle intermediates: possible links between cell metabolism and stabilization of HIF. J. Biol. Chem. 282, 4524–4532 10.1074/jbc.M610415200 [DOI] [PubMed] [Google Scholar]
- 49. Arts R. J., Novakovic B., Ter Horst R., Carvalho A., Bekkering S., Lachmandas E., Rodrigues F., Silvestre R., Cheng S. C., Wang S. Y., Habibi E., Gonçalves L. G., Mesquita I., Cunha C., et al. (2016) Glutaminolysis and fumarate accumulation integrate immunometabolic and epigenetic programs in trained immunity. Cell Metab. 24, 807–819 10.1016/j.cmet.2016.10.008 [DOI] [PMC free article] [PubMed] [Google Scholar]
- 50. Raingeaud J., Gupta S., Rogers J. S., Dickens M., Han J., Ulevitch R. J., and Davis R. J. (1995) Pro-inflammatory cytokines and environmental stress cause p38 mitogen-activated protein kinase activation by dual phosphorylation on tyrosine and threonine. J. Biol. Chem. 270, 7420–7426 10.1074/jbc.270.13.7420 [DOI] [PubMed] [Google Scholar]
- 51. Smith M. R., Vayalil P. K., Zhou F., Benavides G. A., Beggs R. R., Golzarian H., Nijampatnam B., Oliver P. G., Smith R. A., Murphy M. P., Velu S. E., and Landar A. (2016) Mitochondrial thiol modification by a targeted electrophile inhibits metabolism in breast adenocarcinoma cells by inhibiting enzyme activity and protein levels. Redox Biol. 8, 136–148 10.1016/j.redox.2016.01.002 [DOI] [PMC free article] [PubMed] [Google Scholar]
- 52. Dranka B. P., Benavides G. A., Diers A. R., Giordano S., Zelickson B. R., Reily C., Zou L., Chatham J. C., Hill B. G., Zhang J., Landar A., and Darley-Usmar V. M. (2011) Assessing bioenergetic function in response to oxidative stress by metabolic profiling. Free Radic. Biol. Med. 51, 1621–1635 10.1016/j.freeradbiomed.2011.08.005 [DOI] [PMC free article] [PubMed] [Google Scholar]
Associated Data
This section collects any data citations, data availability statements, or supplementary materials included in this article.