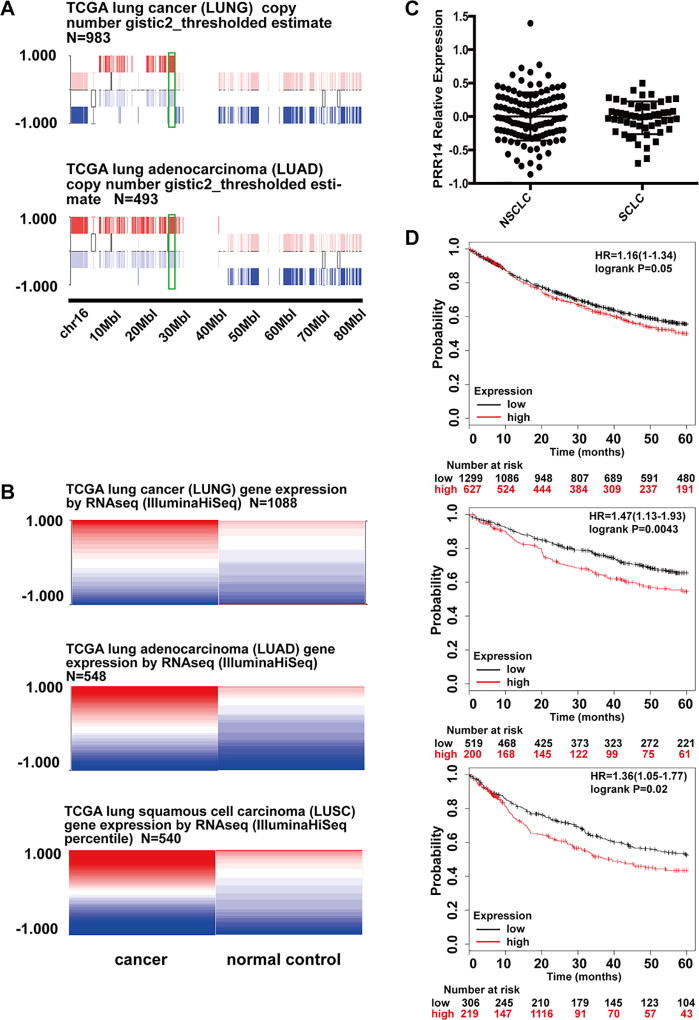
Fig 1. The amplification and overexpression of PRR14 in lung cancer.
(A) Gene copy number information was taken from UCSC Cancer Browser. (B) Gene expression level taken from UCSC Cancer Browser. The expression values are normalized by subtraction of the mean of PRR14 expression from each sample. The implemented in USCS Cancer Browser statistical analysis used student’s t test adjusting the false discovery rate using the Benjamini-Hochberg procedure identified p value as statistically different <0.05 with higher expression of PRR14 in cancer samples. (C) PRR14 expression comparison between cell lines of NSCLC AND SCLC. (D) Kaplan-Meier (KM) survival curves of lung cancer patients are stratified by their expression levels of PRR14. The analysis was done through online software Kaplan-Meier Plotter14.

