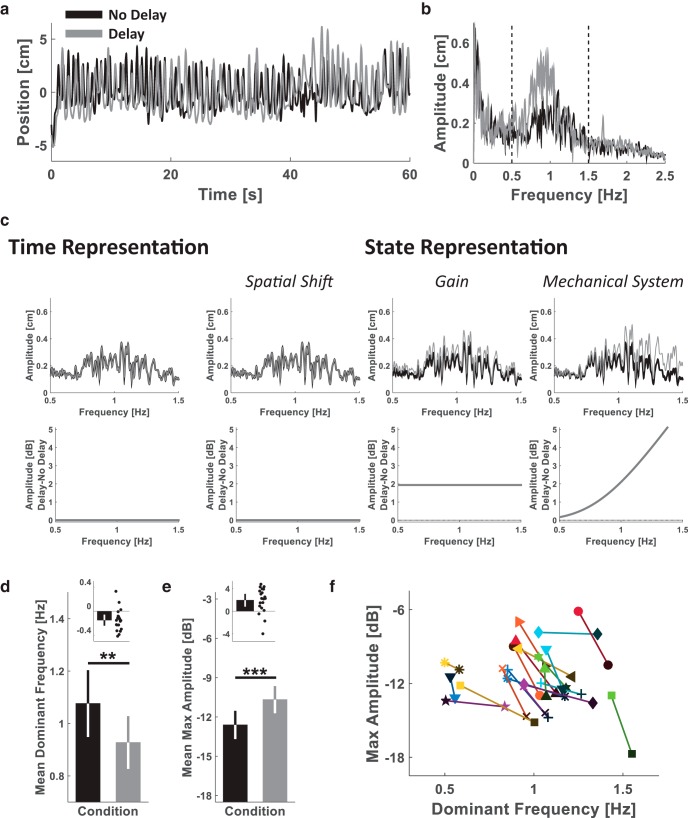
Fig 11.
Experiment 4: frequency response analysis of pong movements and representation model simulation results are most consistent with the Gain representation model. a, b, Single participant’s results. Sagittal hand trajectories of a representative participant during the last pong trial of each of the No Delay (black) and Delay (gray) sessions (a), and the mean frequency responses of the sagittal hand trajectories from the last four trials of each session (b). The vertical dashed lines define the frequency range of interest within which the participants were mainly moving ([0.5 1.5] Hz). c, Simulation results of the predicted effect of delay according to each of the representation models, illustrated using the baseline (no delay) frequency response of the participant in b. Upper panels display the No Delay (black) and the Delay (gray) amplitudes in cm, and lower panels present the difference between the amplitudes in dB. d, e, Group analysis. Mean dominant frequency (d) and mean maximum amplitude (e) of all participants (n = 20). The black bars (inset) represent the mean difference in each measure between the Delay and the No Delay pong sessions. Error bars represent the 95% confidence interval. Dots represent differences of individual participants. f, The maximum amplitude and its respective frequency (dominant frequency) for each participant is presented in a frequency–amplitude space to illustrate the overall changes dynamic of both measures from the No Delay (dark markers) to the Delay (light markers) pong session. **p < 0.01; ***p = 0.001.

