Short abstract
Hydrogen sulfide, a toxic gas, at low concentrations is also a biological mediator in animals. In the colon, hydrogen sulfide is produced by intestinal tissues and gut sulfur bacteria. Gut-derived molecules undergo liver metabolism. Portal hypertension is one of the most common complications contributing to the high mortality in liver cirrhosis. We hypothesized that the colon-derived hydrogen sulfide may affect portal blood pressure. Sprague-Dawley rats were maintained either on tap water (controls) or on water solution of thioacetamide to produce liver cirrhosis (CRH-R). Hemodynamics were measured after administration of either saline or Na2S, a hydrogen sulfide donor, into (1) the colon, (2) the portal vein, or (3) the femoral vein. Expression of enzymes involved in hydrogen sulfide metabolism was measured by RT-PCR. CRH-R showed a significantly higher portal blood pressure but a lower arterial blood pressure than controls. Saline did not affect hemodynamic parameters. In controls, intracolonic hydrogen sulfide decreased arterial blood pressure and portal blood flow but increased portal blood pressure. Similarly, hydrogen sulfide administered into the portal vein decreased arterial blood pressure but increased portal blood pressure. In contrast, hydrogen sulfide administered into the systemic vein decreased both arterial and portal blood pressures. CRH-R showed significantly greater responses to hydrogen sulfide than controls. CRH-R had a significantly higher liver concentration of hydrogen sulfide but lower expression of rhodanese, an enzyme converting hydrogen sulfide to sulfate. In conclusion, colon-administered hydrogen sulfide increases portal blood pressure while decreasing the systemic arterial blood pressure. The response to hydrogen sulfide is more pronounced in cirrhotic rats which show reduced hydrogen sulfide liver metabolism. Therefore, colon-derived hydrogen sulfide may be involved in the regulation of portal blood pressure, and may contribute to portal hypertension.
Impact statement
Accumulating evidence suggests that gut-derived molecules affect the control of the circulatory system. Mechanisms controlling liver circulation have been profoundly studied; however, the effects of gut bacteria-derived molecules on portal blood pressure have not been established. In the colon, hydrogen sulfide is produced by intestinal tissues and gut sulfur bacteria. We found that colon-administered hydrogen sulfide increases portal blood pressure while decreasing the systemic arterial blood pressure. The hemodynamic response to hydrogen sulfide was more pronounced in cirrhotic rats which showed reduced hydrogen sulfide liver metabolism, i.e. lower expression of rhodanese, an enzyme converting hydrogen sulfide to sulfate. We propose that colon-derived hydrogen sulfide may affect the regulation of portal and arterial blood pressures and may be involved in portal hypertension.
Keywords: Hydrogen sulfide, gut-derived mediators, arterial blood pressure, portal blood pressure, liver
Introduction
Hydrogen sulfide (H2S) has been known as a toxic gas in medical literature for three centuries. Namely, in 1713, in his book entitled De Morbis Artificum Diatriba, Bernardino Ramazzini described the toxic effects of the gas in victims of the occupational exposure.1 However, accumulating evidence suggests that H2S is also an important biological mediator in the circulatory system.2,3 Thus far, the research has been focused mainly on the cardiovascular effects of H2S produced enzymatically by vasculature, the kidneys, and the heart. Interestingly, recent evidence indicates that the circulatory system may also be influenced by colon-derived H2S.4,5 In fact, colon may be the largest pool of H2S in mammals. This is because H2S and its derivatives are produced by both intestinal tissue and gut sulfur bacteria.6,7
Blood collected from intestines transports numerous nutrients and gut bacteria products via the portal vein to the liver. Although the mechanisms controlling liver circulation have been profoundly studied, the effects of gut bacteria-derived molecules on portal blood pressure have not been established. We hypothesized that the colon-derived H2S may affect arterial blood pressure (ABP) and portal blood pressure. Since portal hypertension is one of the most common complications contributing to the high mortality rate in liver cirrhotic patients, we investigated the effects of the colon-derived H2S in healthy and in cirrhotic animals.
Materials and methods
Ethical approval, animals, and model of liver cirrhosis
The experiments were performed according to Directive 2010/63 EU on the protection of animals used for scientific purposes and approved by the I Local Bioethical Committee in Warsaw (permission: 103/2016). Rats were housed in groups (3-4 animals) in polypropylene cages with environmental enrichment, 12-h light/12-h dark cycle, temperature 22–23°C, humidity 45–55%, food and water ad libitum.
Measurements were performed on 28-week-old, male, Sprague Dawley rats (n = 69, healthy rats) and Sprague Dawley rats with liver cirrhosis (n = 54, cirrhotic rats) fed a standard laboratory diet ad libitum. Liver cirrhosis was induced by administering thioacetamide in a drinking water 0.3 g/L for 18 weeks, as previously described.8,9 Cirrhosis was confirmed by histopathological examination with hematoxylin and eosin staining, using a standard light microscope Olympus BX41 and CellSens software (Olympus Corporation, Tokyo, Japan).
Surgical preparation
Rats were anaesthetized with urethane 1.5 g/kg of bw i.p. First, an arterial catheter was implanted into the aorta via the femoral artery for ABP measurements (all the experimental series). Next, a venous catheter was implanted into the femoral vein for peripheral infusions (series evaluating hemodynamic effects of H2S administration into peripheral vein). Next, the portal vein was catheterized for portal blood pressure (PBP) measurements (all the experimental series). Specifically, skin and muscles were cut from the xiphoid to the navel. The portal vein and the superior mesenteric vein were dissected from adjacent tissue and stabilized with ligatures. A polyurethane T-shape catheter (ID 0.6 mm, OD 1 mm) with the tip made of a 27 G, 0.5 cm long, blunt needle was inserted into the portal vein via the superior mesenteric vein. The extravascular part of the catheter was secured to the mesentery with a single surgical knot and an adhesive glue. Subsequently, the abdominal cavity was closed. The hemodynamic measurements were performed with the Biopac MP 150 recording system (Biopac Systems, Goleta, USA).
Hemodynamic measurements
The measurements started 60 min after the induction of anesthesia.
Hemodynamic effects of H2S administration into the colon
Intracolonic infusions were performed by means of a flexible catheter inserted into the colon, 8 cm from the anus.
A pilot dose-response study
In healthy rats, ABP and PBP were recorded for 15 min at baseline and 20 min after intracolonic infusions of Na2S at the following doses: 0.08 mmol Na2S/kg/b.w. (n = 7), 0.8 mmol Na2S/kg/b.w. (n = 7), 2.4 mmol Na2S/kg/b.w. (n = 7).
The effect of intracolonic infusions on portal blood flow and ABP
The experiments were performed in healthy rats (n = 7). Measurements of portal vein blood flow (PBF) were conducted using the transit time ultrasound set-up (T106, Transonic System Inc., Ithaca, NY, USA). PBF and ABP were measured at baseline, for 30 min after intracolonic administration of 0.5 mL of saline, and 30 min after intracolonic administration of Na2S at a dose of 2.4 mmol/kg/b.w.
Hemodynamic effects of H2S administration into the colon in healthy and cirrhotic rats
In healthy rats, ABP and PBP were recorded for 15 min at baseline and 70 min after the intracolonic infusions of either a vehicle (0.5 mL of 0.9% saline) or 0.8 mmol Na2S/kg/b.w. (n = 6) or 2.4 mmol Na2S/kg/b.w. (n = 7). The same experimental series were performed in cirrhotic rats, i.e. vehicle infusion (n = 6), 0.8 mmol Na2S/kg/b.w. (n = 6), and 2.4 mmol of Na2S/kg/b.w. (n = 6).
Hemodynamic effects of H2S administration into the portal vein
ABP and PBP were recorded for 15 min at baseline and 45 min after the treatment. Infusions were performed by the T-shape catheter inserted into the portal vein. Healthy rats were treated with either a vehicle (0.2 mL of 0.9% saline) or 0.04 mmol Na2S/kg/b.w. (n = 6) or 0.4 mmol Na2S/kg/b.w. (n = 6). The same experimental series were performed in cirrhotic rats, i.e. vehicle infusion (n = 6), or 0.04 mmol Na2S/kg/b.w. (n = 6) or 0.4 mmol Na2S/kg/b.w. (n = 6).
Hemodynamic effects of H2S administration into the peripheral vein
Infusions were performed by means of the catheter inserted into the femoral vein. ABP and PBP were recorded for 15 min at baseline and 30 min after the treatment. Healthy rats were treated with either a vehicle (0.2 mL of 0.9% saline) or 0.04 mmol Na2S/kg/b.w. (n = 6) or 0.4 mmol Na2S/kg/b.w. (n = 6). The same experimental series were performed in cirrhotic rats, i.e. vehicle infusion (n = 6), or 0.04 mmol of Na2S/kg/b.w. (n = 6) or 0.4 mmol of Na2S/kg/b.w. (n = 6).
Determination of the H2S level in liver homogenates
The frozen liver samples were homogenized at a ratio of 1/10 with ice-cold 50 mM phosphate buffer pH 8.0 for 1 min at 8000–9500 r/min using a blender homogenizer. H2S level was determined in homogenates after 1 h of incubation with L-cysteine, using the method described in Kartha et al.10 with modifications described by Bronowicka-Adamska et al.11 Methylene blue was spectrophotometrically detected at 670 nm. The standard curve was linear at the concentration range of 0–250 µM with a correlation coefficient of 0.994.
RT-PCR
Isolation of total RNA
Total RNA was extracted from the liver using TRIzol reagent (Invitrogen, CA, USA) following the manufacturer's instructions. RNA concentration was estimated by measuring the absorbance at 260 nm. Isolated RNA was characterized for quantity and integrity and was stored at −80°C for RT-PCR analysis.
Reverse transcription of RNA
Reaction volume was 20 µL and components were used including 3 μg of total RNA, Oligo d(T) primer 0.5 μg/μl (1 µl; Thermo Scientific), GoScript™ 5× Reaction buffer (4 µl, Promega Corporation), MgCl2 (3 µl), GoScript™ Reverse Transcriptase 160 U/μl (1 µl, Promega Corporation), RNase Inhibitor 20 U/μl (1 µl, Thermo Scientific) and dNTP mix 10 mM (1 μL, Thermo Scientific). RNA was mixed with Oligo d(T) primer and was heated for 5 min at 70°C. Then, samples were incubated in the reaction mixture for 5 min at 25°C, 60 min at 42°C, and 15 min at 70°C.
Polymerase chain reaction
PCR was performed using 2 μl of cDNA, 0.2 μM of each primer, 0.04 U/μl of DNA polymerase (Thermo Scientific) in 10 mM buffer Tris–HCl pH 8.8 (supplemented with 1.5 mM MgCl2, 50 mM KCl, 0.1% Triton X-100), 0.2 mM of dNTP mix (Thermo Scientific), and H2O-DEPC in total reaction volume of 25 µl. Primer sequences were: 5′CTCTATCGAGCCGCTG GTCTC3′ (sense) and 5′TCGTAAGGCGAAGTCGTGTC3′ (antisense) for TST, 200bp; 5′TTTGTATACAGCCGC TCTGGA3′ (sense) and 5′ACAAGCTTGGTCTGTGGTG T3′ (antisense) for CTH, 290bp; 5′CTGTGAAGGGCTA TCGCTGC3′(sense) and 5′CTGGCATTGCGGTACTGG TC3′ (antisense) for CBS, 205bp; 5′TCCTGGGTGGAGTG GTACAT3′ (sense) and 5′GTGAAACAAGCTAGGT GGGC3′ (antisense) for MPST, 339bp; 5′ACCCGCGAGT ACAACCTTCTT3′ (sense) and 5′GCCGTGTTCAATGG GGTACT3′ (antisense) for β-actin, 285bp.
PCR products were analyzed by electrophoresis on 2.0% agarose gel stained with ethidium bromide, visualized under ultraviolet light, and analyzed by densitometric analysis using the system of documentation and computer analysis UVI-KS 4000i/ImagePC (Syngen Biotech).
Compounds
Urethane, Na2S, L-cysteine, pyridoxal phosphate (PLP), sodium dihydrogen phosphate dihydrate pure, sodium sulfite, agarose, and N,N-dimethyl-p-phenylenediamine sulfate salt were obtained from Sigma-Aldrich (St. Louis, MO, USA). Ferric chloride, zinc acetate dehydrate pure, trichloroacetic acid (TCA), and sodium hydroxide were from Polskie Odczynniki Chemiczne S.A. (Gliwice, Poland).
Statistics
Mean ABP and PBP were calculated on the blood pressure tracing by AcqKnowledge 4.3.1 (Biopac Systems, Goleta, USA). For the evaluation of ABP, PBP, and PBF response to the treatment, the average over 1 min baseline was compared with the averages over 1 min after the treatment by means of one-way analysis of variance (ANOVA) for repeated measures. Differences between the groups were evaluated by multivariate ANOVA, followed by Tukey’s post hoc test or t-test, when appropriate. The Kolmogorov–Smirnov test was used to test normality of the distribution. A value of two-sided P < 0.05 was considered significant. Means ± SE are presented. Analyses were conducted using STATISTICA 12.0 (Stat Soft, Krakow, Poland).
Results
Hemodynamic and histological characterization of healthy and cirrhotic rats
At baseline, PBP was significantly higher in cirrhotic rats (11.1 ± 0.2, n = 30) than in healthy rats (6.0 ± 0.3, n = 30), P < 0.05. In contrast, mean ABP was significantly lower in cirrhotic rats (84.9 ± 1.9, n = 30) than in healthy rats (101.3 ± 2.0, n = 30), P < 0.05.
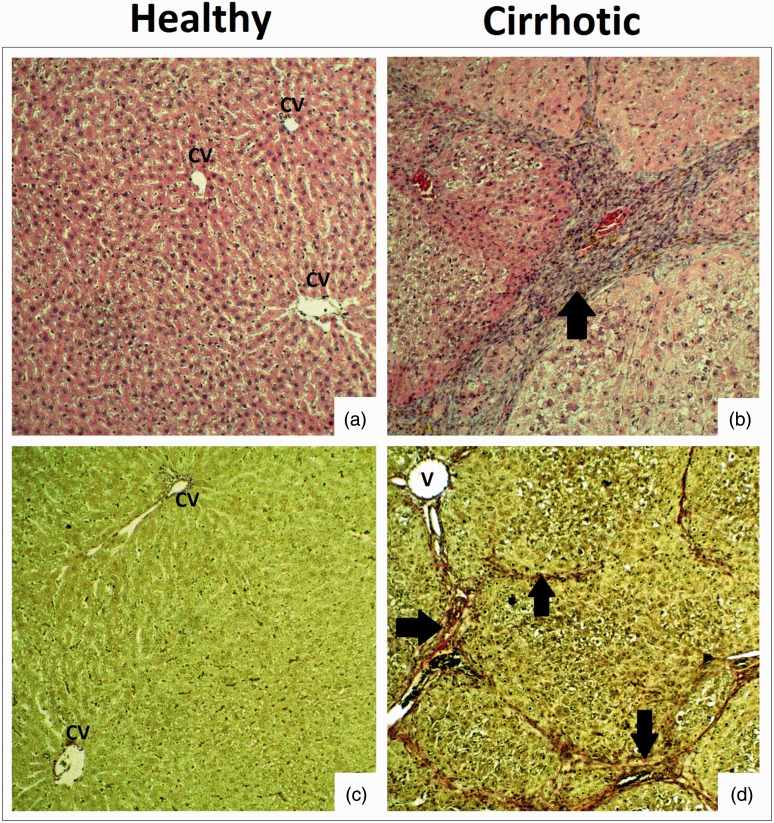
Histopathological examination showed no pathological changes in livers of rats that drank tap water (healthy rats). In rats treated with thioacetamide the following pathological findings were present: large hepatic nodules separated by bands of connective tissue, hyperplasia of connective tissue (around portal fields and on the periphery of nodules), and extension of central veins and portal venules. In the parenchyma, hepatocytes with degenerative changes dominated. The changes can be classified as an incomplete septal cirrhosis or early cirrhosis, with the features of macronodular cirrhosis (Figure 1).
Figure 1.
Histopathology of the liver in healthy and cirrhotic rats. (a, b) Liver parenchyma with hematoxylin and eosin (×10 objective lens). (c, d) Fibrosis of liver parenchyma with van Gieson stain (×10 objective lens). CV: central veins of liver; V: extended lumen of portal venules. Arrows – Hyperplasia of connective tissue in the liver parenchyma. (A color version of this figure is available in the online journal.)
There was no significant difference between healthy and cirrhotic rats in liver test, underlining the chronic cirrhotic process without decompensated liver failure. Healthy rats (n = 12): AST(U/L) 97.5 ± 11.3, ALT(U/L) 60.7 ± 3.6, total protein (g/dL) 5.27 ± 0.07, albumins (g/dL) 3.65 ± 0.04; and Cirrhotic rats (n = 12): AST(U/L) 110.8 ± 12.7, ALT(U/L) 64.8 ± 3.4, total protein (g/dL) 5.31± 0.08, albumins (g/dL) 3.76 ± 0.07.
Hemodynamic effects of H2S administration into the colon
A pilot dose-response study
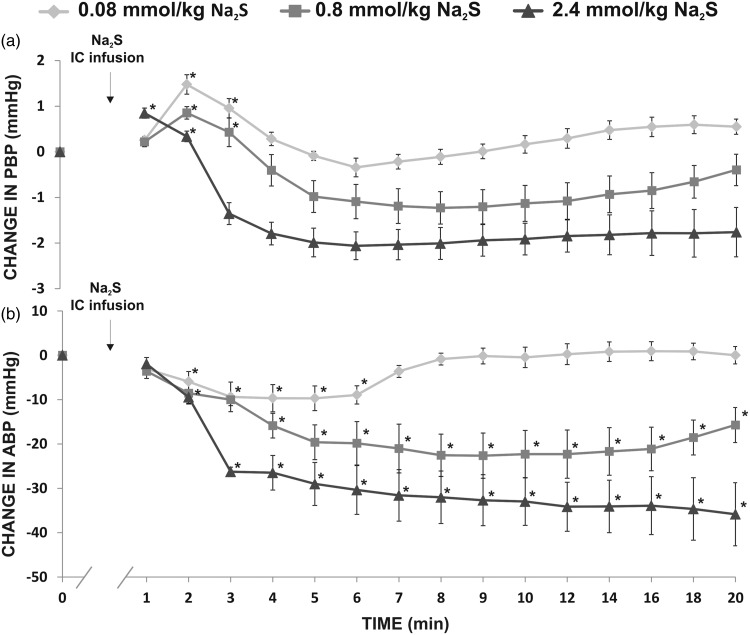
In healthy rats, intracolonic administration of Na2S produced a significant increase in PBP in all the series, i.e. 0.08 mmol/kg/b.w. (F2,12 = 18.84, P < 0.05), 0.8 mmol/kg/b.w. (F2,12 = 4.69, P < 0.05), and 2.4 mmol/kg/b.w. (F2,12 = 6.61, P < 0.05), which was followed by a decrease in PBP (Figure 2(a)). The changes in PBP were accompanied by a significant decrease in ABP, i.e. 0.08 mmol/kg/b.w. (F6,36 = 4.17, P < 0.05), 0.8 mmol/kg/b.w. (F6,36 = 10.66, P < 0.05), and 2.4 mmol/kg/b.w. (F6,36 = 48.40, P < 0.05) (Figure 2(b)).
Figure 2.
Changes in (a) portal blood pressure (PBP, mmHg), and (b) mean arterial blood pressure (ABP, mmHg) after intracolonic (IC) infusion of Na2S, a fast-releasing H2S donor in healthy rats (n = 7).*P<0.05 – vs. baseline.
Changes in PBF and ABP
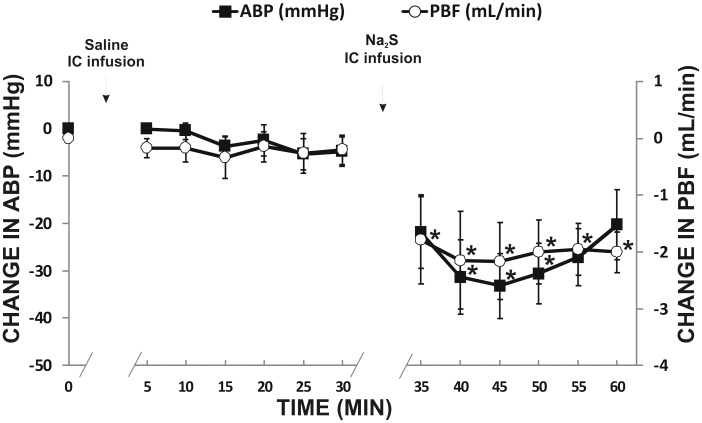
Intracolonic administration of the vehicle did not affect PBF and ABP. In contrast, Na2S at a dose of 2.4 mmol/kg/b.w. produced a significant decrease in PBF (F5,30 = 5.23, P < 0.05) and ABP (F5,30 = 12.92, P < 0.05) (Figure 3).
Figure 3.
Changes in portal vein blood flow (PBF, mL/min) and mean arterial blood pressure (ABP, mmHg) after the intracolonic (IC) infusion of the vehicle and Na2S, a fast-releasing H2S donor, in rats (n = 7).*P<0.05 – vs. baseline.
Hemodynamic effects of H2S administration into the colon in healthy and cirrhotic rats
Changes in PBP
Administration of the vehicle did not produce a significant change in PBP.
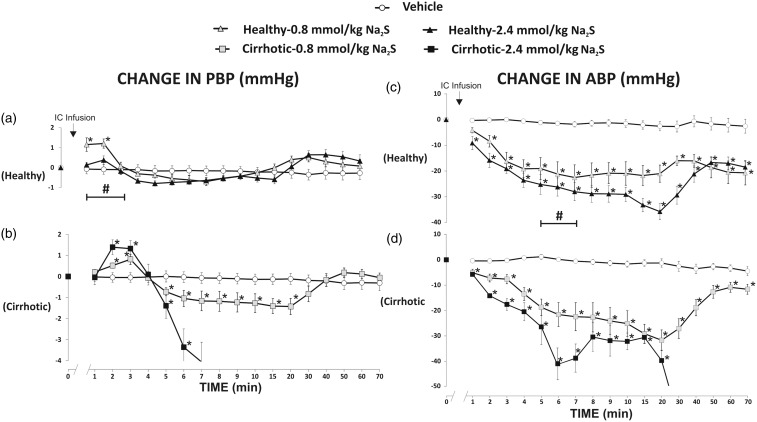
In healthy rats, Na2S at a dose of 0.8 mmol/kg/b.w. (F3,15 = 10.37, P < 0.05) and 2.4 mmol/kg/b.w. (F3,18 = 3.91, P < 0.05) produced a significant increase in PBP (Figure 4(a)). There were significant differences between the vehicle and 0.8 mmol/kg/b.w. and 2.4 mmol/kg/b.w. series (F2,16 = 11.43, P < 0.05).
Figure 4.
Changes in portal blood pressure (PBP, mmHg) and mean arterial blood pressure (ABP, mmHg) after the intracolonic (IC) infusion of either saline (vehicle) or Na2S, a fast-releasing H2S donor.Healthy rats: Na2S 0.8 mmol/kg/b.w. (n=6); Na2S 2.4 mmol/kg/b.w. (n=7), cirrhotic rats: Na2S 0.8 mmol/kg/b.w. (n=6); Na2S 2.4 mmol/kg/b.w. (n=6).*P<0.05 – vs. baseline. #P<0.05 – Healthy – 2.4 mmol/kg/b.w. of Na2S series vs. Cirrhotic – 2.4 mmol/kg/b.w. of Na2S series.
Cirrhotic rats showed a significant increase in PBP after administration of Na2S at a dose of 0.8 mmol/kg/b.w. (F4,20 = 8.61, P < 0.05), and 2.4 mmol/kg/b.w. (F4,20 = 26.72, P < 0.05) (Figure 4(b)). In the latter series, all rats died due to significant hypotension. There were significant differences between the vehicle and 0.8 mmol/kg/b.w. and 2.4 mmol/kg/b.w. series (F2,15 = 6.61, P < 0.05).
Cirrhotic group treated with Na2S at a dose of 2.4 mmol/kg/b.w. showed a significantly higher increase in PBP than the healthy group treated with Na2S at the same dose (F1,11= 7.27, P < 0.05) (Figure 4(a) and (b)).
Changes in ABP
Administration of the vehicle did not affect ABP.
In healthy rats, Na2S at a dose of 0.8 mmol/kg/b.w. (F9,45 = 10.48, P < 0.05) and 2.4 mmol/kg/b.w. (F9,54 = 24.90, P < 0.05) produced a significant decrease in ABP (Figure 4(c)). There were significant differences between the vehicle and 0.8 mmol/kg/b.w. and 2.4 mmol/kg/b.w. series (F2,16 =15.68, P < 0.05).
Cirrhotic rats exhibited a significant decrease in ABP after administration of Na2S at a dose of 0.8 mmol/kg/b.w. (F9,45 = 10.48, P < 0.05) and 2.4 mmol/kg/b.w. (F9,45 = 27.51, P < 0.05) (Figure 4(d)). In the latter series, all rats died due to significant hypotension. There were significant differences between the vehicle and 0.8 mmol/kg/b.w. and 2.4 mmol/kg/b.w. series (F2,16 = 19.34, P < 0.05).
Cirrhotic rats treated with Na2S at a dose of 2.4 mmol/kg/b.w. showed a significantly greater decrease in ABP than healthy rats (F1,11 = 6.87, P < 0.05) (Figure 4(c) and (d)).
Hemodynamic effects of H2S administration into the portal vein
Changes in PBP
Administration of the vehicle did not produce a significant change in PBP.
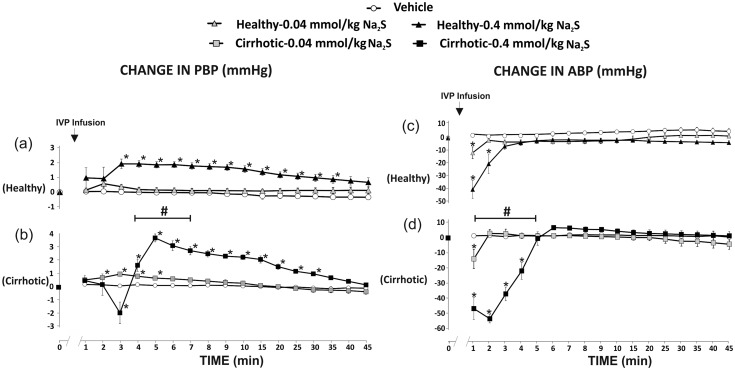
In healthy rats, Na2S at a dose of 0.04 mmol/kg/b.w. produced a not significant increase in PBP, whereas Na2S at a dose of 0.4 mmol/kg/b.w. produced a significant increase in PBP (F7,35 = 29.99, P < 0.05) (Figure 5(a)). There were significant differences between the vehicle and 0.4 mmol/kg/b.w. series (F1,10 =16.77, P < 0.05).
Figure 5.
Changes in portal blood pressure (PBP, mmHg) and mean arterial blood pressure (ABP, mmHg) after the administration of either saline (vehicle) or Na2S, a fast-releasing H2S donor, into the portal vein (IVP).Healthy rats: Na2S 0.8 mmol/kg/b.w. (n=6); Na2S 2.4 mmol/kg/b.w. (n=6), cirrhotic rats: Na2S 0.8 mmol/kg/b.w. (n=6); Na2S 2.4 mmol/kg/b.w. (n=6).*P<0.05 – vs. baseline. #P<0.05 – Healthy – 0.4 mmol/kg/b.w. of Na2S series vs. Cirrhotic – 0.4 mmol/kg/b.w. of Na2S series.
In cirrhotic rats, Na2S at a dose of 0.04 mmol/kg/b.w. caused a significant increase in PBP (F7,35 = 13.27, P < 0.05). Administration of Na2S at a dose of 0.4 mmol/kg/b.w. resulted in a biphasic response, i.e. a transient decrease in PBP followed by a significant increase in PBP (F7,35 = 63.94, P < 0.05) (Figure 5(b)). There were significant differences between the vehicle and 0.4 mmol/kg/b.w. series (F1,10 = 59.70, P < 0.05).
Cirrhotic rats showed significantly greater increase in PBP than healthy rats after administration of Na2S at a dose of 0.4 mmol/kg/b.w. (F1,10 = 6.33, P < 0.05) (Figure 5(a) and (b)).
Changes in mean ABP
Administration of the vehicle did not affect ABP.
In healthy rats, Na2S at a dose of 0.04 mmol/kg/b.w. (F5,25 = 4.18, P < 0.05) and 0.4 mmol/kg/b.w. (F3,15 = 26.04, P < 0.05) produced a significant decrease in ABP (Figure 5(c)). There were significant differences between the vehicle and 0.4 mmol/kg/b.w. series (F1,10 = 22.46, P < 0.05).
In cirrhotic rats, there was a significant decrease in ABP after administration of Na2S at a dose of 0.04 mmol/kg/b.w. (F5,25 = 7.15, P < 0.05) and 0.4 mmol/kg/b.w. (F5,25 = 29.16, P < 0.05) (Figure 5(d)). There were significant differences between the vehicle and 0.4 mmol/kg/b.w. series (F1,10 = 66.92, P < 0.05).
Cirrhotic rats showed significantly greater decrease in ABP than healthy rats in 0.4 mmol/kg/b.w. series (F1,10 = 5.15 P < 0.05) (Figure 5(c) and (d)).
Hemodynamic effects of H2S administration into the peripheral vein
Changes in PBP
Administration of the vehicle did not affect PBP.
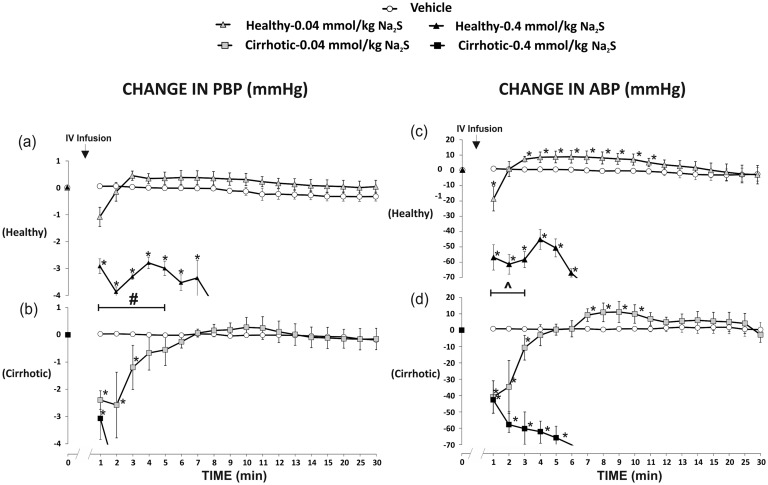
In healthy rats, Na2S at a dose of 0.04 mmol/kg/b.w. (F2,10 = 3.83, P < 0.05) and 0.4 mmol/kg/b.w. (F5,25 = 27.73, P < 0.05) produced a significant decrease in PBP (Figure 6(a)). In the latter series, all rats died due to a significant hypotension after 15 min. There were significant differences between the vehicle and 0.4 mmol/kg/b.w. series (F1,10 = 38.65, P < 0.05).
Figure 6.
Changes in portal blood pressure (PBP, mmHg) and mean arterial blood pressure (ABP, mmHg) after the administration of either saline (vehicle) or Na2S, a fast-releasing H2S donor, into the femoral vein (IV).Healthy rats: Na2S 0.8 mmol/kg/b.w. (n=6); Na2S 2.4 mmol/kg/b.w. (n=6), cirrhotic rats Na2S 0.8 mmol/kg/b.w. (n=6); Na2S 2.4 mmol/kg/b.w. (n=6).*P<0.05 – vs. baseline. #P< 0.05 – Healthy – 0.4 mmol/kg/b.w. of Na2S series vs. Cirrhotic – 0.4 mmol/kg/b.w. of Na2S series. ^P<0.05 – Healthy – 0.04 mmol/kg/b.w. of Na2S series vs. Cirrhotic – 0.04 mmol/kg/b.w. of Na2S series.
In cirrhotic rats, there was a significant decrease in PBP after administration of Na2S at a dose of 0.04 mmol/kg/b.w. (F2,10 = 4.77, P < 0.05) and 0.4 mmol/kg/b.w. (F5,25 = 28.46, P < 0.05) and in the latter series all rats died due to a significant hypotension after 10 min (Figure 6(b)). There were significant differences between the vehicle and 0.4 mmol/kg/b.w. series (F1,10 = 42.03, P < 0.05).
Namely, cirrhotic rats showed a significantly greater decrease in PBP than healthy rats (F1,10 = 7.18, P < 0.05) in 0.4 mmol/kg/b.w. series (Figure 6(a) and (b)).
Changes in ABP
Administration of the vehicle did not affect ABP.
In healthy rats, Na2S at a dose of 0.04 mmol/kg/b.w. (F3,15 = 3.92, P < 0.05) and 0.4 mmol/kg/b.w. (F5,25 = 19.61, P < 0.05) produced a significant decrease in ABP (Figure 6(c)). There were significant differences between the vehicle and 0.4 mmol/kg/b.w. series (F1,10 = 27.66, P < 0.05).
Cirrhotic rats showed a significant decrease in ABP after administration of Na2S at a dose of 0.04 mmol/kg/b.w. (F3,15 = 4.79, P < 0.05) and 0.4 mmol/kg/b.w. (F5,25 = 19.55, P < 0.05) (Figure 6(d)). There were significant differences between the vehicle and 0.4 mmol/kg/b.w. series (F1,10 = 30.06, P < 0.05).
The between-group analysis revealed a significant difference between healthy and cirrhotic groups after administration of Na2S at a dose of 0.4 mmol/kg/b.w. Namely, cirrhotic rats that received Na2S at a dose of 0.04 mmol/kg/b.w. showed a significantly greater decrease in ABP than healthy rats (F1,10 = 5.19, P < 0.05) (Figure 6(c) and (d)).
H2S generation
Livers of cirrhotic rats showed a significantly higher concentration of H2S after 1 h of incubation with L-cysteine (17.8 ± 1.6 nmol H2S/g of tissue, n = 14) than livers of healthy rats (10.4 ± 0.9 nmol H2S/g of tissue, n = 15).
Expression of sulfurtransferases
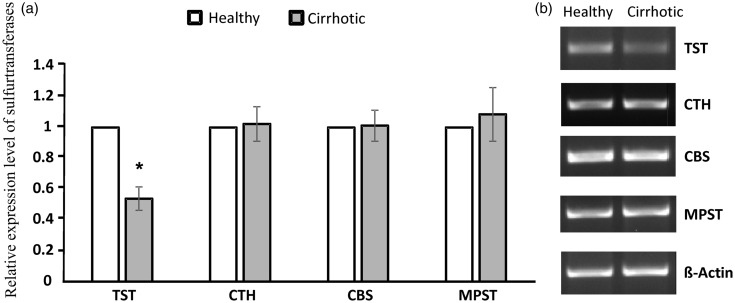
In cirrhotic rats, the expression of TST in liver was decreased twofold as compared to the healthy group. We did not observe any statistically significant differences in the expression of mRNA of CTH, CBS, and MPST genes between healthy and cirrhotic rats (Figure 7).
Figure 7.
Relative expression level of sulfurtransferases in rat liver in healthy group and cirrhotic group. TST: rhodanese; CTH: γ-cystathionase; CBS: cystathionine-β-synthase; MPST: 3-mercaptopyruvate sulfurtransferase.(a) Densities of bands were normalized using β-actin. Each point represents the mean ± SE of three independent experiments; healthy rats (n=7); cirrhotic rats (n=7),*P < 0.05 – healthy vs. cirrhotic rats. (b) Representative results of RT-PCR analysis for sulfurtransferases.
Discussion
A new finding of our study is that colon-administered H2S increases PBP while decreasing systemic ABP in rats. Furthermore, we found that cirrhotic rats show an augmented hemodynamic response to H2S, which is associated with a significantly lower expression of rhodanese, an enzyme converting H2S to sulfate.
H2S has been found to play an important role in the control of ABP12; however, the mechanisms are not clear. This is in part because H2S may exert its biological effects via its derivatives such as S-nitrosothiols, thiosulfates as well as interacting with nitric oxide and carbon monoxide.13,14 Interestingly, similarly to epinephrine, H2S may act as a vasoconstrictor or as a vasorelaxant, depending on a type of vascular bed and the dose.15 In rodents, H2S donors have been found to produce a significant hypotensive effect, associated with peripheral vasodilatation.12 Likewise, in the present study Na2S, the most commonly used H2S donor administered intravenously lowered ABP.
Hemodynamic studies on H2S have thus far focused on the effects of H2S produced enzymatically by blood vessels, the heart, kidneys, or the brain. However, recent studies suggest that the gut-derived H2S may also contribute to the regulation of systemic ABP.5 As a matter of fact, large intestine may represent the largest pool of H2S in the body, since H2S is produced by both intestinal tissue and gut bacteria.6,7 Accordingly, the estimated concentration of H2S in the blood and other tissues has been reported to be within the micromolar16 or nanomolar range,17 in contrast to millimolar concentrations in the intestines.18,19
Previously, Ebrahimkhani et al.,20 hypothesized that H2S may be responsible for changes in the portal circulation. However, to the best of our knowledge, the effect of colon-derived H2S on PBP has not been studied.
Recently, we have found that colonic administration of H2S decreases systemic ABP, which is associated with an increased portal blood levels of thiosulfate and sulfane sulfur, products of H2S oxidation.5 Before entering the systemic circulation, blood collected from the colon passes the liver. Therefore, in the present study, we evaluated if colon-derived H2S may affect the liver circulation. In particular, we assessed the effect of H2S on concomitant changes in PBP and systemic ABP, a major factor influencing PBP by changing intestinal blood flow.
Portal blood pressure depends on blood volume flowing from portal vein and hepatic artery, and on the resistance offered by the terminal portal venules, the sinusoids, and the roots of hepatic venules (liver resistance). The liver does not control PBF, which is simply the outflow from intestines, spleen, and pancreas. However, changes in PBF produce compensatory response from hepatic artery, a mechanism known as hepatic arterial buffer response. Interestingly, it has been suggested that this mechanism may also involve H2S signaling.21
In the present study, we have found that intracolonic administration of H2S increases PBP, which is accompanied by a drop in systemic ABP. Furthermore, we have found that rats infused with H2S into the colon showed a similar pattern of hemodynamic response to rats infused with H2S directly into the portal vein. Besides, the intracolonic administration of H2S decreased PBF. These suggest that an increase in PBP after intracolonic administration of H2S was caused by an increase in the liver resistance. This concept may also be supported by studies by Norris and collaborators, who found the constriction of liver sinusoids after administration of H2S into the splenic vein.22
Interestingly, in our study, the highest PBP was present in rats treated with smaller doses of H2S which produced a smaller systemic hypotension. Furthermore, PBP was increasing as systemic ABP was returning to baseline values after the H2S treatment. These data strongly suggest that the H2S-driven increase in PBP was reduced by the concomitant H2S-induced systemic hypotension (Figure 8).
Figure 8.
A proposed interplay between the effects of H2S on systemic arterial blood pressure (arterial pressure) and portal blood pressure (portal pressure). On the one hand, H2S increases portal pressure increasing liver resistance. On the other hand, H2S decreases portal blood pressure indirectly, by lowering systemic arterial pressure and intestinal blood flow.
In contrast to rats infused with H2S into the colon or into the portal vein, rats infused with H2S into the femoral vein showed a significant decrease in both, ABP, and PBP. These findings show that the H2S-dependent increase in PBP requires a direct delivery of H2S from the colon. Otherwise, the systemic hypotension produced by H2S outweighs the pressor effect of H2S on portal circulation. This is likely due to the hypotension-driven decrease in the liver blood flow and/or too small amount of H2S reaching portal circulation after systemic administration of the H2S donor.
Interestingly, there are some studies suggesting that H2S may decrease PBP. Distrutti et al.23 and Fiorucci et al.24 found that NaHS, another fast-releasing H2S donor, reversed hepatic vasoconstriction induced by norepinephrine and homocysteine. However, those experiments were performed in a perfused liver model which may not fully reflect physiological conditions, and the effect of NaHS could depend on the increased concentration of noradrenaline and cysteine. Tan et al.25 found that intraperitoneal treatment with NaHS, twice a day reduced portal pressure in CCL4-induced liver cirrhosis. However, the authors did not evaluate the effect of H2S on PBP in healthy animals, and did not record ABP. Therefore, a decrease in PBP could be secondary to systemic hypotension. Furthermore, it is of note, that although the authors used NaHS, a fast-releasing H2S donor, they observed long-term effects (days). This may suggest that their findings were dependent on other than H2S-dependent effects. In this respect, NaHS similar to Na2S dissociates rapidly in plasma leading to instant formation of H2S and a short-lasting increase in plasma level of H2S and its derivatives.26 This is reflected in short-term changes in hemodynamic parameters after a single parenteral administration of H2S donors.27
Portal hypertension is a major complication of liver cirrhosis. Cirrhotic patients often present systemic hypotension caused by peripheral vasodilatation, which is mediated by nitric oxide and other vasorelaxant factors28,29; however, the mechanisms have not been fully elucidated. Interestingly, in our study, the intracolonic treatment of healthy animals with H2S produced similar hemodynamic characteristics, i.e. an increased PBP and a decreased systemic ABP. Moreover, the hemodynamic response to H2S was greater in cirrhotic than in healthy rats.
The greater hemodynamic response to H2S in cirrhotic rats seems to be caused by a reduced metabolism of H2S in cirrhotic livers. H2S is synthetized in the liver by 3-mercapropyruvate sulfurtransferase (MPST), cystathionine β-synthase (CBS), and gamma-cystathionase (CTH).30 Here, we found that cirrhotic livers showed higher concentration of H2S after liver homogenate incubation with L-cysteine, a substrate for H2S synthesis. However, there are no significant difference between healthy and cirrhotic rats in the liver expression of MPST, CBS, and CTH. These data, together with Km values for the enzymes, which were substantially above intracellular cysteine concentrations,31 suggest that the higher concentration of H2S in cirrhotic livers was due to the smaller rate of H2S degradation rather than the higher enzymatic production of H2S. In this respect, in our study, cirrhotic livers showed downregulated expression of rhodanese which converts H2S into sulfate, thereby diminishing H2S level.32 Rhodanese is an enzyme located in the mitochondria33 and is susceptible to oxidative stress34 which accompanies liver injury.35
The importance of the liver, and likely rhodanese, in detoxifying or buffering the amount of the gut-derived H2S entering the systemic circulation was notably evident in rats treated with higher doses of H2S. Namely, cirrhotic rats developed a significant systemic hypotension leading to death, whereas healthy rats showed only a transient hypotension.
Taking together, our findings imply that the gut-derived H2S contributes to the regulation of PBP and ABP. Moreover, it may produce harmful hemodynamic effects in liver cirrhosis by augmenting portal hypertension and systemic hypotension.
A limitation of our study is that thioacetamide-induced liver cirrhosis may not reflect the whole spectrum of liver cirrhosis caused by numerous factors, such viral infections that may differently affect biochemical activity of the liver.36 However, in our study, histological and hemodynamic characteristics of cirrhotic rats were like those found in liver cirrhosis of various origin in humans.
In conclusion, colon-administered H2S increases PBP while decreasing systemic ABP in rats. Importantly, the hemodynamic effects are more pronounced in cirrhotic animals which exhibit decreased expression of rhodanese, an enzyme transforming H2S to other sulfur compound. Therefore, the gut-derived H2S may contribute to the control of portal and ABPs, and may be involved in the etiology of portal hypertension and systemic hypotension in liver cirrhosis. Further studies on hemodynamic effects of gut-derived molecules, such as H2S, are needed.
Authors’ contributions
The experiments were performed at the Laboratory of Experimental Physiology and Pathophysiology, Laboratory of the Centre for Preclinical Research, Medical University of Warsaw, Poland and the Laboratory of Medical Biochemistry, Jagiellonian University Medical College, Krakow, Poland.
Conception or design of the work – TH, MU. Acquisition, analysis, or interpretation of data for the work; TH, HJ, MW, KJ, MO, MU. Drafting the work – TH, HJ, MW, KJ, MO, MU.
All authors have approved the final version of the manuscript and agreed to be accountable for all aspects of the work. All persons designated as authors qualify for authorship, and all those who qualify for authorship are listed.
Declaration of Conflicting Interests
The author(s) declared no potential conflicts of interest with respect to the research, authorship, and/or publication of this article.
Funding
This work was supported by the National Science Centre, Poland grant no. UMO-2016/22/E/NZ5/00647.
References
- 1.Ramazzini B. De morbis artificum diatriba [diseases of workers]. 1713. Am J Pub Health 2001; 91:1380–2 [DOI] [PMC free article] [PubMed] [Google Scholar]
- 2.Tomasova L, Konopelski P, Ufnal M. Gut Bacteria and hydrogen sulfide: the new old players in circulatory system homeostasis. Molecules 2016; 21:pii: E1558 [DOI] [PMC free article] [PubMed] [Google Scholar]
- 3.Yoo D, Jupiter RC, Pankey EA, Reddy VG, Edward JA, Swan KW, Peak TC, Mostany R, Kadowitz PJ. Analysis of cardiovascular responses to the H2S donors Na2S and NaHS in the rat. Am J Physiol Heart Circ Physiol 2015; 309:H605–14 [DOI] [PMC free article] [PubMed] [Google Scholar]
- 4.Shen X, Carlstrom M, Borniquel S, Jadert C, Kevil CG, Lundberg JO. Microbial regulation of host hydrogen sulfide bioavailability and metabolism. Free Rad BiolMed 2013; 60:195–200 [DOI] [PMC free article] [PubMed] [Google Scholar]
- 5.Tomasova L, Dobrowolski L, Jurkowska H, Wrobel M, Huc T, Ondrias K, Ostaszewski R, Ufnal M. Intracolonic hydrogen sulfide lowers blood pressure in rats. Nitric Oxide 2016; 60:50–8 [DOI] [PubMed] [Google Scholar]
- 6.Flannigan KL, McCoy KD, Wallace JL. Eukaryotic and prokaryotic contributions to colonic hydrogen sulfide synthesis. Am J Physiol Gastrointest Liver Physiol 2011; 301:G188–93 [DOI] [PubMed] [Google Scholar]
- 7.Martin GR, McKnight GW, Dicay MS, Coffin CS, Ferraz JG, Wallace JL. Hydrogen sulphide synthesis in the rat and mouse gastrointestinal tract. Digest Liver Dis 2010; 42:103–9 [DOI] [PubMed] [Google Scholar]
- 8.Kang JS, Wanibuchi H, Morimura K, Puatanachokchai R, Salim EI, Hagihara A, Seki S, Fukushima S. Enhancement by estradiol 3-benzoate in thioacetamide-induced liver cirrhosis of rats. Toxicol Sci 2005; 85:720–6 [DOI] [PubMed] [Google Scholar]
- 9.Wallace MC, Hamesch K, Lunova M, Kim Y, Weiskirchen R, Strnad P, Friedman SL. Standard operating procedures in experimental liver research: thioacetamide model in mice and rats. Lab Anim 2015; 49:21–9 [DOI] [PubMed] [Google Scholar]
- 10.Kartha RV, Zhou J, Hovde LB, Cheung BW, Schroder H. Enhanced detection of hydrogen sulfide generated in cell culture using an agar trap method. Anal Biochem 2012; 423:102–8 [DOI] [PubMed] [Google Scholar]
- 11.Bronowicka-Adamska P, Wrobel M, Magierowski M, Magierowska K, Kwiecien S, Brzozowski T. Hydrogen sulphide production in healthy and ulcerated gastric mucosa of rats. Molecules 2017; 22:pii: E530 [DOI] [PMC free article] [PubMed] [Google Scholar]
- 12.Meng G, Ma Y, Xie L, Ferro A, Ji Y. Emerging role of hydrogen sulfide in hypertension and related cardiovascular diseases. Br J Pharmacol 2015; 172:5501–11 [DOI] [PMC free article] [PubMed] [Google Scholar]
- 13.Whiteman M, Moore PK. Hydrogen sulfide and the vasculature: a novel vasculoprotective entity and regulator of nitric oxide bioavailability? J Cell Mol Med 2009; 13:488–507 [DOI] [PMC free article] [PubMed] [Google Scholar]
- 14.Jin HF, Du JB, Li XH, Wang YF, Liang YF, Tang CS. Interaction between hydrogen sulfide/cystathionine gamma-lyase and carbon monoxide/heme oxygenase pathways in aortic smooth muscle cells. Acta Pharmacol Sin 2006; 27:1561–6 [DOI] [PubMed] [Google Scholar]
- 15.Olson KR, Dombkowski RA, Russell MJ, Doellman MM, Head SK, Whitfield NL, Madden JA. Hydrogen sulfide as an oxygen sensor/transducer in vertebrate hypoxic vasoconstriction and hypoxic vasodilation. J Exp Biol 2006; 209:4011–23 [DOI] [PubMed] [Google Scholar]
- 16.Olson KR. Is hydrogen sulfide a circulating “gasotransmitter” in vertebrate blood? Biochim Biophys Acta. 2009; 1787:856–63 [DOI] [PubMed] [Google Scholar]
- 17.Furne J, Saeed A, Levitt MD. Whole tissue hydrogen sulfide concentrations are orders of magnitude lower than presently accepted values. Am J Physiol Regul Integr Comp Physiol 2008; 295:R1479–85 [DOI] [PubMed] [Google Scholar]
- 18.Deplancke B, Finster K, Graham WV, Collier CT, Thurmond JE, Gaskins HR. Gastrointestinal and microbial responses to sulfate-supplemented drinking water in mice. Exp Biol Med 2003; 228:424–33 [DOI] [PubMed] [Google Scholar]
- 19.Magee EA, Richardson CJ, Hughes R, Cummings JH. Contribution of dietary protein to sulfide production in the large intestine: an in vitro and a controlled feeding study in humans. Am J Clin Nutr 2000; 72:1488–94 [DOI] [PubMed] [Google Scholar]
- 20.Ebrahimkhani MR, Mani AR, Moore K. Hydrogen sulphide and the hyperdynamic circulation in cirrhosis: a hypothesis. Gut 2005; 54:1668–71 [DOI] [PMC free article] [PubMed] [Google Scholar]
- 21.Siebert N, Cantre D, Eipel C, Vollmar B. H2S contributes to the hepatic arterial buffer response and mediates vasorelaxation of the hepatic artery via activation of K(ATP) channels. Am J Physiol Gastrointest Liver Physiol 2008; 295:G1266–73 [DOI] [PubMed] [Google Scholar]
- 22.Norris EJ, Larion S, Culberson CR, Clemens MG. Hydrogen sulfide differentially affects the hepatic vasculature in response to phenylephrine and endothelin 1 during endotoxemia. Shock 2013; 39:168–75 [DOI] [PubMed] [Google Scholar]
- 23.Distrutti E, Mencarelli A, Santucci L, Renga B, Orlandi S, Donini A, Shah V, Fiorucci S. The methionine connection: homocysteine and hydrogen sulfide exert opposite effects on hepatic microcirculation in rats. Hepatology 2008; 47:659–67 [DOI] [PubMed] [Google Scholar]
- 24.Fiorucci S, Antonelli E, Mencarelli A, Orlandi S, Renga B, Rizzo G, Distrutti E, Shah V, Morelli A. The third gas: H2S regulates perfusion pressure in both the isolated and perfused normal rat liver and in cirrhosis. Hepatology 2005; 42:539–48 [DOI] [PubMed] [Google Scholar]
- 25.Tan G, Pan S, Li J, Dong X, Kang K, Zhao M, Jiang X, Kanwar JR, Qiao H, Jiang H, Sun X. Hydrogen sulfide attenuates carbon tetrachloride-induced hepatotoxicity, liver cirrhosis and portal hypertension in rats. PloS One 2011; 6:e25943. [DOI] [PMC free article] [PubMed] [Google Scholar]
- 26.Shen X, Pattillo CB, Pardue S, Bir SC, Wang R, Kevil CG. Measurement of plasma hydrogen sulfide in vivo and in vitro. Free Radic Biol Med 2011; 50:1021–31 [DOI] [PMC free article] [PubMed] [Google Scholar]
- 27.Zhao W, Zhang J, Lu Y, Wang R. The vasorelaxant effect of H(2)S as a novel endogenous gaseous K(ATP) channel opener. EMBO J 2001; 20:6008–16 [DOI] [PMC free article] [PubMed] [Google Scholar]
- 28.Newby DE, Hayes PC. Hyperdynamic circulation in liver cirrhosis: not peripheral vasodilatation but 'splanchnic steal'. QJM 2002; 95:827–30 [DOI] [PubMed] [Google Scholar]
- 29.Vallance P, Moncada S. Hyperdynamic circulation in cirrhosis: a role for nitric oxide? Lancet 1991; 337:776–8 [DOI] [PubMed] [Google Scholar]
- 30.Liu M, Wu L, Montaut S, Yang G. Hydrogen sulfide signaling axis as a target for prostate cancer therapeutics. Prostate Cancer 2016; 2016:8108549. [DOI] [PMC free article] [PubMed] [Google Scholar]
- 31.Jurkowska H, Roman HB, Hirschberger LL, Sasakura K, Nagano T, Hanaoka K, Krijt J, Stipanuk MH. Primary hepatocytes from mice lacking cysteine dioxygenase show increased cysteine concentrations and higher rates of metabolism of cysteine to hydrogen sulfide and thiosulfate. Amino Acids 2014; 46:1353–65 [DOI] [PMC free article] [PubMed] [Google Scholar]
- 32.Kabil O, Vitvitsky V, Banerjee R. Sulfur as a signaling nutrient through hydrogen sulfide. Annu Rev Nutr 2014; 34:171–205 [DOI] [PMC free article] [PubMed] [Google Scholar]
- 33.Smirnov A, Comte C, Mager-Heckel AM, Addis V, Krasheninnikov IA, Martin RP, Entelis N, Tarassov I. Mitochondrial enzyme rhodanese is essential for 5 S ribosomal RNA import into human mitochondria. J Biol Chem 2010; 285:30792–803 [DOI] [PMC free article] [PubMed] [Google Scholar]
- 34.Krueger K, Koch K, Juhling A, Tepel M, Scholze A. Low expression of thiosulfate sulfurtransferase (rhodanese) predicts mortality in hemodialysis patients. Clin Biochem 2010; 43:95–101 [DOI] [PubMed] [Google Scholar]
- 35.Amirtharaj GJ, Thangaraj KR, Kini A, Raghupathy V, Goel A, Eapen CE, Venkatraman A, Pulimood AB, Balasubramanian KA, Ramachandrana A. Acute liver injury induced by low dose dimethylnitrosamine alters mediators of hepatic vascular flow. Toxicol Rep 2014; 1:707–17 [DOI] [PMC free article] [PubMed] [Google Scholar]
- 36.Kopec AK, Joshi N, Luyendyk JP. Role of hemostatic factors in hepatic injury and disease: animal models de-liver. J Thromb Haemost 2016; 14:1337–49 [DOI] [PMC free article] [PubMed] [Google Scholar]


