

Abstract
The von Hippel–Lindau tumor suppressor protein is the substrate binding subunit of the VHL E3 ubiquitin ligase, which targets hydroxylated α subunit of hypoxia inducible factors (HIFs) for ubiquitination and subsequent proteasomal degradation. VHL is a potential target for treating anemia and ischemic diseases, motivating the development of inhibitors of the VHL:HIF-α protein–protein interaction. Additionally, bifunctional proteolysis targeting chimeras (PROTACs) containing a VHL ligand can hijack the E3 ligase activity to induce degradation of target proteins. We report the structure-guided design and group-based optimization of a series of VHL inhibitors with low nanomolar potencies and improved cellular permeability. Structure–activity relationships led to the discovery of potent inhibitors 10 and chemical probe VH298, with dissociation constants <100 nM, which induced marked HIF-1α intracellular stabilization. Our study provides new chemical tools to probe the VHL-HIF pathways and new VHL ligands for next-generation PROTACs.
Introduction
Proteins are constantly synthesized and targeted for degradation during cellular homeostasis. The major pathway to protein degradation is the ubiquitin–proteasome system (UPS), first reported in the early 1980s.1 In a highly regulated enzymatic signaling cascade, ubiquitin is covalently attached to a substrate protein as a monomer or as a polyubiquitin chain, promoting proteasome-catalyzed target degradation.2,3 The complexity and biological importance of the UPS, together with implication of this pathway in a wide range of diseases, highlight its importance as a therapeutic target.4,5 The market release of the pioneering proteasome inhibitors bortezomib and carfilzomib, for the treatment of hematopoietic and lymphoid malignancies, validated the UPS as a focus for therapeutic intervention and opened the door to a new series of proteasome inhibitors.5−7 Despite their success, proteasome inhibitors lack substrate specificity, which is a significant limitation to their use as chemical probes of specific biological pathways and leads to unwanted side effects in their use as drugs.7,8
Specific binding of a target substrate to an E3 ubiquitin ligase is required for substrate ubiquitination and is therefore a key step in the ubiquitination process.3,9 E3 ubiquitin ligases determine specificity of substrate ubiquitination and thus could be regarded as more attractive targets to center drug discovery efforts over the proteasome. However, small-molecule modulators of E3 ligases need to target protein–protein interactions (PPIs), either directly or allosterically.10 The typically flat and featureless nature of many PPI interfaces can be a limiting factor in the development of potent and selective inhibitors.11,12 To cover considerable protein surface area that often lacks well-defined pockets, most PPI inhibitors tend to be larger in size than classical enzyme inhibitors or receptor antagonists, forcing medicinal chemists to break conventional drug-like quality metrics.13−15 These observations consequently led to E3 ligases being perceived as untractable target space.16 On the other hand, the identification of small-sized hotspots for certain PPIs, particularly those characterized by the recognition of primary-type linear epitopes, has led to the successful observation of small-molecule-sized patches on protein surfaces that could be adequately targeted by drug-like molecules.17−19 Today, several small molecules that modulate PPIs have been developed as chemical probes, and many have entered clinical trials.19,20 These realizations have reinvigorated drug discovery efforts for a wide range of PPI-based targets, including E3 ubiquitin ligases.21
The von Hippel–Lindau protein (VHL) is a member of the Cullin-RING ligase family of E3 ubiquitin ligases.21 The major substrate of VHL is the hypoxia inducible factor 1α (HIF-1α), a transcription factor that drives the transcriptional program of many human genes,22 mainly involved in hypoxia adaptation.23,24 When tissue oxygen levels are normal, HIF-1α expression levels are tightly controlled. Iron- and oxygen-dependent hydroxylation occurs at two specific proline residues within the HIF-1α oxygen-dependent degradation domain (ODD) by prolyl hydroxylase domain (PHD) enzymes. This modification leads to HIF-1α specific recognition and ubiquitination by VHL and subsequent degradation via the UPS (Supporting Information, Figure 1).25−28
The importance of this pathway has been uncovered in a wide range of diseases, including conditions characterized by anemia, ischemia, inflammation, chronic neurodegeneration, and more recently mitochondrial dysfunction.29−32 Small-molecule inhibition of this pathway could activate HIF-1α expression, upregulating genes involved in the hypoxic response, consequently providing a potential therapeutic strategy. Indeed, small-molecule PHD inhibitors have been developed that have shown potential in a number of pathologies.33−35 Among these, the candidate FG-4592 (N-[(4-hydroxy-1-methyl-7-phenoxy-3-isoquinolinyl)carbonyl]glycine, also known as roxadustat or ASP1517) has progressed to a phase III clinical trial to evaluate efficacy and safety in hemodialysis chronic kidney patients with anemia.36,37 Despite their clinical potential, no PHD inhibitor shows selectivity between the three different PHD paralogues (PHD1, PHD2, and PHD3).38 In addition, several non-HIF substrates of PHD enzymes have been identified.39,40 Lack of selectivity could promote unwanted side effects due to the different substrate specificities as well as cellular and tissue localization of PHD enzymes.38
In contrast to PHD inhibitors, inhibitors of the VHL:HIF-1α PPI would allow blocking the pathway downstream of HIF hydroxylation by PHD enzymes.41 This approach could avoid HIF-independent off-target effects and deliver new lead compounds as hypoxia mimetics.42 To validate the chemical intervention on VHL and establish the biological consequences of modulating its activity, small molecules must effectively penetrate cells and engage with VHL with enough potency to productively block HIF-1α binding. In a different approach, VHL ligands can be conjugated to target ligands of interest to design VHL-recruiting bivalent chimeric ligands (also known as PROTACs).43 PROTACs can efficiently hijack the VHL ligase to induce intracellular degradation of the desired target proteins. Previous work from our laboratory and others have demonstrated potent and selective activities of VHL-recruiting PROTACs against a wide range of target proteins, including Brd4,44−48 RIPK2,49 and c-Abl kinase among others.50
Co-crystal structures of VHL bound with a hydroxyproline peptide from human HIF-1α carboxy-terminal oxygen-dependent degradation (CODD) motif identified a groove on the pVHL surface, which accommodated the substrate peptide.28,51 Recognizing that this primary type PPI could be suitably targeted by small-molecule disruptors, in pioneering work, our laboratory in collaboration with the Crews laboratory developed a first-generation of VHL ligands with single-digit micromolar binding affinities based around the central hydroxyproline core fragment.17,52−54 However, these initial compounds proved inactive as PPI inhibitors in cells. Subsequent structure-guided optimization led to more potent inhibitors with improved nanomolar binding affinities.55 The best inhibitor of this series, compound 1 (VH032, Figure 1A) was able to disrupt the VHL:HIF-1α PPI in cells, illustrated by its capacity to stabilize hydroxylated HIF-1α.41 Nevertheless, this inhibitor showed low passive cell permeability and exhibited a large mismatch between in vitro potency in solution and in cells.41
Figure 1.
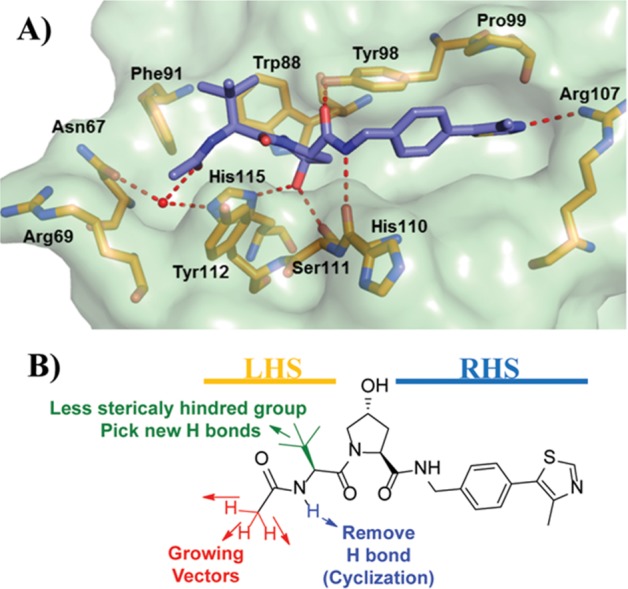
Initial optimization strategy. (A) X-ray crystal structure of VHL, elongin B, and elongin C (VBC) protein complex with inhibitor 1 (purple carbons, PDB 4W9H).55 VHL is shown as a pale-green surface and the VHL residues forming the binding pocket as orange stick representations. (B) Designed group modifications on inhibitor 1 to improve activity.
Motivated by a desire to drive further inhibitor optimization, analysis of the X-ray crystal structure of the complex composed of VHL, elongin B, and elongin C (VBC) with 1 suggested an attractive pocket at the left-hand side (LHS) of the VHL:HIF interface that was only partially filled by the terminal acetamide group of 1 and could therefore provide space to further grow and optimize the molecule (Figure 1A). Herein, we describe a systematic group-based optimization of VHL inhibitors starting from 1, improving binding affinity, cell membrane passive permeability, and ultimately cellular activity, a campaign that led to the discovery of inhibitor 15 (VH298), a potent and selective probe of the hypoxia HIF-1α pathway.41
Results and Discussion
VHL Inhibitor SAR
We aimed to optimize the physicochemical properties and binding affinity of VHL inhibitors in order to minimize the observed mismatches between biophysical and cellular potency.41 The information gathered from the co-crystal structure of inhibitor 1 bound to VBC protein complex offered a starting point for the design of a new series of inhibitors by adding small modifications on the LHS of the inhibitor (Figure 1A).
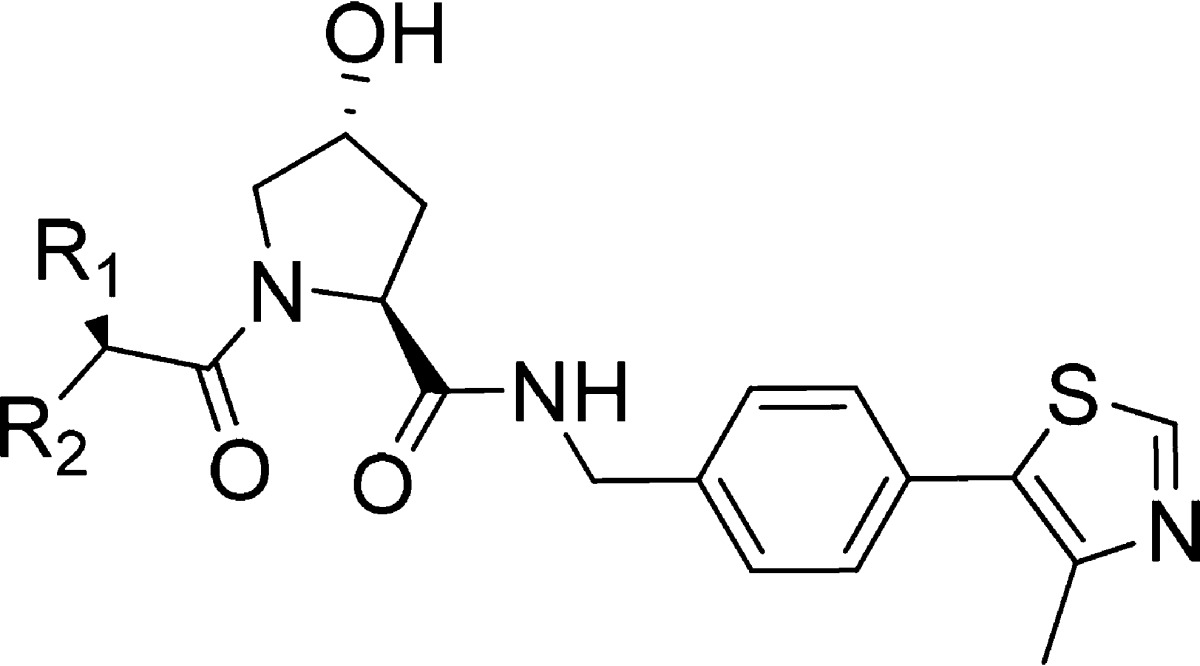
In the first new series of inhibitors, we decided to keep the carbonyl on the LHS in order to maintain the hydrogen bond between this group and the structural water in this pocket. Our design strategy was to replace the three hydrogens of the acetamide methyl group, one at a time, using alkyl groups to better fill the LHS pocket or adding electron-withdrawing groups at the α position of the LHS amide in order to lock its conformation.56,57 It was also decided to evaluate the effect of removing the LHS acetamide hydrogen-bond donor group (NH) via cyclization, which we hypothesized could improve cellular permeability (Figure 1B).58 The synthesized compounds were evaluated biophysically in a direct binding assay using isothermal titration calorimetry (ITC) and for their ability to displace a high-affinity HIF peptide using fluorescence polarization (FP). In parallel, the compounds cellular activity was evaluated in HeLa cells by monitoring protein levels of HIF-1α using Western blot (Table 1).
Table 1. Chemical Structure, FP Kds Back-Calculated from IC50s,17 ITC Measured Kds, and Group Efficiencies (GE) [Based on FP Results and Calculated as GE = ΔpKd/ΔHA (Heavy Atoms)] of Inhibitors 1 and 2–12.

HeLa cells were treated with 50 μM of the respective inhibitor and HIF-1α stabilization levels were measured by Western blot after 2 h treatment (protein levels normalized to HIF-1α stabilization level observed with 1).
Substitution of a single hydrogen on the acetamide group for a hydroxyl (3) maintained binding affinity but led to a substantial loss in cellular potency. On the other hand, expansion of the alkyl chain from methyl to ethyl (4) allowed the retention of inhibitor cellular potency despite a 2-fold loss in inhibitor binding affinity. These two observations suggested that tuning hydrogen bond donors and lipophilicity could play as important a role as binding affinity in determining cellular activity. Replacing all three hydrogens with fluorine (7) or chlorine groups (8) did not impact binding affinity and cellular potency. In contrast, introduction of a bulky tert-butyl group (5) resulted in a loss in binding affinity and in cellular potency, a similar effect observed when replacing all hydrogens for two methyl groups together with one fluorine group (9). However, substitution of two hydrogens with a restrained cyclopropyl group (6) promoted a small improvement in both binding affinity and cellular activity. Further replacement of the tertiary hydrogen of 6 with a fluorine (10) led to a marked increase in both binding affinity and cellular potency compared to 1 and 6 (Table 1). Figure 2 illustrates representative ITC and FP binding curve for 10, the most potent inhibitor of the series, and the parent inactive epimer cis-10, which due to a change in the proline OH group orientation no longer binds to VHL.
Figure 2.

Biophysical characterization of inhibitor 10 binding to VBC. (A) Competitive FP binding assay curve, monitoring the displacement of a 20-mer FAM-labeled HIF-1α peptide bound from VBC by inhibitor 10 (Kd = 3 nM). (B) ITC titrations of 300 μM inhibitor 10 (blue) or 300 μM of its cis inactive epimer (green) into 30 μM VBC protein.
Attempts to modify other regions of the chemical structure of 1 did not yield improvements. For example, modification of the tert-leucine side chain for a less bulky alanine side chain (11), or removal of the acetamide hydrogen bond donor group through cyclization into a pyrrolidinone (12) led to significant loss of inhibitor binding affinity and cellular potency. Last, acetamide methyl group substitution for a Boc protecting group (2) was not tolerated, resulting in the greatest loss in binding and cellular potency.
To better understand the SAR of this new inhibitor series, the X-ray crystal structures of inhibitors 3, 6, 10, and 11 bound to VBC were obtained. All solved structures revealed a conserved inhibitor binding mode at the VHL:HIF interface (Figure 3), consistent with the binding of 1.55 The crystal structure of 3 shows two different conformations upon binding to VBC, each with 50% of occurrence. In the first inhibitor conformation, the added OH group points upward, forming an extra hydrogen bond with a structural water that promotes the formation of an interaction network between Tyr112 side chain and the amide carbonyl on the LHS of inhibitor’s hydroxyproline (Hyp) (Figure 3A). In the second conformation, the hydroxyl group formed a bidentate interaction with the structural water present on the far left side of the binding pocket, together with LHS amide carbonyl (Figure 3B). These favorable interactions contribute to a small improvement in inhibitor binding affinity (Table 1).
Figure 3.

Co-crystal structures of first-series inhibitors. Crystal structures of VBC in complex with 3 (A,B), 6 (C), 10 (D), and 11 (E). VHL inhibitors are shown as sticks with purple carbons. VHL is shown as a pale-green surface and the VHL residues forming the binding pocket as orange stick representations. Inhibitor-binding waters are shown as red spheres. Hydrogen bond interactions between inhibitors, bound waters, and VHL pocket residues are shown as dashed red lines.
Crystal structures of 6 (Figure 3C) and 10 (Figure 3D) showed the cyclopropyl group occupying the far LHS of the VHL–HIF interface, maintaining the hydrogen bond interactions with the structural water. The addition of cyclopropyl induces a conformational modification in the residues on this side of the pocket to accommodate this moiety. The most notable conformational change is observed on the side chain of Arg69, which adopts a bent conformation to accommodate the new group on the LHS. From the crystal structure of inhibitor 10, the fluorine atom at the α position is found anti to the amide carbonyl. This matches a known minimum-energy conformation for α-fluoroamides.56,57 This effect allows the inhibitor to be preorganized in its bound conformation prior to binding, thus minimizing the entropic penalty to binding and as a result increasing binding affinity.
Substitution of the tert-leucine group for a less bulky alanine in 11 was meant to more closely mimic the sequence of the HIF-1α peptide (Supporting Information, Figure 2). This modification however led to a less rigid conformation on the inhibitor LHS. In the co-crystal structure of 11 (Figure 3E), the ligand bends upward, increasing the distance between the acetamide carbonyl and the structural water from 2.8 ± 0.1 to 3.8 ± 0.5 Å (Supporting Information, Figure 3), consequently weakening this hydrogen bond and decreasing the binding affinity.
The first inhibitor series led us to the discovery of 10, a VHL inhibitor with double-digit nanomolar binding affinity, good cell membrane permeability, and high activity in cells (Table 1 and Figure 4A), which are some of the key parameters needed for a good chemical probe.59 Despite meeting these benchmarks, further investigation revealed a degree of cytotoxicity for 10, which notably decreased cell proliferation relative to DMSO vehicle (Figure 4B,C). The inactive epimer cis-10 still presented a degree of cytotoxicity (Figure 4B,C). Together, these findings suggested an off-target toxicity for 10 (Figure 4).
Figure 4.

Cellular activity and toxicity of 10. (A) Activity of inhibitor 10 in HeLa cells expressing a hypoxia responsive element (HRE)-luciferase reporter and treated with indicated concentrations for 24 h. Luminescence reports luciferase expression as proxy of HIF-α activity.41 Colony formation (B) and cell-proliferation assays (C) showing toxicity in HeLa cells after treatment with 150 μM of inhibitor 10 and its cis epimer.
The observed cytotoxicity of 10 motivated us to identify a more suitable chemical probe. On the basis of the information furnished by the co-crystal structure, we designed a second series of VHL inhibitors (Figure 5).
Figure 5.
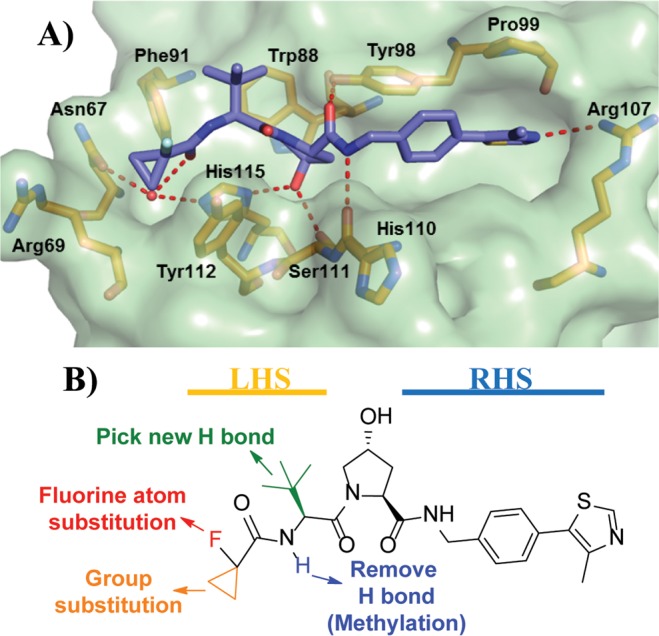
Second series optimization strategy. (A) X-ray crystal structure of VBC protein complex with inhibitor 10. VHL is shown as a pale-green surface and the VHL residues forming the binding pocket as orange stick representations. (B) Designed group modifications on inhibitor structure to improve inhibitor activity and optimize inhibitors toward a chemical probe.
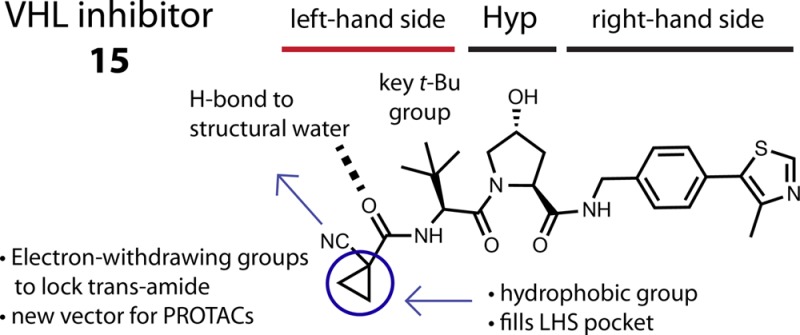
In this second series, we initially studied the impact of changing the fluorine atom for other electron withdrawing groups or promoters of intramolecular hydrogen bonds. Second, to exploit the flexibility of Arg69 in the LHS pocket, we expanded the cyclopropyl ring by adding larger and more lipophilic groups. In addition, we considered moieties that could potentially form a hydrogen bond with the Arg69 side chain or, alternatively, together with the LHS carbonyl amide, could form bidentate hydrogen bonds with the structural water present in the LHS pocket. Finally, we decided to test the impact of methylating the solvent-exposed NH group of the LHS acetamide and of replacing the tert-leucine side chain for threonine to explore potential hydrogen bonds at the top LHS pocket, as observed previously (Figure 5B).53
Removing the hydrogen bond donor group through methylation (13) resulted in a major loss in binding affinity and cellular potency when compared with 1, presumably due to destabilization of the required trans-amide bond conformation. Substitution of tert-leucine on 10 for a threonine (14) side chain group also led to a loss in binding affinity and cellular activity. Conversion of the fluorine group into an electron-withdrawing group such a cyano (15) revealed a 2-fold increase in binding affinity and in cellular potency compared to 1. Changing the fluorine group for a ketone moiety (16) also improved both binding affinity and cellular activity. Modification of the fluorine atom with an acetamide (17) retained a comparable affinity when compared with 1 but yielded a considerable loss in cellular potency, presumably as a result of poorer cell membrane passive permeability. Expansion of the cyclopropyl ring into a cyclobutyl (18) led to a small loss of inhibitor binding affinity but a greater cellular activity, presumably due to the increased lipophilicity and permeability. Conversion of the cyclopropyl group into an oxetane (19) retained binding affinity but led to a 4-fold loss in cellular activity. Further conversion of the cyclopropyl group into a cyclobutanone (20) or into an acetylated azetidine (21) led to a 2- and 20-fold loss in binding affinity and a 5- and 11-fold decrease in cellular potency, respectively.
In summary, while we were not able to improve binding affinity beyond that of inhibitor 10, most of the designed inhibitors retained in vitro binding potencies around 100 nM and also retained high cellular activity, in many cases greater than starting inhibitor 1. In particular, 15 and 10 were the only compounds that showed Kd < 100 nM and positive group efficiencies (Table 2). Inhibitor 15 was shown to be highly cell permeable (vide infra, Table 3) and exhibited cellular activity comparable with 10 and significantly greater than 1. Further investigation with 15 revealed no toxicity in cells (Figure 6), supporting further evaluation of it as a chemical probe.
Table 2. Chemical Structure, FP Back-Calculated Kds, ITC Measured Kds, and Group Efficiencies (GE) [Based on FP Results and Calculated as GE = ΔpKd/ΔHA (Heavy Atoms)] of Inhibitors 1, 10, and 13–21a.


HeLa cells were treated with 50 μM inhibitors and HIF-1α stabilization levels were measured by Western blot after 2 h treatment (protein levels normalized to HIF-1α stabilization level observed with 1).
Table 3. Structures, Kds Measured by ITC, Calculated Ligand Efficiency (LE) [LE = −ΔG/NHA = −RT ln Kd/NHA],65 and Ligand Lipophilic Efficiency (LLE) [LLE = pKd–Log D]65 On the Basis of ITC Results, PAMPA Measured Passive Permeability, Chromatographic Hydrophobicity Index log D (CHILogD7.4), Number of Hydrogen Bond Donors, Calculated Topological Polar Surface Area (TPSA), and Number of Rotatable Bonds of Inhibitors 1, 3, 6, and 15–19.

Permeability of inhibitors were determined at room temperature by PAMPA, using propanolol (medium permeability −62.7 nm/s) as a control.
Values calculated using StarDrop software.
Figure 6.

Inhibitor 15 is not cytotoxic. Colony formation (A) and cell-proliferation assays (B) showing no toxicity in HeLa cells after treatment with 150 μM of inhibitor 15 and its cis epimer.
To support the SAR results of the second inhibitor series, the X-ray crystal structures of 15 and 16–19 bound to VBC were obtained. These crystal structures revealed that most of the key interactions and structural features observed for 10 were maintained. Described herein are the key changes in interactions observed at the LHS from the different groups. The cyano group on inhibitor 15 (Figure 7A) forms a hydrogen bond with a water molecule that allows the formation of a water network similar to the one observed in the crystal structure with inhibitor 3 bound (Figure 3A). In the crystal structure of inhibitor 16 (Figure 7B), the ketone adopts an optimal distance (2.5 ± 0.1 Å) and acceptable orientation (angles formed between the C=O bond and amide nitrogen of 90.7 ± 2.0° and between the C–N bond and ketone oxygen of 91.5 ± 0.8°) for the formation of an intramolecular hydrogen bond with the NH of inhibitor LHS amide (Supporting Information, Figure 5).60 The observed intramolecular interaction could stabilize the conformation of the LHS of the inhibitor, improving affinity and cell permeability, thus contributing to the observed high cellular activity.61,62
Figure 7.

Co-crystal structures of second-series inhibitors. Crystal structure of VBC in complex with 15 (A, PDB 5LLI), 16 (B), 17 (C), 18 (D), and 19 (E) (purple carbons). VHL is shown as a pale-green surface and the VHL residues forming the binding pocket as orange stick representations. Inhibitor-binding waters are shown as red spheres. Hydrogen bond interactions between inhibitors, bound waters, and VHL pocket residues are shown as dashed red lines.
The crystal structure of 17 (Figure 7C) did not show any major changes in the ligand binding mode and in the conformation of pocket residues when compared with the crystal structure of the fluoro-analogue 10 (Figure 3C). The terminal acetamide of 17 points upward toward the solvent, not forming any new interactions with the protein nor an intramolecular hydrogen bond with the NH of the LHS inhibitor amide. These features, together with the extra amide H-bond donor group, likely account for the poor cellular activity of 17 (Table 2).
The structure of inhibitor 18 bound to VBC did not reveal any critical changes in either the ligand or pocket residue conformations (Figure 7D). The cyclobutyl moiety fills the far LHS of the pocket, inducing a conformational change to the side chain of Arg69, as previously described.41 Replacement of the cyclobutyl with an oxetane group in inhibitor 19 showed that the ether oxygen was able to replace the LHS amide in the ability to form a hydrogen bond with the LHS structural water (Figure 7E). A hydrogen bond interaction from the oxetane oxygen (2.9 ± 0.1 Å distance) leads to an increase in the distance between the amide carbonyl oxygen and the structural water (3.7 ± 0.2 Å) (Supporting Information, Figure 6). This is incompatible with the bidentate interaction mode previously observed with inhibitor 3, a result of the increased distance between the two oxygen atoms in 19 relative to 3 and the steric constraints of the oxetane ring.
In summary we describe a group-based optimization of 1 that led us to the discovery of a more potent inhibitor 10. Further optimization led us to the discovery of inhibitor 15 which showed equivalent cellular potency when compared with 10 and was not cytotoxic in cells.
Chemistry
Intermediate 22, 24, and 27 were obtained following the protocol previously described by us.41,55 Intermediate 22 was used for the synthesis of final inhibitors 4 and 6–8 via acylation or inhibitors 3, 5, 9, 10, and 16–20 by amide coupling reaction (Scheme 1). Further treatment of intermediate 22 with 4-chlorobutanoyl chloride, followed by intramolecular cyclization, led to the synthesis of inhibitor 12 (Scheme 1). Reductive amination of 22 with formaldehyde followed by acylation yielded inhibitor 13 (Scheme 1). An amide coupling reaction between intermediate 22 and 1-(tert-butoxycarbonyl)azetidine-3-carboxylic acid led to the intermediate 23, which after deprotection, followed by acylation, yielded inhibitor 21 (Scheme 1).
Scheme 1.

Reagents and conditions: (i) N(Et)3, anhydride derivative, DCM, rt, 2 h; (ii) 4-chlorobutanoyl chloride, DCM/NaOH, rt, 1 h; KOtBu, THF, 0 °C–rt, on; (iii) carboxylic acid derivative, HATU, DIPEA, DMF, rt, 1 h; (iv) TFA:DCM, rt, 30 min; (v) N(Et)3, acetic anhydride, DCM, rt, 2 h; (vi) formaldehyde, DMF, rt, 90 min, NaBH(OAc)3, rt, 10 min; (vii) N(Et)3, acetic anhydride, DCM, rt, 2 h.
Intermediates 25 and 26 were obtained from intermediate 24 after deprotection with trifluoroacetic acid followed by amide coupling reaction with l-alanine or l-threonine, respectively. Final inhibitors 11 and 14 were obtained from intermediates 25 and 26 after their deprotection followed by acylation or amide coupling reaction, respectively (Scheme 2).
Scheme 2.

Reagents and conditions: (i) TFA:DCM, rt, 30 min; (ii) Boc-l-Ala, HATU, DIPEA, DMF, rt, 1 h; (iii) TFA:DCM, rt, 30 min; (iv) N(Et)3, acetic anhydride, DCM, rt, 2 h; (v) Boc-l-Thr, HATU, DIPEA, DMF, rt, 1 h; (vi) 1-fluorocyclopropanecarboxylic acid, HATU, DIPEA, DMF, rt, 1 h.
The cis epimer of inhibitor 10 was obtained from intermediate 27 following the same synthetic pathway used for its trans conformer, using Boc-Hyp cis epimer to obtain the desired final inhibitor (Scheme 3).
Scheme 3.

Reagents and conditions: (i) TFA:DCM, rt, 30 min; (ii) 1-fluorocyclopropanecarboxylic acid, HATU, DIPEA, DMF, rt, 1 h.
Evaluation of VHL Inhibitor Permeability and Binding Kinetics
Cell membrane passive permeability is known to have an important role in inhibitor optimization, as it can lead to an increase in intracellular concentration of inhibitor available to interact with the desired target, which would be expected to increase cellular activity. Optimization of lipophilicity at physiological pH, topological polar surface area (TPSA), and number of rotatable bonds are known to directly impact cell membrane passive permeability.63,64 From the SAR results, it was possible to observe that the increase in cellular potency was not only related with the increase of inhibitor binding affinity to VBC (Figure 8A). Therefore, to evaluate how lipophilicity and cell membrane passive permeability contributed to VHL inhibitors activity in cells, these parameters were experimentally measured for a selection of the most potent inhibitors (Table 3).
Figure 8.
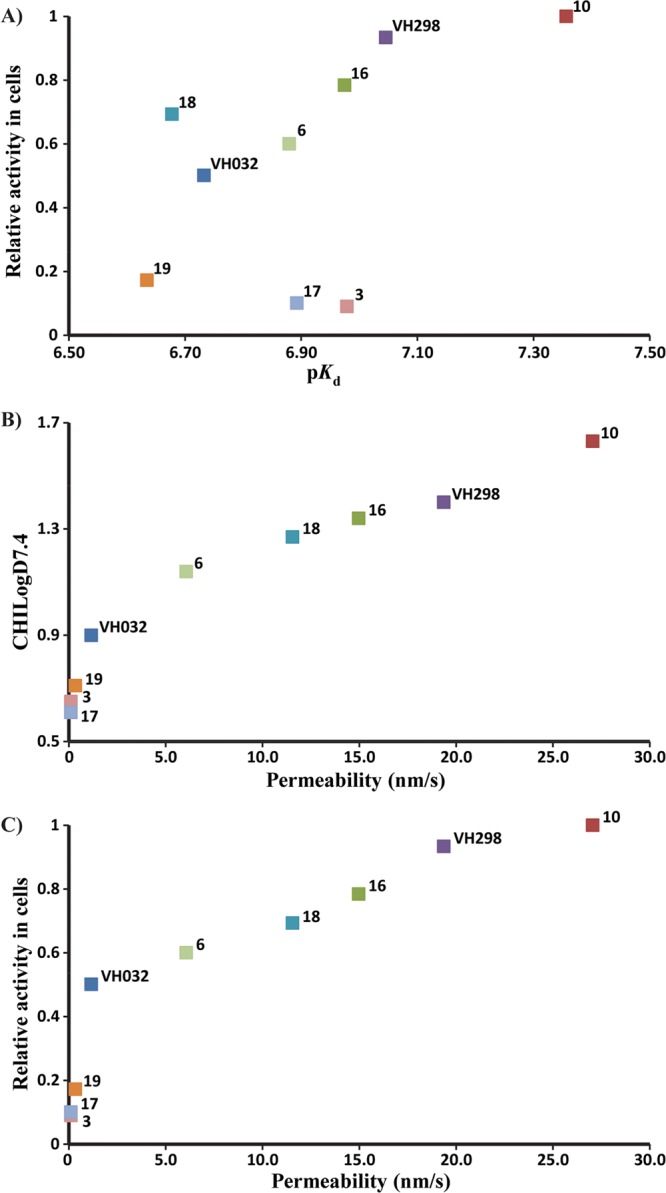
Correlations between cellular activity and physicochemical parameters in vitro. Reported values are from Tables 2 and 3 for inhibitors 1, 3, 6, 10, 15, and 16–19. (A) ITC pKd vs activity in cells. (B) CHILogD7.4 vs PAMPA permeability. (C) relative cellular activity vs permeability. HIF-1α protein levels measured using Western blot, as proxy of cellular activity, and normalized to protein levels with inhibitor 10.
Inhibitors 10 (LE = 0.27, LLE = 5.73), 15 (LE = 0.26, LLE = 5.65), and 16 (LE = 0.25, LLE = 5.63) with permeabilities of 27.1, 19.4, and 15.0 nm/s, respectively, were found to be the most permeable inhibitors. At the other extreme were inhibitors 3 (LE = 0.27, LLE = 6.28), 17 (LE = 0.24, LLE = 6.28), and 19 (LE = 0.25, LLE = 5.92) with the lowest permeability values. A direct relationship was observed between inhibitor permeability, lipophilicity, and activity in cells (Figure 8B,C). Inhibitors 6, 10, 15, 16, and 18 were found to be more lipophilic than starting inhibitor 1, contributing to their higher cellular permeability, which was thus reflected in their reasonable intracellular free compound concentration (Supporting Information, Table 1) that leads to a higher cellular potency.66 In contrast, analysis of TPSA, number of rotatable bonds, and number of hydrogen bond donors (HBDs) revealed no correlation with cell permeability (Table 3). Because of limitation of our PPI-targeting pharmacophore, these parameters in VHL inhibitors closely approach the maximal limits for desired membrane permeability (TPSA < 140 Å2, HBDs < 5).64,67 Clearly, for the most active inhibitors, these high values are compensated for by a higher lipophilicity, resulting in an overall increase of inhibitors permeability and activity in cells. The data, however, suggests that careful monitoring of these parameters is warranted. For example, adding an extra HBD group (from 3 to 4) in inhibitors 3 and 17 led to marked decrease in permeability and cellular potency compared to 1, despite the comparable CHILogD7.4 values (Tables 2 and 3). Similarly, breaking beyond TPSA of 140 Å2 in inhibitor 17 resulted in the lowest cell permeability and cellular activity amonst the tested inhibitors (Tables 2 and 3). These results argue for close monitoring of all these physicochemical properties during optimization of a PPI inhibitor.
In addition to permeability and binding affinity, binding kinetics are also key parameters that can influence cellular activity. Longer drug residence at the target can promote the duration of pharmacological on-target effect. To evaluate how the binding kinetics could influence VHL inhibitor activity in cells, binding kinetics parameters were determined by surface plasmon resonance for 1, 10, 15, 16, and 18, which all showed high passive membrane permeability and high potency in cells (Table 4). The binding experiments were performed at 10 and 20 °C in order to compare the kinetics and affinity of the inhibitors at different temperatures.
Table 4. Structures, Association (kon), and Dissociation (koff) Rate Constants Determined by Surface Plasmon Resonance (SPR), Kds Determined by SPR (Kd = koff/kon), Calculated Dissociative Half-Times (t1/2), and Microsomal and Plasma Stability of Inhibitors 1, 10, 15, 16, and 18.

Dissociative half-life of inhibitor–VBC binary complex calculated based on inhibitor dissociation rate constants (koff), t1/2 = ln2/koff.68
A close relationship was observed between dissociation rate constants and dissociation constants from VBC. Inhibitors 10, 15, and 16, with higher binding affinity than 1, also showed slower dissociation rates relative to 1 (Table 4). After comparison of the dissociative half-life (from VBC complex) of these inhibitors, it was possible to observe higher dissociation times correlate with higher cellular potencies. Inhibitor 10 and 15, the most active inhibitors in cells, had the highest dissociation half-lives among the compounds evaluated (Figure 9). It is worth pointing out that even the slowest off rates measured for our VHL inhibitors are still relatively fast overall. The resulting residence times are consequently all on the order of seconds, rather than minutes, suggesting that there is much scope to optimize this parameter in the future. Nevertheless, our data suggests that even these relatively short residence times suffice for a pharmacological effect on VHL, as shown with other drug–target interactions.69
Figure 9.
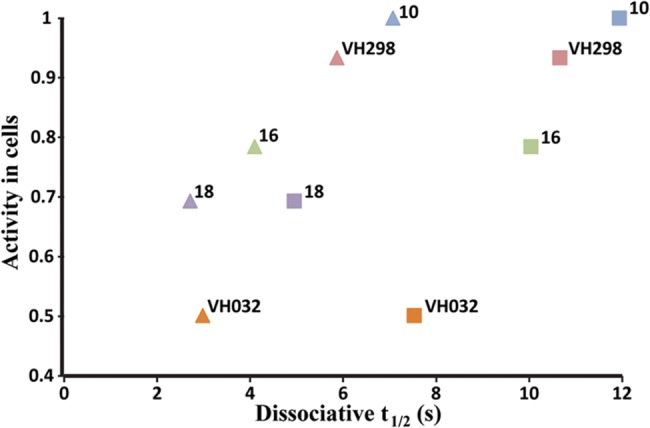
Activity in cells vs half-life dissociation from VBC protein complex. Values shown are for inhibitors 1, 3, 6, 10, 15, and 16–19 at 10 °C (squares) and at 20 °C (triangles). HIF-1α protein levels measured using Western blot, as proxy of cellular activity, and normalized to protein levels with inhibitor 10.
To begin to assess potential metabolic liabilities and inform potential use on animal models, we evaluated the microsomal and plasma stability of the most promising VHL inhibitors (Table 4). The data revealed slow microsomal clearance (0.7–3.1 mL × min–1 × g–1) and high plasma metabolic stability (inhibitors half-life >180 min) with all inhibitors, supporting their use as chemical probes in vivo in animal models.
Overall, the data support 15 as optimal inhibitor, with high binding affinity and cellular potency, good cell membrane permeability, slow dissociation from its target, low toxicity in cells, and excellent stability. On the basis of these results, 15 was elected as a novel chemical probe selectively blocking VHL in the hypoxia-signaling pathway downstream of HIF hydroxylation.41 The compound is available on the “Chemical Probes Portal” (http://www.chemicalprobes.org).59
Conclusions
We report the structure-guided optimization of a new series of ligands targeting the VHL E3 ubiquitin ligase. The best inhibitors have shown affinities in the nanomolar range and have on-target cellular activity. An increase in inhibitor lipophilicity yielded a higher cell membrane passive permeability, which together with slower dissociation rate constants (koff) and increased inhibitor/VBC dissociation half-times (t1/2), clearly led to increased cellular potency. Additionally, the most promising inhibitors have also shown excellent microsomal and plasma stability, supporting their use in vivo with animal models. Our best inhibitors 10 and 15, to our knowledge, are the first inhibitors to reach double-digit nanomolar affinities for binding to VHL, as well as the most potent inhibitors of the VHL:HIF-1α PPI inside cells reported to date. Inhibitor 15 was elected as the final chemical probe (http://www.chemicalprobes.org/vh298). The compound, and its inactive cis epimer, are now available from various commercial vendors.
Our work revealed new VHL inhibitors that can act as probes of the hypoxia signaling pathway, an approach recently validated by us.41 Future optimization of in vivo activity is warranted, which could provide lead compounds with an alternative mode of action as potential therapeutics against diseases where mimicking a hypoxic response has proven to be beneficial. Additionally, the reported novel VHL ligands can be explored for the design of improved VHL-recruiting bifunctional chimeric molecules (PROTACs) to efficiently hijack the VHL E3 ubiquitin ligase to induce intracellular degradation of target proteins.44,46,49 Importantly, we provide an exemplary study for optimizing PPI-targeting E3 ligase ligands via similar strategies, which could inspire current and future efforts to develop inhibitors or PROTACs against other E3 ligases.
Experimental Section
Chemistry
Materials and Methods
Commercially available starting reagents for each reaction were purchased from Sigma-Aldrich, Fluorochem, Apollo Scientific, or Manchester Organics and used without further purification. All reactions were carried out using anhydrous solvents. Analytical thin-layer chromatography (TLC) was performed on precoated TLC plates (layer 0.20 mm silica gel 60 with fluorescent indicator (UV 254: Merck)). The TLC plates were air-dried and revealed under UV lamp (254/365 nm). Flash-column chromatography was performed using prepacked silica gel cartridges (230–400 mesh, 40–63 mm; SiliCycle) using a Teledyne ISCO Combiflash Companion or Combiflash Retrieve using the solvent mixtures stated for each synthesis as mobile phase.
Liquid chromatography–mass spectrometry (LC-MS) analyses were performed with either an Agilent HPLC 1100 series connected to a Bruker Daltonics MicroTOF or an Agilent Technologies 1200 series HPLC connected to an Agilent Technologies 6130 quadrupole spectrometer or a Waters 2795 connected to a Waters ZQ Micromass spectrometer, where all instruments were connected to a diode array detector. All the final compounds used in all the experiments were evaluated after preparative LC-MS separations with a Waters X-bridge C18 column (50 mm × 2.1 mm × 3.5 mm particle size); flow rate, 0.5 mL/min with a mobile phase of water/MeCN + 0.1% CHOOH or water/MeCN + 0.1% NH3; 95/5 water/MeCN was initially held for 0.5 min followed by a linear gradient from 95/5 to 5/95 water/MeCN over 3.5 min which was then held for 2 min. The purity of all the compounds was evaluated using the analytical LC-MS system described before and yield a purity >95%.
High-resolution electrospray measurements were performed on a Bruker Daltonics MicroTOF mass spectrometer. 1H NMR and 13C NMR spectra were recorded on a Bruker Avance II 500 spectrometer (1H at 500.1 MHz, 13C at 125.8 MHz) or on a Bruker DPX-400 cryospectrometer (1H at 400.1 MHz, 13C at 101 MHz). Chemical shifts (δ) are expressed in ppm reported using residual solvent as the internal reference in all cases. Signal splitting patterns are described as singlet (s), doublet (d), triplet (t), multiplet (m), or a combination thereof. Coupling constants (J) are quoted to the nearest 0.1 Hz.
Intermediates 22, 24, and 27, and final inhibitors 1 and 15 were synthesized as described elsewhere.41,55
General Methodology for the Synthesis of VHL Inhibitors 3–11, 13–21, cis-10, and Intermediates 23, 25, and 26
General Method A (Synthesis by Acylation)
A solution of compound 2 (100 mg, 0.19 mmol) in 1:1 TFA:DCM (6 mL) was stirred at room temperature for 30 min. The solvents were evaporated under reduced pressure to give the corresponding deprotected intermediate (TFA salt–22) as a brown oil that was used in the following reactions without further purification (102 mg, 0.19 mmol). To a solution of the deprotected intermediate 22 (102 mg, 0.19 mmol, 1 equiv) in DCM was added triethylamine (57 mg, 79 μL, 0.57 mmol, 3 equiv). After stirring the mixture for 10 min at room temperature, acetic anhydride derivative (1.5 equiv) was added and the resulting mixture was then stirred 2 h at room temperature. The solvents were evaporated under reduced pressure to afford the corresponding crude compound that was purified by flash column chromatography using a gradient of 10% to 70% acetone in heptane to yield the final compounds as solids.
General Method B (Synthesis by HATU Assisted Amide Coupling)
A solution of compound 2 (100 mg, 0.19 mmol) in 1:1 TFA:DCM (6 mL) was stirred at room temperature for 30 min. The mixture was evaporated under reduced pressure to give the corresponding deprotected intermediate (TFA salt–22) as a brown oil without further purification (102 mg, 0.19 mmol). To a solution of the deprotected intermediate 22 (102 mg, 0.19 mmol, 1 equiv) in DMF was added the carboxylic acid derivative (1 equiv). DIPEA (97 mg, 129 μL, 0.75 mmol, 4 equiv) was added dropwise, and the mixture was stirred for 5 min at room temperature. HATU (78 mg, 0.21 mmol, 1.1 equiv) was added, and the mixture was stirred at room temperature for 1 h. Water was added, and the mixture was extracted with ethyl acetate (3×). The combined organic phases were washed with brine (2×), dried over MgSO4, and evaporated to afford the corresponding crude compound that was purified by flash column chromatography using a gradient of 10% to 70% acetone in heptane to yield the final compounds as solids.
(2S,4R)-4-Hydroxy-1-((S)-2-(2-hydroxyacetamido)-3,3-dimethylbutanoyl)-N-(4-(4-methylthiazol-5-yl)benzyl)pyrrolidine-2-carboxamide (3)
Following the general synthesis method B, from intermediate 22 (102 mg, 0.19 mmol, 1 equiv) and 2-hydroxyacetic acid (14 mg, 0.19 mmol, 1 equiv), compound 3 was obtained as a white powder (46 mg, 0.094 mmol, 50%). 1H NMR (CD3OD, 400 MHz): δ 9.32 (s, 1H), 7.52–7.46 (m, 5H), 4.71–4.69 (m, 1H), 4.60–4.54 (m, 2H), 4.50–4.49 (m, 1H), 4.37 (d, 1H, J = 16.0 Hz), 4.06–3.96 (m, 2H), 3.89 (d, 1H, J = 12.0 Hz), 3.80 (dd, 1H, J = 12.0, 4.0 Hz), 2.53 (s, 3H), 2.27–2.21 (m, 1H), 2.11–2.05 (m, 1H), 1.04 (s, 9H). 13C NMR (CD3OD, 101 MHz): δ 174.4, 171.8, 154.3, 141.2, 130.5, 130.4, 130.0, 129.7, 129.1, 71.0, 69.0, 62.4, 60.8, 58.1, 43.7, 39.0, 37.2, 26.9, 14.6. HRMS (ESI) m/z: [M+ + 1] calculated for C24H33N4O5S, 489.2172; observed, 489.2157. HPLC: tR = 2.7 min, k′ = 8.1.
(2S,4R)-1-((S)-3,3-Dimethyl-2-propionamidobutanoyl)-4-hydroxy-N-(4-(4-methylthiazol-5-yl)benzyl)pyrrolidine-2-carboxamide (4)
Following the general synthesis method A, from deprotected intermediate 22 (102 mg, 0.19 mmol, 1 equiv) and propionic anhydride (37 mg, 0.28 mmol, 1.5 equiv), compound 4 was obtained as a white powder (50 mg, 0.10 mmol, 55%). 1H NMR (CDCl3, 500 MHz): δ 8.67 (s, 1H), 7.37–7.32 (m, 5H), 6.15 (d, 1H, J = 8 Hz), 4.69 (t, 1H, J = 10.0 Hz), 4.56–4.50 (m, 3H), 4.33 (dd, 1H, J = 15.0, 5.0 Hz), 4.04 (d, 1H, J = 10 Hz), 3.61 (dd, 1H, J = 10.0, 5.0 Hz), 2.52–2.47 (m, 4H), 2.24–2.18 (m, 2H), 2.14–2.09 (m, 1H), 1.11 (t, J = 10.0 Hz, 3H), 0.93 (s, 9H). 13C NMR (CDCl3, 125 MHz): δ 174.5, 172.0, 170.9, 150.5, 148.6, 138.2, 131.7, 131.1, 129.7, 128.2, 70.1, 58.7, 57.5, 56.9, 43.4, 36.0, 35.2, 29.6, 26.5, 16.2, 9.8. HRMS (ESI) m/z: [M+ + 1] calculated for C25H35N4O4S, 487.2379; observed, 487.2369. HPLC: tR = 4.4 min, k′ = 10.0.
(2S,4R)-1-((S)-2-(3,3-Dimethylbutanamido)-3,3-dimethylbutanoyl)-4-hydroxy-N-(4-(4-methylthiazol-5-yl)benzyl)pyrrolidine-2-carboxamide (5)
Following the general synthesis method B, from intermediate 22 (102 mg, 0.19 mmol, 1 equiv) and 3,3-dimethylbutanoic acid (22 mg, 24 μL, 0.19 mmol, 1 equiv), compound 5 was obtained as a white powder (58 mg, 0.11 mmol, 58%). 1H NMR (CDCl3, 500 MHz): δ 8.68 (s, 1H), 7.39–7.32 (m, 5H), 6.05 (d, 1H, J = 8 Hz), 4.71 (t, 1H, J = 10.0 Hz), 4.57–4.48 (m, 3H), 4.33 (dd, 1H, J = 15.0, 5.0 Hz), 4.11 (d, 1H, J = 10 Hz), 3.58 (dd, 1H, J = 10.0, 5.0 Hz), 2.54–2.49 (m, 4H), 2.14–210 (m, 2H), 2.08–2.02 (m, 2H), 0.99 (s, 9H), 0.93 (s, 9H). 13C NMR (CDCl3, 125 MHz): δ 172.7, 172.1, 170.8, 150.5, 148.6, 138.2, 131.7, 131.1, 129.6, 128.3, 70.1, 58.5, 57.6, 56.8, 50.6, 43.4, 35.8, 34.8, 31.2, 29.9, 26.6, 16.2. HRMS (ESI) m/z: [M+ + 1] calculated for C28H41N4O4S, 529.2848; observed, 529.2844. HPLC: tR = 3.1 min, k′ = 9.4.
(2S,4R)-1-((S)-2-(Cyclopropanecarboxamido)-3,3-dimethylbutanoyl)-4-hydroxy-N-(4-(4-methylthiazol-5-yl)benzyl)pyrrolidine-2-carboxamide (6)
Following the general synthesis method A, from intermediate 22 (102 mg, 0.19 mmol, 1 equiv) and cyclopropanecarboxylic acid anhydride (43 mg, 0.28 mmol, 1.5 equiv), compound 6 was obtained as a white powder (51 mg, 0.10 mmol, 55%). 1H NMR (CDCl3, 500 MHz): δ 8.67 (s, 1H), 7.37–7.33 (m, 5H), 6.36 (d, 1H, J = 8 Hz), 4.70 (t, 1H, J = 10.0 Hz), 4.57–4.49 (m, 3H), 4.33 (dd, 1H, J = 15.0, 5.0 Hz), 4.06 (d, 1H, J = 10 Hz), 3.58 (dd, 1H, J = 10.0, 5.0 Hz), 2.51–2.46 (m, 4H), 2.12–2.08 (m, 1H), 1.40–136 (m, 1H), 0.94 (s, 9H), 0.93–0.85 (m, 2H), 0.79–0.70 (m, 2H). 13C NMR (CDCl3, 125 MHz): δ 174.6, 172.1, 170.9, 150.5, 148.6, 138.2, 131.7, 131.1, 129.7, 128.3, 70.1, 58.6, 57.9, 56.8, 43.4, 36.0, 35.1, 26.5, 16.2, 14.8, 7.8. HRMS (ESI) m/z: [M+ + 1] calculated for C26H35N4O4S, 499.2379; observed, 499.2386. HPLC: tR = 4.5 min, k′ = 8.0.
(2S,4R)-1-((S)-3,3-Dimethyl-2-(2,2,2-trifluoroacetamido)butanoyl)-4-hydroxy-N-(4-(4-methylthiazol-5-yl)benzyl)pyrrolidine-2-carboxamide (7)
Following the general synthesis method A, from deprotected intermediate 22 (102 mg, 0.19 mmol, 1 equiv) and trifluoroacetic anhydride (59 mg, 40 μL, 0.28 mmol, 1.5 equiv), compound 7 was obtained as a white powder (59 mg, 0.11 mmol, 60%). 1H NMR (CDCl3, 500 MHz): δ 8.68 (s, 1H), 7.35 (q, 4H, J = 15.0, 10.0 Hz), 7.07–7.01 (m, 2H), 4.66 (t, 1H, J = 10.0 Hz), 4.60–4.53 (m, 3H), 4.35 (dd, 1H, J = 15.0, 5.0 Hz), 3.84 (d, 1H, J = 10 Hz), 3.71 (dd, 1H, J = 10.0, 5.0 Hz), 2.50–2.46 (m, 4H), 2.14–2.10 (m, 1H), 0.96 (s, 9H). 13C NMR (CDCl3, 125 MHz): δ 170.6, 169.9, 157.2 (JCF = 37.0 Hz), 150.5, 148.6, 138.0, 131.7, 131.3, 129.7, 128.2, 115.9 (JCF = 286.0 Hz), 70.3, 59.2, 58.0, 57.0, 43.4, 36.4, 26.4, 16.2. HRMS (ESI) m/z: [M+ + 1] calculated for C24H30F3N4O4S, 527.1940; observed, 527.1933. HPLC: tR = 4.7 min, k′ = 8.4.
(2S,4R)-1-((S)-3,3-Dimethyl-2-(2,2,2-trichloroacetamido)butanoyl)-4-hydroxy-N-(4-(4-methylthiazol-5-yl)benzyl)pyrrolidine-2-carboxamide (8)
Following the general synthesis method A, from intermediate 22 (102 mg, 0.19 mmol, 1 equiv) and trichloroacetic anhydride (87 mg, 51 μL, 0.28 mmol, 1.5 equiv), compound 8 was obtained as a white powder (70 mg, 0.12 mmol, 65%). 1H NMR (CDCl3, 500 MHz): δ 8.68 (s, 1H), 7.38–7.33 (m, 5H), 7.12 (t, 1H, J = 5.0 Hz), 4.70 (t, 1H, J = 10.0 Hz), 4.62 (s, 1H), 4.55–4.51 (m, 2H), 4.37 (dd, 1H, J = 15.0, 5.0 Hz), 3.87 (d, 1H, J = 10 Hz), 3.72 (dd, 1H, J = 10.0, 5.0 Hz), 2.54–2.49 (m, 4H), 2.15–2.11 (m, 1H), 0.99 (s, 9H). 13C NMR (CDCl3, 125 MHz): δ 170.6, 170.2, 170.0, 150.5, 148.7, 138.0, 131.7, 131.2, 129.7, 128.3, 92.5, 70.4, 59.3, 59.1, 56.9, 43.5, 36.8, 36.3, 26.4, 16.2. HRMS (ESI) m/z: [M+ + 1] calculated for C24H30Cl3N4O4S, 575.1053; observed, 575.1025. HPLC: tR = 5.0 min, k′ = 9.0.
(2S,4R)-1-((S)-2-(2-Fluoro-2-methylpropanamido)-3,3-dimethylbutanoyl)-4-hydroxy-N-(4-(4-methylthiazol-5-yl)benzyl)pyrrolidine-2-carboxamide (9)
Following the general synthesis method B, from intermediate 22 (102 mg, 0.19 mmol, 1 equiv) and 2-fluoroisobutyric acid (20 mg, 18 μL, 0.19 mmol, 1 equiv), compound 9 was obtained as a light-orange powder (39 mg, 0.075 mmol, 40%). 1H NMR (CDCl3, 500 MHz): δ 8.68 (s, 1H), 7.37–7.32 (m, 5H), 6.99 (t, 1H, J = 5.0 Hz), 4.73 (t, 1H, J = 10.0 Hz), 4.58–4.53 (m, 2H), 4.45 (d, 1H, J = 10.0 Hz), 4.33 (dd, 1H, J = 15.0, 5.0 Hz), 4.02 (d, 1H, J = 10 Hz), 3.64 (dd, 1H, J = 10.0, 5.0 Hz), 2.56–2.51 (m, 4H), 2.14–2.09 (m, 1H), 1.53 (m, 6H), 0.94 (s, 9H). 13C NMR (CDCl3, 125 MHz): δ 173.7 (JCF = 21.0 Hz), 171.4, 170.7, 150.5, 148.6, 138.1, 131.7, 131.1, 129.7, 128.3, 96.2 (JCF = 180.0 Hz), 70.3, 58.6, 57.4, 56.7, 43.4, 35.9, 35.4, 26.5, 25.4 (JCF = 24.0 Hz), 24.7 (JCF = 24.0 Hz), 16.2. HRMS (ESI) m/z: [M+ + 1] calculated for C26H36FN4O4S, 519.2441; observed, 519.2447. HPLC: tR = 4.7 min, k′ = 8.4.
(2S,4R)-1-((S)-2-(1-Fluorocyclopropanecarboxamido)-3,3-dimethylbutanoyl)-4-hydroxy-N-(4-(4-methylthiazol-5-yl)benzyl)pyrrolidine-2-carboxamide (10)
Following the general synthesis method B, from intermediate 22 (102 mg, 0.19 mmol, 1 equiv) and 1-fluorocyclopropanecarboxylic acid (20 mg, 0.19 mmol, 1 equiv), compound 10 was obtained as a white powder (51 mg, 0.10 mmol, 53%). 1H NMR (CDCl3, 400 MHz): δ 8.80 (s, 1H), 7.39–7.35 (m, 5H), 7.04–7.02 (m, 1H), 4.73 (t, 1H, J = 8.0 Hz), 4.59–4.52 (m, 3H), 4.33 (dd, 1H, J = 12.0, 4.0 Hz), 4.02 (d, 1H, J = 12 Hz), 3.64 (dd, 1H, J = 12.0, 4.0 Hz), 2.54–2.48 (m, 4H), 2.14–2.08 (m, 1H), 1.35–1.25 (m, 4H), 0.97 (s, 9H). 13C NMR (CDCl3, 101 MHz): δ 171.3, 170.8, 170.5 (JCF = 20.0 Hz), 151.0, 147.6, 138.6, 132.3, 130.5, 129.6, 128.3, 79.5, 70.3, 58.7, 57.7, 56.8, 43.4, 36.1, 35.4, 26.5, 15.8, 13.9 (JCF = 11.0 Hz). HRMS (ESI) m/z: [M+ + 1] calculated for C26H34FN4O4S, 517.2285; observed, 517.2290. HPLC: tR = 3.4 min, k′ = 7.5.
(2S,4S)-1-((S)-2-(1-Fluorocyclopropanecarboxamido)-3,3-dimethylbutanoyl)-4-hydroxy-N-(4-(4-methylthiazol-5-yl)benzyl)pyrrolidine-2-carboxamide (cis-10)
Following the general synthesis method B, from intermediate 27 (300 mg, 0.56 mmol, 1 equiv) and 1-fluorocyclopropanecarboxylic (58 mg, 0.55 mmol, 1 equiv), compound cis-10 was obtained as a white powder (137 mg, 0.26 mmol, 47%). 1H NMR (CDCl3, 400 MHz): δ 8.68 (s, 1H), 7.47 (t, 1H, J = 8.0 Hz), 7.37 (q, 4H, J = 16.0, 8.0 Hz), 6.92 (m, 1H), 5.54 (d, 1H, J = 8.0 Hz), 4.75 (d, 1H, J = 12.0 Hz), 4.65 (dd, 1H, J = 12.0, 4.0 Hz), 4.55 (d, 1H, J = 12.0 Hz), 4.50–4.45 (m, 1H), 4.30 (dd, 1H, J = 16.0, 4.0 Hz), 3.88 (dd, 1H, J = 8.0, 4.0 Hz), 3.82 (d, 1H, J = 12.0 Hz), 2.52 (s, 3H), 2.38 (d, 1H, J = 14.0 Hz), 2.22–2.15 (m, 1H), 1.36–1.26 (m, 4H), 0.95 (s, 9H). 13C NMR (CDCl3, 101 MHz): δ 172.6, 171.8, 169.9 (JCF = 20.0 Hz), 150.5, 148.7, 137.3, 131.6, 131.5, 129.8, 128.4, 79.5, 71.2, 60.1, 58.8, 57.1, 43.7, 35.4, 35.1, 26.4, 16.1, 13.8 (JCF = 10.1 Hz). HRMS (ESI) m/z: [M+ + 1] calculated for C26H34FN4O4S, 517.2285; observed, 517.2278.
(2S,4R)-1-((S)-2-Acetamidopropanoyl)-4-hydroxy-N-(4-(4-methylthiazol-5-yl)benzyl)pyrrolidine-2-carboxamide (11)
Following the general synthesis method A, from the deprotected intermediate of 25 (102 mg, 0.19 mmol, 1 equiv) and acetic anhydride (27 μL, 29 mg, 0.28 mmol, 1.5 equiv), compound 11 was obtained as a white powder (53 mg, 0.12 mmol, 65%). 1H NMR (CD3OD, 400 MHz): δ 8.88 (s, 1H), 7.46–7.41 (m, 4H), 4.65–4.60 (m, 1H), 4.58–4.50 (m, 3H), 4.46–4.39 (m, 2H), (3.78 (d, 2H, J = 4.0 Hz), 2.48 (s, 3H), 2.27–2.21 (m, 1H), 2.11–2.02 (m, 1H), 1.97 (s, 3H), 1.33 (d, 3H, J = 8.0 Hz). 13C NMR (CD3OD, 101 MHz): δ 174.5, 173.8, 172.9, 152.8, 149.1, 140.2, 133.4, 131.6, 130.4, 128.9, 70.1, 60.7, 56.4, 43.6, 39.0, 22.3, 16.9, 15.8. HRMS (ESI) m C21H27N4O4S/z: [M+ + 1] calculated for C21H27N4O4S, 431.1753; observed, 431.1749. HPLC: tR = 2.38 min, k′ = 6.9.
(2S,4R)-1-((S)-3,3-Dimethyl-2-(2-oxopyrrolidin-1-yl)butanoyl)-4-hydroxy-N-(4-(4-methylthiazol-5-yl)benzyl)pyrrolidine-2-carboxamide (12)
To a solution of intermediate 22 (205 mg, 0.38 mmol) and 4-chlorobutanoyl chloride (0.069 mg, 56 μL, 0.49 mmol, 1.3 equiv) in DCM (15 mL), a cold 1N solution of NaOH (6 mL) was added and the resulting mixture was stirred vigorously for 20 min at room temperature. The organic layer was collected and dried over MgSO4 and evaporated to afford the intermediate crude compound. To a solution of the intermediate crude compound in THF cooled to 0 °C was added potassium tert-butoxide (128 mg, 1.14 mmol, 3 equiv), and the mixture was allowed to warm to room temperature and stirred overnight. Water was added, and the mixture was extracted with ethyl acetate (3×). The combined organic phases were dried over MgSO4 and evaporated to afford the corresponding crude compound that was purified by flash column chromatography using gradient elution of 10–70% acetone in heptane to yield the final compound 12 as a white powder (120 mg, 0.24 mmol, 63%). 1H NMR (CDCl3, 500 MHz): δ 8.68 (s, 1H), 7.37–7.32 (m, 5H), 4.74 (s, 1H), 4.70 (t, 1H, J = 10.0 Hz), 4.56–4.51 (m, 2H), 4.38 (dd, 1H, J = 15.0, 5.0 Hz), 4.01 (d, 1H, J = 10 Hz), 3.75–3.64 (m, 2H), 3.58 (dd, 1H, J = 10.0, 5.0 Hz), 2.58–2.51 (m, 4H), 2.41–2.35 (m, 1H), 2.31–2.25 (m, 1H), 2.11–2.0 (m, 1H), 1.99–193 (m, 2H), 1.00 (s, 9H). 13C NMR (CDCl3, 125 MHz): δ 177.0, 171.9, 170.2, 150.5, 148.6, 138.2, 131.7, 131.1, 129.7, 128.2, 70.0, 59.2, 58.3, 56.6, 47.2, 43.4, 35.9, 35.8, 30.7, 27.7, 19.0, 16.2. HRMS (ESI) m/z: [M+ + 1] calculated for C26H35N4O4S, 499.2379; observed, 499.2382. HPLC: tR = 2.9 min, k′ = 8.7.
(2S,4R)-1-((S)-3,3-Dimethyl-2-(N-methylacetamido)butanoyl)-4-hydroxy-N-(4-(4-methylthiazol-5-yl)benzyl)pyrrolidine-2-carboxamide (13)
To a solution of deprotected intermediate 22 (100 mg, 0.23 mmol, 1 equiv) in DMF was added formaldehyde (18 μL, 7 mg, 0.23 mmol, 1 equiv). After stirring the solution for 90 min at room temperature, NaBH(OAc)3 (74 mg, 0.35 mmol, 1.5 equiv) was added and the resulting mixture was stirred for 10 min at room temperature. Water was added, and the mixture was extracted with ethyl acetate (3×). The combined organic phases were dried with MgSO4 and evaporated to afford the crude of the corresponding methylated intermediate (100 mg, 0.22 mmol, 95%) that was used in the following reaction without further purification. Following the general synthesis method A, using the methylated intermediate (100 mg, 0.22 mmol, 1 equiv) and acetic anhydride (32 μL, 34 mg, 0.34 mmol, 1.5 equiv), compound 13 was obtained as a white powder (57 mg, 0.12 mmol, 52%). 1H NMR (CDCl3, 400 MHz): δ 8.67 (s, 1H), 7.38–7.32 (m, 5H), 5.21 (s, 1H), 4.72 (t, 1H, J = 8.0 Hz), 4.58–4.48 (m, 2H), 4.38 (dd, 1H, J = 12.0, 4.0 Hz), 3.96 (d, 1H, J = 8 Hz), 3.70–3.63 (m, 1H), 3.54 (dd, 1H, J = 12.0, 4.0 Hz), 3.15 (s, 3H), 2.66–2.60 (m, 1H), 2.52 (s, 3H), 2.11–2.04 (m, 4H), 1.00 (s, 9H). 13C NMR (CDCl3, 101 MHz): δ 172.8, 170.9, 170.8, 150.4, 148.7, 138.2, 131.7, 131.1, 129.7, 128.2, 70.2, 59.3, 58.3, 56.0, 44.8, 43.4, 36.3, 35.7, 34.5, 27.8, 22.4, 16.2. HRMS (ESI) m/z: [M+ + 1] calculated for C25H35N4O4S, 487.2379; observed, 487.2390. HPLC: tR = 2.9 min, k′ = 8.7.
(2S,4R)-1-((2S,3S)-2-(1-Fluorocyclopropanecarboxamido)-3-hydroxybutanoyl)-4-hydroxy-N-(4-(4-methylthiazol-5-yl)benzyl)pyrrolidine-2-carboxamide (14)
Following the general synthesis method B, from the deprotected intermediate of 26 (100 mg, 0.19 mmol, 1 equiv) and 1-fluorocyclopropanecarboxylic acid (20 mg, 0.19 mmol, 1 equiv), compound 14 was obtained as a white powder (45 mg, 0.090 mmol, 48%). 1H NMR (DMSO-d6, 400 MHz): δ 9.01 (s, 1H), 8.44–8.41 (m, 1H), 7.76 (d, 1H, J = 8.0 Hz), 7.43 (d, 2H, J = 8.0 Hz), 7.35 (d, 2H, J = 8.0 Hz), 4.52–4.49 (m, 1H), 4.46–4.42 (m, 1H), 4.35–4.28 (m, 2H), 4.00–3.94 (m, 1H), 3.74–3.66 (m, 2H), 2.45 (s, 3H), 2.09–2.05 (m, 1H), 1.93–1.87 (m, 1H), 1.36–1.28 (m, 2H), 1.23–1.14 (m, 2H), 1.12 (d, 3H, J = 8.0 Hz). 13C NMR (DMSO-d6, 101 MHz): δ 171.5, 168.7, 168.4 (JCF = 20.0 Hz), 151.6, 147.6, 139.3, 131.2, 129.7, 128.8, 127.5, 77.9 (JCF = 234.0 Hz), 68.8, 66.6, 58.8, 56.9, 55.6, 41.6, 37.9, 19.4, 15.9, 12.8 (JCF = 11.0 Hz). HRMS (ESI) m/z: [M+ + 1] calculated for C24H30FN4O5S, 505.1921; observed, 505.1928. HPLC: tR = 3.2 min, k′ = 7.0.
(2S,4R)-1-((S)-2-(1-Acetylcyclopropanecarboxamido)-3,3-dimethylbutanoyl)-4-hydroxy-N-(4-(4-methylthiazol-5-yl)benzyl)pyrrolidine-2-carboxamide (16)
Following the general synthesis method B, from intermediate 22 (102 mg, 0.19 mmol, 1 equiv) and 1-acetylcyclopropanecarboxylic acid (24 mg, 0.19 mmol, 1 equiv), compound 16 was obtained as a white powder (51 mg, 0.094 mmol, 50%). 1H NMR (CDCl3, 400 MHz): δ 9.75 (d, 1H, J = 8.0 Hz), 8.68 (s, 1H), 7.60–7.58 (m, 1H), 7.35 (q, 4H, J = 16.0, 8.0 Hz), 4.78 (t, 1H, J = 8.0 Hz), 4.57 (dd, 1H, J = 12.0, 4.0 Hz), 4.46 (s, 1H), 4.32–4.25 (m, 2H), 4.17 (d, 1H, J = 8.0 Hz), 3.50 (m, 1H), 2.65–2.58 (m, 1H), 2.52 (s, 3H), 2.12–2.07 (m, 1H), 1.94 (s, 3H), 1.83–1.76 (m, 2H), 1.56–1.49 (m, 2H), 0.98 (s, 9H). 13C NMR (CDCl3, 101 MHz): δ 207.7, 172.4, 170.5, 170.2, 150.4, 148.7, 138.2, 131.7, 131.1, 129.7, 128.4, 70.3, 59.3, 58.0, 56.4, 43.5, 35.5, 34.2, 26.7, 25.0, 19.9, 16.2. HRMS (ESI) m/z: [M+ + 1] calculated for C28H37N4O5S, 541.2484; observed, 541.2485. HPLC: tR = 3.3 min, k′ = 7.2.
Ethyl 1-Aminocyclopropanecarboxylate
Ethanol (2 mL) was added to a round-bottom flask and cooled to 0 °C, then thionyl chloride (706 mg, 430 μL, 5.94 mmol, 2 equiv) was added dropwise and the mixture was stirred for 15 min. 1-Aminocyclopropanecarboxylic (300 mg, 2.97 mmol, 1 equiv) acid was added, and the mixture was refluxed for 2 h. Solvent was removed, and the final compound 5 was obtained as a white powder (363 mg, 2.82 mmol, 95%). 1H NMR (DMSO-d6, 400 MHz): δ 9.11 (s, 2H), 4.16 (q, 2H, J = 12.0, 4.0 Hz), 1.51–1.47 (m, 2H), 1.39–1.36 (m, 2H), 1.21 (t, 3H, J = 8.0 Hz). 13C NMR (DMSO-d6, 101 MHz): δ 170.0, 62.3, 34.0, 14.4, 13.6.
Ethyl 1-Acetamidocyclopropanecarboxylate
Following the general protocol for the synthesis of final inhibitors by acylation, from intermediate 5 (100 mg, 0.77 mmol, 1 equiv) and acetic anhydride (118 mg, 110 μL, 1.15 mmol, 1.5 equiv), compound 6 was obtained as a pale-lime powder (80 mg, 0.47 mmol, 62%). 1H NMR (DMSO-d6, 400 MHz): δ 8.44 (s, 1H), 4.02 (q, 2H, J = 12.0, 4.0 Hz), 1.79 (s, 3H), 1.33–1.30 (m, 2H), 1.14 (t, 3H, J = 8.0 Hz), 0.98–0.95 (m, 2H). 13C NMR (DMSO-d6, 101 MHz): δ 172.1, 170.2, 60.5, 32.8, 22.4, 16.5, 14.1.
1-Acetamidocyclopropanecarboxylic Acid
To a solution of compound 6 (70 mg, 0.41 mmol, 1 equiv) in methanol was added an aqueous solution of NaOH (1N), and the resulting mixture was then heated at 100 °C for 4 h. Methanol was evaporated, and the resulting solution was acidified and extracted with DCM (5×). The combined organic phases were dried over MgSO4 and evaporated to afford the corresponding final compound 7 as a white powder (53 mg, 0.37 mmol, 91%). 1H NMR (DMSO-d6, 400 MHz): δ 12.25 (s, 1H), 8.35 (s, 1H), 1.77 (s, 3H), 1.30–1.28 (m, 2H), 0.94–0.91 (m, 2H). 13C NMR (DMSO-d6, 101 MHz): δ 174.0, 170.1, 32.5, 22.3, 16.3.
(2S,4R)-1-((S)-2-(1-Acetamidocyclopropanecarboxamido)-3,3-dimethylbutanoyl)-4-hydroxy-N-(4-(4-methylthiazol-5-yl)benzyl)pyrrolidine-2-carboxamide (17)
Following the general synthesis method B, from intermediate 22 (102 mg, 0.19 mmol, 1 equiv) and 1-acetamidocyclopropanecarboxylic acid (27 mg, 0.19 mmol, 1 equiv), compound 17 was obtained as a white powder (49 mg, 0.088 mmol, 47%). 1H NMR (CDCl3, 400 MHz): δ 8.68 (s, 1H), 7.41–7.32 (m, 5H), 7.11 (d, 1H, J = 8.0 Hz), 6.35 (s, 1H), 4.74 (t, 1H, J = 8.0 Hz), 4.55–4.50 (m, 2H), 4.40–4.33 (m, 2H), 4.08 (d, 1H, J = 8.0 Hz), 3.57 (m, 1H), 2.57–2.52 (m, 4H), 2.16–2.10 (m, 1H), 2.02 (s, 3H), 1.57–1.52 (m, 1H), 1.46–1.41 (m, 1H), 1.25–1.22 (m, 1H), 1.07–1.01 (m, 1H), 0.93 (s, 9H). 13C NMR (CDCl3, 101 MHz): δ 172.1, 172.0, 171.8, 170.7, 150.4, 148.7, 138.2, 131.7, 131.2, 129.7, 128.3, 70.2, 58.4, 56.8, 43.4, 35.9, 35.5, 35.0, 26.5, 23.4, 17.5, 16.9, 16.2. HRMS (ESI) m/z: [M+ + 1] calculated for C28H38N5O5S, 556.2594; observed, 556.2606. HPLC: tR = 3.3 min, k′ = 7.2.
(2S,4R)-1-((S)-2-(Cyclobutanecarboxamido)-3,3-dimethylbutanoyl)-4-hydroxy-N-(4-(4-methylthiazol-5-yl)benzyl)pyrrolidine-2-carboxamide (18)
Following the general synthesis method B, from intermediate 22 (102 mg, 0.19 mmol, 1 equiv) and cyclobutanecarboxylic acid (19 mg, 18 μL, 0.19 mmol, 1 equiv), compound 18 was obtained as a white powder (58 mg, 0.11 mmol, 58%). 1H NMR (CDCl3, 400 MHz): δ 8.68 (s, 1H), 7.38–7.31 (m, 5H), 5.93 (d, 1H, J = 8.0 Hz), 4.74 (t, 1H, J = 8.0 Hz), 4.60–4.54 (m, 2H), 4.46 (d, 1H, J = 8.0 Hz), 4.33 (dd, 1H, J = 12.0, 4.0 Hz), 4.14 (d, 1H, J = 8.0 Hz), 3.59 (m, 1H), 3.06–2.97 (m, 1H), 2.62–2.56 (m, 1H), 2.52 (s, 3H), 2.25–2.11 (m, 5H), 2.01–1.91 (m, 2H), 0.92 (s, 9H). 13C NMR (CDCl3, 101 MHz): δ 175.9, 172.3, 170.6, 150.5, 138.2, 131.2, 129.7, 128.3, 70.2, 58.4, 57.6, 56.7, 43.4, 39.7, 35.7, 34.8, 26.5, 25.7, 25.2, 18.3, 16.2. HRMS (ESI) m/z: [M+ + 1] calculated for C26H34FN4O4S, 513.2536; observed, 513.2539. HPLC: tR = 3.1, k′ = 9.3.
(2S,4R)-1-((S)-3,3-Dimethyl-2-(oxetane-3-carboxamido)butanoyl)-4-hydroxy-N-(4-(4-methylthiazol-5-yl)benzyl)pyrrolidine-2-carboxamide (19)
Following the general synthesis method B, from intermediate 22 (102 mg, 0.19 mmol, 1 equiv) and oxetane-3-carboxylic acid (19 mg, 0.19 mmol, 1 equiv), compound 19 was obtained as a white powder (51 mg, 0.10 mmol, 53%). 1H NMR (CDCl3, 400 MHz): δ 8.68 (s, 1H), 7.36 (q, 4H, J = 16.0, 8.0 Hz), 7.17 (m, 1H), 6.07 (d, 1H, J = 8.0 Hz), 4.81–4.70 (m, 5H), 4.61–4.53 (m, 3H), 4.33 (dd, 1H, J = 12.0, 4.0 Hz), 4.09 (d, 1H, J = 8.0 Hz), 3.74–3.67 (m, 1H), 3.65–3.61 (m, 1H), 2.63–2.56 (m, 1H), 2.52 (s, 3H), 2.17–2.11 (m, 1H), 0.93 (s, 9H). 13C NMR (CDCl3, 101 MHz): δ 172.1, 171.8, 170.5, 150.5, 138.1, 131.7, 131.2, 129.7, 128.3, 73.3, 70.4, 58.6, 57.8, 56.8, 43.5, 40.3, 35.9, 35.1, 26.5, 16.2. HRMS (ESI) m/z: [M+ + 1] calculated for C26H35N4O5S, 515.2328; observed, 515.2344. HPLC: tR = 2.8 min, k′ = 8.3.
(2S,4R)-1-((S)-3,3-Dimethyl-2-(3-oxocyclobutanecarboxamido)butanoyl)-4-hydroxy-N-(4-(4-methylthiazol-5-yl)benzyl)pyrrolidine-2-carboxamide (20)
Following the general synthesis method B, from intermediate 22 (102 mg, 0.19 mmol, 1 equiv) and 3-oxocyclobutanecarboxylic acid (21 mg, 0.19 mmol, 1 equiv), compound 20 was obtained as a white powder (53 mg, 0.10 mmol, 54%). 1H NMR (CDCl3, 400 MHz): δ 8.68 (s, 1H), 7.36 (q, 4H, J = 16.0, 8.0 Hz), 7.16 (m, 1H), 6.23 (d, 1H, J = 8.0 Hz), 4.72 (t, 1H, J = 8.0 Hz), 4.62–4.53 (m, 3H), 4.33 (dd, 1H, J = 12.0, 4.0 Hz), 4.05 (d, 1H, J = 8.0 Hz), 3.64 (m, 1H), 3.43–3.39 (m, 2H), 3.27–3.13 (m, 2H), 3.08–3.00 (m, 1H), 2.62–2.57 (m, 1H), 2.52 (s, 3H), 2.16–2.11 (m, 1H), 0.94 (s, 9H). 13C NMR (CDCl3, 101 MHz): δ 182.4, 173.8, 171.8, 170.5, 150.5, 148.7, 138.1, 131.7, 131.3, 129.7, 128.3, 70.4, 58.6, 58.1, 56.8, 51.8, 43.5, 35.9, 35.2, 28.7, 26.5, 16.2. HRMS (ESI) m/z: [M+ + 1] calculated for C27H35N4O5S, 527.2328; observed, 527.2332. HPLC: tR = 2.9 min, k′ = 8.7.
(2S,4R)-1-((S)-2-(1-Acetylazetidine-3-carboxamido)-3,3-dimethylbutanoyl)-4-hydroxy-N-(4-(4-methylthiazol-5-yl)benzyl)pyrrolidine-2-carboxamide (21)
Following the general synthesis method A, from the deprotected intermediate of 23 (102 mg, 0.17 mmol, 1 equiv) and acetic anhydride (25 mg, 24 μL, 0.25 mmol, 1.5 equiv), compound 21 was obtained as a white powder (41 mg, 0.075 mmol, 45%). 1H NMR (CDCl3, 400 MHz): δ 8.68 (s, 1H), 7.35 (m, 4H), 7.18 (m, 1H), 6.29 (dd, 1H, J = 60.0, 8.0 Hz), 4.70 (t, 1H, J = 8.0 Hz), 4.56–4.52 (m, 3H), 4.39–4.29 (m, 2H), 4.22–4.14 (m, 2H), 4.10–3.98 (m, 3H), 3.64 (d, 1H, J = 8.0 Hz) 3.31–3.23 (m, 1H), 2.59–2.44 (m, 4H), 2.18–2.11 (m, 1H), 1.83(d, 3H, J = 8.0 Hz), 0.93 (s, 9H). 13C NMR (CDCl3, 101 MHz): δ 171.9, 171.6, 171.0, 170.6, 150.4, 148.6, 138.1, 131.2, 131.7, 129.6, 128.2, 70.2, 58.6, 58.0, 56.9, 52.5, 43.4, 36.5, 36.0, 35.4, 32.7, 26.5, 18.7, 16.2. HRMS (ESI) m/z: [M+ + 1] calculated for C28H38N5O5S, 556.2594; observed, 556.2613. HPLC: tR = 3.3 min, k′ = 7.2.
tert-Butyl 3-(((S)-1-((2S,4R)-4-Hydroxy-2-((4-(4-methylthiazol-5-yl)benzyl)carbamoyl)pyrrolidin-1-yl)-3,3-dimethyl-1-oxobutan-2-yl)carbamoyl)azetidine-1-carboxylate (23)
Following the general synthesis method A, from intermediate 22 (102 mg, 0.19 mmol, 1 equiv) and 1-(tert-butoxycarbonyl)azetidine-3-carboxylic acid (38 mg, 0.19 mmol, 1 equiv), compound 23 was obtained as a lime powder (69 mg, 0.11 mmol, 60%). 1H NMR (CDCl3, 400 MHz): δ 8.67 (s, 1H), 7.35 (q, 4H, J = 16.0, 8.0 Hz), 7.24 (m, 1H), 6.19 (d, 1H, J = 8.0 Hz), 4.70 (t, 1H, J = 8.0 Hz), 4.58–4.52 (m, 3H), 4.34 (dd, 1H, J = 12.0, 4.0 Hz), 4.07–3.97 (m, 4H), 3.63 (m, 1H), 3.22–3.15 (m, 1H), 2.56–2.50 (m, 4H), 2.16–2.11 (m, 4H), 1.41 (s, 9H), 0.93 (s, 9H). 13C NMR (CDCl3, 101 MHz): δ 172.3, 171.6, 170.7, 156.2, 150.4, 148.6, 138.1, 131.2, 129.7, 128.3, 80.0, 70.3, 58.7, 57.9, 56.9, 43.4, 36.1, 35.3, 33.4, 31.0, 28.5, 26.5, 16.2. HRMS (ESI) m/z: [M+ + 1] calculated for C31H44N5O6S, 614.2934; observed, 614.3007.
tert-Butyl((S)-1-((2S,4R)-4-hydroxy-2-((4-(4-methylthiazol-5-yl)benzyl)carbamoyl)pyrrolidin-1-yl)-1-oxopropan-2-yl)carbamate (25)
Following the general synthesis method B, from intermediate 24 (300 mg, 0.72 mmol, 1 equiv) and Boc-l-Ala (132 mg, 0.72 mmol, 1 equiv), compound 25 was obtained as a white solid (267 mg, 0.55 mmol, 78%). 1H NMR (CD3OD, 400 MHz): δ 9.15 (s, 1H), 7.49–7.44 (m, 4H), 4.59 (t, 1H, J = 8.0 Hz), 4.51 (m, 1H), 4.47–4.35 (m, 3H), 3.78 (m, 2H), 2.51 (s, 3H), 2.28–2.22 (m, 1H), 2.08–2.02 (m, 1H), 1.43 (s, 9H), 1.30 (d, 3H, J = 8.0 Hz). 13C NMR (CD3OD, 101 MHz): δ 174.5, 172.0, 153.7, 147.5, 140.8, 130.7, 130.5, 129.0, 80.6, 71.1, 60.8, 56.4, 43.6, 38.9, 28.7, 17.2, 15.1. HRMS (ESI) m/z: [M+ + 1] calculated for C24H33N4O5S, 489.2166; observed, 489.2176.
tert-Butyl 2-(((S)-1-((2S,4R)-4-Hydroxy-2-((4-(4-methylthiazol-5-yl)benzyl)carbamoyl)pyrrolidin-1-yl)-3-methyl-1-oxobutan-2-yl)amino)-2-oxoacetate (26)
Following the general synthesis method B, from intermediate 24 (200 mg, 0.46 mmol, 1 equiv) and Boc-l-threonine (102 mg, 0.46 mmol, 1 equiv), compound 26 was obtained as a white powder (192 mg, 0.37 mmol, 80%). 1H NMR (DMSO-d6, 400 MHz): δ 8.98 (s, 1H), 8.39 (m, 1H), 7.41 (d, 2H, J = 8.0 Hz), 7.34 (d, 2H, J = 8.0 Hz), 6.49 (d, 1H, J = 8.0 Hz), 5.11, (s, 1H), 4.68 (d, 1H, J = 8.0 Hz), 4.43 (t, 1H, J = 8.0 Hz), 4.34–4.29 (m, 3H), 4.17 (t, 1H, J = 8.0 Hz), 3.85–3.80 (m, 1H), 3.73–3.62 (m, 2H), 2.45 (s, 3H), 2.08–2.04 (m, 1H), 1.93–1.87 (m, 1H), 1.38 (s, 9H), 1.05 (d, 3H, J = 8.0 Hz). 13C NMR (DMSO-d6, 101 MHz): δ 171.7, 169.7, 155.3, 151.5, 147.8, 139.3, 131.1, 129.8, 128.8, 127.5, 78.1, 68.8, 66.9, 58.8, 57.9, 55.5, 41.6, 37.8, 30.7, 28.2, 19.3, 16.0. HRMS (ESI) m/z: [M+ + 1] calculated for C25H35N4O6S, 519.2277; observed, 519.2285.
Fluorescence Polarization (FP)
FP competitive binding experiments were performed on a PHERAstar FS (BMG LABTECH) in 384-well plates (Corning 3575), with an excitation wavelength (λ) at 485 nm and emission λ at 520 nm. Each well solution (15 μL) contained 15 nM of VBC protein, 10 nM of FAM-labeled HIF-1α peptide (FAM-DEALAHypYIPMDDDFQLRSF, Kd = 3 nM as measured by a direct FP titration), and decreasing concentrations of compound (14-point serial 2-fold dilutions starting from 50 μM) in 100 mM Bis-tris, 100 mM NaCl, 1 mM DTT, pH 7. Control wells contained VBC and peptide in the absence of compound (maximum signal) and peptide in the absence of protein (background signal). Data were obtained in triplicate, and the percentage of displacement was determined and graphed against log[VHL inhibitors]. Average IC50 values and the standard error of the mean (SEM) were determined for each titration using Prism 6. Dissociation constants Kd were back-calculated from the measured IC50 values using a displacement binding model, as described previously.17
Isothermal Titration Calorimetry (ITC)
ITC experiments were carried in an ITC200 microcalorimeter (GE Healthcare). The compounds were diluted from DMSO stock solution to 300 μM in a buffer of 20 mM Bis-Tris propane, 150 mM NaCl, 1 mM DTT, pH 7. The compounds were titrated against 30 μM VBC complex, equilibrated in the same buffer. The final concentration of DMSO in each experiment was 3% (v/v). The titrations consisted of 20 injections of 2 μL of ligand solution at a rate of 0.5 μL/s at 120 s time intervals. An initial injection of ligand (0.4 μL) was made and discarded during data analysis. All experiments were performed at 25°C while stirring at 750 rpm. The data were fitted to a single-binding-site model using the Microcal LLC ITC200 Origin software provided by the manufacturer to obtain the stoichiometry n, the dissociation constant Kd, and the enthalpy of binding ΔH.
Cell Culture and Cell Treatment
Human cervical carcinoma cell HeLa was obtained from ATCC and propagated in DMEM supplemented with 10% fetal bovine serum (FBS), l-glutamine, and 100 μg/mL of penicillin/streptomycin at 37 °C. HeLa cells were routinely tested for mycoplasma contamination using MycoAlert kit from Lonza. Cells were treated with VHL inhibitors at 50 μM for 2 h in fresh medium, and 1% DMSO was used as vehicle control.
Immunoblotting
Cells were lysed in RIPA buffer (50 mM Tris pH 8, 150 mM NaCl, 1% NP-40, 0.5% sodium deoxycholate, 0.1% SDS, 250 M Na3VO4, 10 mM NaF) and a protease inhibitor cocktail (Roche) per 10 mL of buffer. Proteins were resolved using sodium dodecyl sulfate polyacrylamide gel electrophoresis (SDS–PAGE), transferred onto nitrocellulose membranes, and detected using primary antibodies, with β-actin as loading control. Primary antibodies were used at following dilutions for mammalian cells: anti-HIF-1α (BD Biosciences, 610958, 1:1000), antihydroxy-HIF-1α (Hyp564) (Cell Signaling Technology, no. 3434, 1:1000), and anti-β-actin (Cell Signaling Technology, no. 3700s, 1:10000). Following primary antibody incubation, a goat antimouse (LI-COR, 926-32210, 1:10,000) or donkey antirabbit (LI-COR, 926–32213, 1:10000) conjugated to IRDye 800CW secondary antibody were used for detection on the LI-COR Odyssey (LI-COR, Bad Homburgh, Germany).
Proliferation Assay
First, 1.5 × 10⁵ cells were seeded in six-well plates 1 day prior to treatments with VHL compounds. At treatment times of 0, 24, 48, and 72 h, cells were then trypsinized using 400 μL of trypsin, followed by 600 μL of media. Cells were then counted using hemocytometer.
Colony Formation Assay
First, 500–2000 cells were seeded in a six-well plate 1 day prior to treatments with VHL compounds. After 24 h of treatment, media was then changed and cells were further incubated for 1 week. Cells were washed with PBS twice and stained with 0.005% (w/v) crystal violet in 25% (v/v) methanol for 10 min at room temperature. The staining was washed off with water, and plates were left to dry overnight. Numbers of colonies formed were counted with M-tools suite from OMERO on the scanned plates.
X-ray Crystallography
The VBC ternary complex was purified and crystallized as described previously.17,52 Equal volume solutions of VBC (∼5 mg/mL) and liquor solution were mixed in the hanging-drop vapor diffusion method at 18 °C. The liquor solution contained 0.1 mM sodium cacodylate, pH 6.2–6.6, 16–18% polyethylene glycol 3350, 0.2 M magnesium acetate, and 10 mM DTT. The drop was streaked with seeds of disrupted VBC crystals, and a 2–3 mm layer of Al’s Oil (Hampton Research) was applied on top of the liquor solution to slow the vapor diffusion rate. To obtain the structures of VHL inhibitors bound to VBC, crystals were soaked overnight in a 1 mM solution of inhibitor in 1% DMSO, 4% 2-propanol, and 95% liquor solution. Crystals were screened using an in-house Rigaku M007HF X-ray generator and Saturn 944HG+ CCD detector. X-ray data were collected at 100 K at Diamond Light Source beamline I04–1. Indexing and integration of reflections was performed using XDS with the XDSGUI interface70 and scaling and merging with AIMLESS in CCP4i.71,72 The isomorphous data sets were refined using REFMAC5 (refs (73,74)) and COOT (ref (75)) using a template structure derived from the Protein Data Bank (PDB) entry 1vcb (ref (76)). Ligand structures and restraints were generated using the PRODRG server.77 The MOLPROBITY server was used to validate the geometry and steric clashes in the structures.78 The structures have been deposited in the PDB with accession codes 5NVV, 5NVW, 5NVX, 5NVY, 5NVZ, 5NW0, 5NW1, and 5NW2, and data collection and refinement statistics are presented in Supporting Information, Table 1.
Parallel Artificial Membrane Permeability Assay (PAMPA)
PAMPA was performed using a 96-well precoated BD Gentest PAMPA plate (BD Biosciences, UK). Each well was divided into two chambers: donor and acceptor, separated by a lipid–oil–lipid trilayer constructed in a porous filter. The effective permeability, Pe, of the compound was measured at pH 7.4. Stock solutions (5 mM) of the compound were prepared in DMSO. The compound was then further diluted to 10 μM in PBS, pH 7.4. The final DMSO concentration did not exceed 5% (v/v). The compound dissolved in PBS was then added to the donor side of the membrane and PBS without compound was added to the acceptor side. The PAMPA plate was left at room temperature for 5 h, after which time, an aliquot (100 μL) was removed from both acceptor and donor compartments and mixed with acetonitrile (80 μL) containing an internal standard. The samples were centrifuged (10 min, 5 °C, 3270 g) to sediment precipitated protein and then sealed prior to UPLC-MS/MS analysis using a Quattro Premier XE (Waters Corp, USA). Pe was calculated as shown in the equation below:
where: CA(t) = peak area of compound present in acceptor well at time t = 18000 s, Cequiv = [CD(t) × VD + CA(t) × VA]/(VD + VA), CD(t) = peak area of compound present in donor well at time t = 18000 s, A = filter area, VD = donor-well volume, VA = acceptor-well volume, t = incubation time. Recovery of compound from donor and acceptor wells was calculated, and data was only accepted when recovery exceeded 70%.
CHILogD7.4 Measurement
The CHIlogD (chromatographic hydrophobicity index log D) at pH 7.4 was determined using retention time measurements on a HPLC Dionex system (Thermo Fisher) with a Luna C18 column (Phenomenex). Test samples in DMSO (10 mM) were diluted to a concentration of 0.25 mM using 50:50 acetonitrile:water. Mobile phase A was 10 mM ammonium acetate solution (pH 7.4), and mobile phase B was acetonitrile. HPLC method was as follows: 1 mL/min flow, temperature 20 °C, injection volume 10 μL, gradient 0–10.5 min 100% A, 10.5–14 min 100% B, 14–15 min 100% A. A calibration line was generated using a test mix of compounds (paracetamol, theophylline, caffeine, benzimidiazole, colchicine, carbamazepine, indole, propiophenone, butyrophenone, valerophenone, and heptanophenone). The CHIlogD was calculated as previously described.79,80
Intracellular Drug Concentration.66
Briefly, HeLa cells (1 × 10⁶ cells/2 mL per well, 6-well plate) were incubated with known concentration of compounds (50 μM) for 2 h at 37 °C before being washed and lysed using lysis buffer (20 mM Tris, 150 mM, NaCl, 1% Triton X100, and 1 pill per 10 mL of proteases inhibitors (Roche)). The lysate was resuspended in 2 mL of ice-cold PBS. Resuspended lysate (100 μL) was then subjected to solvent crash in a 1:2 ratio of lysate to acetonitrile containing internal standard 5 ng/mL of donepezil. The concentration was determined with the aid of an appropriate calibration curve and UPLC-MS/MS. The unbound intracellular compound concentration (free fraction) was determined by dialyzing 150 μL of resuspended cell lysate against isotonic phosphate buffer in an equilibrium dialysis equipment. This was also subjected to UPLC-MS/MS.
Surface Plasmon Resonance (SPR)
VHL inhibitors were dissolved in DMSO (1 mM) and then diluted 20-fold in DMSO to achieve a 50 μM final stock concentration. Ligand stock solution was serially diluted 2-fold (five times) in DMSO, and the obtained solutions were then diluted individually in SPR buffer (20 mM HEPES, 150 mM NaCl, 1 mM DDT, 0.005% Tween P20, pH 7.0) to obtain the final 2% (v/v) DMSO concentration series from 1 μM to 31.25 nM (2-fold dilutions) and transferred to a 96-well plate. The experiment was conducted in a Biacore T100 (GE Healthcare, Biacore, Uppsala, Sweden) at 10 and 20 °C, and solutions were injected individually using 60 and 160 s association and dissociation times, respectively. Data were treated using Biacore T100 evaluation software provided by the manufacturer. Reference flow-cell response was subtracted from the sample response with immobilized VBC protein to correct for systematic noise and baseline drift. Data were solvent corrected, and the response from the blank injections was used to double reference the binding data. The data were normalized by molecular weight, and rate constants kon and koff values were obtained using a 1:1 binding model fit.
Intrinsic Clearance (Cli) Experiments
Test compound (0.5 μM) was incubated with female CD1 mouse liver microsomes (Xenotech LLC; 0.5 mg/mL 50 mM potassium phosphate buffer, pH 7.4) and the reaction started with addition of excess NADPH (8 mg/mL 50 mM potassium phosphate buffer, pH 7.4). Immediately, at time zero, then at 3, 6, 9, 15, and 30 min, an aliquot (50 μL) of the incubation mixture was removed and mixed with acetonitrile (100 μL) to stop the reaction. Internal standard was added to all samples, the samples were centrifuged to sediment precipitated protein, and the plates then sealed prior to UPLCMSMS analysis using a Quattro Premier XE (Waters Corporation, USA).
XLfit (IDBS, UK) was used to calculate the exponential decay and consequently the rate constant (k) from the ratio of peak area of test compound to internal standard at each time point. The rate of intrinsic clearance (CLi) of each test compound was then calculated using the following calculation:
where V (mL/mg protein) is the incubation volume/mg protein added and microsomal protein yield is taken as 52.5 mg protein/g liver. Verapamil (0.5 μM) was used as a positive control to confirm acceptable assay performance.
Plasma Stability (Plas Stab) Experiments
Test compound (50 μM) was incubated in prewarmed plasma at 37 °C (that is buffered to pH 7.4 in ratio of 70:30 plasma to buffer). Immediately, at time zero, then at 30, 60, 120, and 180 min, a 50 μL aliquot of the incubation mixture was removed and mixed with 200 μL of acetonitrile containing Donepezil as the internal standard (50 ng/mL) to stop the reaction. The samples were centrifuged to sediment the precipitated protein and the plates then sealed prior to UPLC-MS/MS analysis using a Quattro Premier XE (Waters Corporation, USA).
XLfit (IDBS, UK) was used to calculate the exponential decay and consequently the rate constant (k) from the ratio of peak area of test compound to internal standard at each time point. The half-life was calculated for each test compound from the rate by using the following calculation:
Acknowledgments
This work was supported by the European Research Council ERC-2012-StG-311460 DrugE3CRLs (starting grant to A.C.), the UK Biotechnology and Biological Sciences Research Council BBSRC BB/G023123/2 (David Phillips Fellowship to A.C.), the European Commission PIEF-GA-2012-328030 (Marie-Curie Intra-European Fellowship to C.G.), the Wellcome Trust (Ph.D. Studentship 102398/Z/13/Z to J.F., and strategic awards 100476/Z/12/Z for biophysics and drug discovery and 094090/Z/10/Z for structural biology and X-ray crystallography to B.C.D.D.) and the Fundação para a Ciência e Tecnologia FCT SFRH/BD/101598/2014 (Ph.D. studentship to P.S.). S.R. is funded by a Cancer Research UK Senior fellowship C99667/A12918 with support of a Wellcome Trust strategic award 097945/B/11/Z. We are thankful to Alex Samson for contributions at the early stages of the project, Y. Shishikura for mass spec analysis of the DMPK data, and P. Fyfe for support with in-house X-ray facility. We are thankful to Diamond Light Source for beamtime (BAG proposal MX10071) and beamline support at beamline I04-1.
Glossary
Abbreviations Used
- VHL
von Hippel–Lindau protein
- HIF-1α
hypoxia inducible factor 1α
- HIF-1β
hypoxia inducible factor 1β
- PPI
protein–protein interaction
- UPS
ubiquitin–proteasome system
- PHD
prolyl hydroxylase domain enzymes
- ODD
oxygen-dependent degradation domain
- VBC
VHL:ElonginB:ElonginC protein complex
- LHS
left-hand side
- RHS
right-hand side
- FP
fluorescence polarization
- ITC
isothermal titration calorimetry
- GE
group efficiency
- HA
heavy atom
- LE
ligand efficiency
- LLE
lipophilic ligand efficiency
- t1/2
half-time dissociation
- SPR
surface plasmon resonance
- PAMPA
Parallel Artificial Membrane Permeability Assay
- kon
kinetics association rate constant
- koff
kinetics dissociation rate constant
- CHILogD7.4
chromatographic lipophilicity index Log D7.4
- RIPA buffer
radioimmunoprecipitation assay buffer
Supporting Information Available
The Supporting Information is available free of charge on the ACS Publications website at DOI: 10.1021/acs.jmedchem.7b00675.
Supplementary figures, FP displacement assay data, ITC data, SPR sensograms, crystallographic refinement data, NMR data and Western Blots from HIF-1α stabilization screening in cells. (PDF)
Accession Codes
PDB accession codes of VBC in complex with 3, 6, 10, 11, 16, 17, 18, and 19 are 5NVV, 5NVW, 5NVX, 5NVY, 5NVZ, 5NW0, 5NW1, and 5NW2 respectively. Authors will release the atomic coordinates and experimental data upon article publication.
Author Present Address
§ For C.G.: Facultat de Farmacia i Ciencies de l’Alimentació, Institut de Biomedicina (IBUB), Universitat de Barcelona, Av. Joan XXIII 27-31, 08028 Barcelona, Spain.
Author Contributions
A.C. devised and supervised the project. P.S. and A.C. designed the experiments. P.S. performed the inhibitors design, synthesis, and biophysical characterization. P.S. and M.S.G. performed the crystallization and solved the crystal structures. J.F. performed the cellular experiments. C.G. performed the inhibitors design and cellular experiments. O.E. and L.E. performed the DMPK experiments, under the supervision of K.D.R. S.R. contributed reagents. P.S. and A.C. wrote the manuscript with contributions from other authors.
The authors declare the following competing financial interest(s): A.C. receives research funding support from Boehringer Ingelheim.
Supplementary Material
References
- Varshavsky A. The Early History of the Ubiquitin Field. Protein Sci. 2006, 15 (3), 647–654. 10.1110/ps.052012306. [DOI] [PMC free article] [PubMed] [Google Scholar]
- Pickart C. M. Back to the Future with Ubiquitin. Cell 2004, 116 (2), 181–190. 10.1016/S0092-8674(03)01074-2. [DOI] [PubMed] [Google Scholar]
- Dikic I.; Robertson M. Ubiquitin Ligases and Beyond. BMC Biol. 2012, 10 (1), 22. 10.1186/1741-7007-10-22. [DOI] [PMC free article] [PubMed] [Google Scholar]
- Nalepa G.; Rolfe M.; Harper J. W. Drug Discovery in the Ubiquitin-Proteasome System. Nat. Rev. Drug Discovery 2006, 5 (7), 596–613. 10.1038/nrd2056. [DOI] [PubMed] [Google Scholar]
- Zhang W.; Sidhu S. S. Development of Inhibitors in the Ubiquitination Cascade. FEBS Lett. 2014, 588 (2), 356–367. 10.1016/j.febslet.2013.11.003. [DOI] [PMC free article] [PubMed] [Google Scholar]
- Crawford L. J.; Irvine A. E. Targeting the Ubiquitin Proteasome System in Haematological Malignancies. Blood Rev. 2013, 27 (6), 297–304. 10.1016/j.blre.2013.10.002. [DOI] [PubMed] [Google Scholar]
- Lub S.; Maes K.; Menu E.; De Bruyne E.; Vanderkerken K.; Van Valckenborgh E. Novel Strategies to Target the Ubiquitin Proteasome System in Multiple Myeloma. Oncotarget 2016, 7 (6), 6521–6537. 10.18632/oncotarget.6658. [DOI] [PMC free article] [PubMed] [Google Scholar]
- Chen D.; Frezza M.; Schmitt S.; Kanwar J.; Dou Q. P. Bortezomib as the First Proteasome Inhibitor Anticancer Drug: Current Status and Future Perspectives. Curr. Cancer Drug Targets 2011, 11 (3), 239–253. 10.2174/156800911794519752. [DOI] [PMC free article] [PubMed] [Google Scholar]
- Cohen P.; Tcherpakov M. Will the Ubiquitin System Furnish as Many Drug Targets as Protein Kinases?. Cell 2010, 143 (5), 686–693. 10.1016/j.cell.2010.11.016. [DOI] [PubMed] [Google Scholar]
- Lucas X.; Ciulli A. Recognition of Substrate Degrons by E3 Ubiquitin Ligases and Modulation by Small-Molecule Mimicry Strategies. Curr. Opin. Struct. Biol. 2017, 44, 101–110. 10.1016/j.sbi.2016.12.015. [DOI] [PubMed] [Google Scholar]
- Arkin M. R.; Wells J. A. Small-Molecule Inhibitors of Protein-Protein Interactions: Progressing Towards the Dream. Nat. Rev. Drug Discovery 2004, 3 (4), 301–317. 10.1038/nrd1343. [DOI] [PubMed] [Google Scholar]
- Wells J. A.; McClendon C. L. Reaching for High-Hanging Fruit in Drug Discovery at Protein-Protein Interfaces. Nature 2007, 450 (7172), 1001–1009. 10.1038/nature06526. [DOI] [PubMed] [Google Scholar]
- Zinzalla G.; Thurston D. E. Targeting Protein-Protein Interactions for Therapeutic Intervention: a Challenge for the Future. Future Med. Chem. 2009, 1 (1), 65–93. 10.4155/fmc.09.12. [DOI] [PubMed] [Google Scholar]
- Basse M. J.; Betzi S.; Bourgeas R.; Bouzidi S.; Chetrit B.; Hamon V.; Morelli X.; Roche P. 2P2Idb: a Structural Database Dedicated to Orthosteric Modulation of Protein-Protein Interactions. Nucleic Acids Res. 2013, 41 (D1), D824–D827. 10.1093/nar/gks1002. [DOI] [PMC free article] [PubMed] [Google Scholar]
- Labbé C. M.; Laconde G.; Kuenemann M. A.; Villoutreix B. O.; Sperandio O. iPPI-DB: a Manually Curated and Interactive Database of Small Non-Peptide Inhibitors of Protein-Protein Interactions. Drug Discovery Today 2013, 18 (19–20), 958–968. 10.1016/j.drudis.2013.05.003. [DOI] [PubMed] [Google Scholar]
- Galdeano C. Drugging the Undruggable: Targeting Challenging E3 Ligases for Personalized Medicine. Future Med. Chem. 2017, 9 (4), 347–350. 10.4155/fmc-2017-0009. [DOI] [PubMed] [Google Scholar]
- Van Molle I.; Thomann A.; Buckley D. L.; So E. C.; Lang S.; Crews C. M.; Ciulli A. Dissecting Fragment-Based Lead Discovery at the Von Hippel-Lindau Protein:Hypoxia Inducible Factor 1α Protein-Protein Interface. Chem. Biol. 2012, 19 (10), 1300–1312. 10.1016/j.chembiol.2012.08.015. [DOI] [PMC free article] [PubMed] [Google Scholar]
- Scott D. E.; Ehebauer M. T.; Pukala T.; Marsh M.; Blundell T. L.; Venkitaraman A. R.; Abell C.; Hyvönen M. Using a Fragment-Based Approach to Target Protein-Protein Interactions. ChemBioChem 2013, 14 (3), 332–342. 10.1002/cbic.201200521. [DOI] [PMC free article] [PubMed] [Google Scholar]
- Arkin M. R.; Tang Y.; Wells J. A. Small-Molecule Inhibitors of Protein-Protein Interactions: Progressing Toward the Reality. Chem. Biol. 2014, 21 (9), 1102–1114. 10.1016/j.chembiol.2014.09.001. [DOI] [PMC free article] [PubMed] [Google Scholar]
- Scott D. E.; Bayly A. R.; Abell C.; Skidmore J. Small Molecules, Big Targets: Drug Discovery Faces the Protein-Protein Interaction Challenge. Nat. Rev. Drug Discovery 2016, 15 (8), 533–550. 10.1038/nrd.2016.29. [DOI] [PubMed] [Google Scholar]
- Bulatov E.; Ciulli A. Targeting Cullin-RING E3 Ubiquitin Ligases for Drug Discovery: Structure, Assembly and Small-Molecule Modulation. Biochem. J. 2015, 467 (3), 365–386. 10.1042/BJ20141450. [DOI] [PMC free article] [PubMed] [Google Scholar]
- Manalo D. J.; Rowan A.; Lavoie T.; Natarajan L.; Kelly B. D.; Ye S. Q.; Garcia J. G. N.; Semenza G. L. Transcriptional Regulation of Vascular Endothelial Cell Responses to Hypoxia by HIF-1. Blood 2005, 105 (2), 659–669. 10.1182/blood-2004-07-2958. [DOI] [PubMed] [Google Scholar]
- Semenza G. L.; Wang G. L. A Nuclear Factor Induced by Hypoxia via De Novo Protein Synthesis Binds to the Human Erythropoietin Gene Enhancer at a Site Required for Transcriptional Activation. Mol. Cell. Biol. 1992, 12 (12), 5447–5454. 10.1128/MCB.12.12.5447. [DOI] [PMC free article] [PubMed] [Google Scholar]
- Semenza G. L. Life with Oxygen. Science 2007, 318 (5847), 62–64. 10.1126/science.1147949. [DOI] [PubMed] [Google Scholar]
- Tanimoto K.; Makino Y.; Pereira T.; Poellinger L. Mechanism of Regulation of the Hypoxia-Inducible Factor-1 Alpha by the Von Hippel-Lindau Tumor Suppressor Protein. EMBO J. 2000, 19 (16), 4298–4309. 10.1093/emboj/19.16.4298. [DOI] [PMC free article] [PubMed] [Google Scholar]
- Epstein A. C.; Gleadle J. M.; McNeill L. A.; Hewitson K. S.; O’Rourke J.; Mole D. R.; Mukherji M.; Metzen E.; Wilson M. I.; Dhanda A.; Tian Y. M.; Masson N.; Hamilton D. L.; Jaakkola P.; Barstead R.; Hodgkin J.; Maxwell P. H.; Pugh C. W.; Schofield C. J.; Ratcliffe P. J. C. Elegans EGL-9 and Mammalian Homologs Define a Family of Dioxygenases That Regulate HIF by Prolyl Hydroxylation. Cell 2001, 107 (1), 43–54. 10.1016/S0092-8674(01)00507-4. [DOI] [PubMed] [Google Scholar]
- Jaakkola P.; Mole D. R.; Tian Y. M.; Wilson M. I.; Gielbert J.; Gaskell S. J.; Kriegsheim Av; Hebestreit H. F.; Mukherji M.; Schofield C. J.; Maxwell P. H.; Pugh C. W.; Ratcliffe P. J. Targeting of HIF-Alpha to the Von Hippel-Lindau Ubiquitylation Complex by O2-Regulated Prolyl Hydroxylation. Science 2001, 292 (5516), 468–472. 10.1126/science.1059796. [DOI] [PubMed] [Google Scholar]
- Hon W.-C.; Wilson M. I.; Harlos K.; Claridge T. D. W.; Schofield C. J.; Pugh C. W.; Maxwell P. H.; Ratcliffe P. J.; Stuart D. I.; Jones E. Y. Structural Basis for the Recognition of Hydroxyproline in HIF-1 Alpha by pVHL. Nature 2002, 417 (6892), 975–978. 10.1038/nature00767. [DOI] [PubMed] [Google Scholar]
- Eltzschig H. K.; Bratton D. L.; Colgan S. P. Targeting Hypoxia Signalling for the Treatment of Ischaemic and Inflammatory Diseases. Nat. Rev. Drug Discovery 2014, 13 (11), 852–869. 10.1038/nrd4422. [DOI] [PMC free article] [PubMed] [Google Scholar]
- Semenza G. L. Oxygen Sensing, Homeostasis, and Disease. N. Engl. J. Med. 2011, 365 (6), 537–547. 10.1056/NEJMra1011165. [DOI] [PubMed] [Google Scholar]
- Speer R.; Ratan R. R. Hypoxic Adaptation in the Nervous System: Promise for Novel Therapeutics for Acute and Chronic Neurodegeneration. Adv. Exp. Med. Biol. 2016, 903, 221–243. 10.1007/978-1-4899-7678-9_16. [DOI] [PubMed] [Google Scholar]
- Jain I. H.; Zazzeron L.; Goli R.; Alexa K.; Schatzman-Bone S.; Dhillon H.; Goldberger O.; Peng J.; Shalem O.; Sanjana N. E.; Zhang F.; Goessling W.; Zapol W. M.; Mootha V. K. Hypoxia as a Therapy for Mitochondrial Disease. Science 2016, 352 (6281), 54–61. 10.1126/science.aad9642. [DOI] [PMC free article] [PubMed] [Google Scholar]
- Nangaku M.; Izuhara Y.; Takizawa S.; Yamashita T.; Fujii-Kuriyama Y.; Ohneda O.; Yamamoto M.; van Ypersele de Strihou C.; Hirayama N.; Miyata T. A Novel Class of Prolyl Hydroxylase Inhibitors Induces Angiogenesis and Exerts Organ Protection Against Ischemia. Arterioscler., Thromb., Vasc. Biol. 2007, 27 (12), 2548–2554. 10.1161/ATVBAHA.107.148551. [DOI] [PubMed] [Google Scholar]
- Robinson A.; Keely S.; Karhausen J.; Gerich M. E.; Furuta G. T.; Colgan S. P. Mucosal Protection by Hypoxia-Inducible Factor Prolyl Hydroxylase Inhibition. Gastroenterology 2008, 134 (1), 145–155. 10.1053/j.gastro.2007.09.033. [DOI] [PMC free article] [PubMed] [Google Scholar]
- Esfahani M.; Karimi F.; Afshar S.; Niknazar S.; Sohrabi S.; Najafi R. Prolyl Hydroxylase Inhibitors Act as Agents to Enhance the Efficiency of Cell Therapy. Expert Opin. Biol. Ther. 2015, 15 (12), 1739–1755. 10.1517/14712598.2015.1084281. [DOI] [PubMed] [Google Scholar]
- Provenzano R.; Besarab A.; Sun C. H.; Diamond S. A.; Durham J. H.; Cangiano J. L.; Aiello J. R.; Novak J. E.; Lee T.; Leong R.; Roberts B. K.; Saikali K. G.; Hemmerich S.; Szczech L. A.; Yu K.-H. P.; Neff T. B. Oral Hypoxia-Inducible Factor Prolyl Hydroxylase Inhibitor Roxadustat (FG-4592) for the Treatment of Anemia in Patients with CKD. Clin. J. Am. Soc. Nephrol. 2016, 11 (6), 982–991. 10.2215/CJN.06890615. [DOI] [PMC free article] [PubMed] [Google Scholar]
- Wu K.; Zhou K.; Wang Y.; Zhou Y.; Tian N.; Wu Y.; Chen D.; Zhang D.; Wang X.; Xu H.; Zhang X. Stabilization of HIF-1α by FG-4592 Promotes Functional Recovery and Neural Protection in Experimental Spinal Cord Injury. Brain Res. 2016, 1632, 19–26. 10.1016/j.brainres.2015.12.017. [DOI] [PubMed] [Google Scholar]
- Rabinowitz M. H. Inhibition of Hypoxia-Inducible Factor Prolyl Hydroxylase Domain Oxygen Sensors: Tricking the Body Into Mounting Orchestrated Survival and Repair Responses. J. Med. Chem. 2013, 56 (23), 9369–9402. 10.1021/jm400386j. [DOI] [PubMed] [Google Scholar]
- Karuppagounder S. S.; Ratan R. R. Hypoxia-Inducible Factor Prolyl Hydroxylase Inhibition: Robust New Target or Another Big Bust for Stroke Therapeutics?. J. Cereb. Blood Flow Metab. 2012, 32 (7), 1347–1361. 10.1038/jcbfm.2012.28. [DOI] [PMC free article] [PubMed] [Google Scholar]
- Ortmann B.; Druker J.; Rocha S. Cell Cycle Progression in Response to Oxygen Levels. Cell. Mol. Life Sci. 2014, 71 (18), 3569–3582. 10.1007/s00018-014-1645-9. [DOI] [PMC free article] [PubMed] [Google Scholar]
- Frost J.; Galdeano C.; Soares P.; Gadd M. S.; Grzes K. M.; Ellis L.; Epemolu O.; Shimamura S.; Bantscheff M.; Grandi P.; Read K. D.; Cantrell D. A.; Rocha S.; Ciulli A. Potent and Selective Chemical Probe of Hypoxic Signalling Downstream of HIF-A Hydroxylation via VHL Inhibition. Nat. Commun. 2016, 7, 13312. 10.1038/ncomms13312. [DOI] [PMC free article] [PubMed] [Google Scholar]
- Muchnik E.; Kaplan J. HIF Prolyl Hydroxylase Inhibitors for Anemia. Expert Opin. Invest. Drugs 2011, 20 (5), 645–656. 10.1517/13543784.2011.566861. [DOI] [PubMed] [Google Scholar]
- Ottis P.; Crews C. M. Proteolysis-Targeting Chimeras: Induced Protein Degradation as a Therapeutic Strategy. ACS Chem. Biol. 2017, 12 (4), 892–898. 10.1021/acschembio.6b01068. [DOI] [PubMed] [Google Scholar]
- Zengerle M.; Chan K.-H.; Ciulli A. Selective Small Molecule Induced Degradation of the BET Bromodomain Protein BRD4. ACS Chem. Biol. 2015, 10 (8), 1770–1777. 10.1021/acschembio.5b00216. [DOI] [PMC free article] [PubMed] [Google Scholar]
- Raina K.; Lu J.; Qian Y.; Altieri M.; Gordon D.; Rossi A. M. K.; Wang J.; Chen X.; Dong H.; Siu K.; Winkler J. D.; Crew A. P.; Crews C. M.; Coleman K. G. PROTAC-Induced BET Protein Degradation as a Therapy for Castration-Resistant Prostate Cancer. Proc. Natl. Acad. Sci. U. S. A. 2016, 113 (26), 7124–7129. 10.1073/pnas.1521738113. [DOI] [PMC free article] [PubMed] [Google Scholar]
- Gadd M. S.; Testa A.; Lucas X.; Chan K.-H.; Chen W.; Lamont D. J.; Zengerle M.; Ciulli A. Structural Basis of PROTAC Cooperative Recognition for Selective Protein Degradation. Nat. Chem. Biol. 2017, 13 (5), 514–521. 10.1038/nchembio.2329. [DOI] [PMC free article] [PubMed] [Google Scholar]
- Wurz R. P.; Dellamaggiore K.; Dou H.; Javier N.; Lo M.-C.; McCarter J. D.; Mohl D.; Sastri C.; Lipford J. R.; Cee V. J. A “Click Chemistry Platform” for the Rapid Synthesis of Bispecific Molecules for Inducing Protein Degradation. J. Med. Chem. 2017, 10.1021/acs.jmedchem.6b01781. [DOI] [PubMed] [Google Scholar]
- Chan K.-H.; Zengerle M.; Testa A.; Ciulli A. Impact of Target Warhead and Linkage Vector on Inducing Protein Degradation: Comparison of Bromodomain and Extra-Terminal (BET) Degraders Derived From Triazolodiazepine (JQ1) and Tetrahydroquinoline (I-BET726) BET Inhibitor Scaffolds. J. Med. Chem. 2017, 10.1021/acs.jmedchem.6b01912. [DOI] [PMC free article] [PubMed] [Google Scholar]
- Bondeson D. P.; Mares A.; Smith I. E. D.; Ko E.; Campos S.; Miah A. H.; Mulholland K. E.; Routly N.; Buckley D. L.; Gustafson J. L.; Zinn N.; Grandi P.; Shimamura S.; Bergamini G.; Faelth-Savitski M.; Bantscheff M.; Cox C.; Gordon D. A.; Willard R. R.; Flanagan J. J.; Casillas L. N.; Votta B. J.; den Besten W.; Famm K.; Kruidenier L.; Carter P. S.; Harling J. D.; Churcher I.; Crews C. M. Catalytic in Vivo Protein Knockdown by Small-Molecule PROTACs. Nat. Chem. Biol. 2015, 11 (8), 611–617. 10.1038/nchembio.1858. [DOI] [PMC free article] [PubMed] [Google Scholar]
- Lai A. C.; Toure M.; Hellerschmied D.; Salami J.; Jaime-Figueroa S.; Ko E.; Hines J.; Crews C. M. Modular PROTAC Design for the Degradation of Oncogenic BCR-ABL. Angew. Chem., Int. Ed. 2016, 55 (2), 807–810. 10.1002/anie.201507634. [DOI] [PMC free article] [PubMed] [Google Scholar]
- Min J.-H.; Yang H.; Ivan M.; Gertler F.; Kaelin W. G. Jr.; Pavletich N. P. Structure of an HIF-1alpha -pVHL Complex: Hydroxyproline Recognition in Signaling. Science 2002, 296 (5574), 1886–1889. 10.1126/science.1073440. [DOI] [PubMed] [Google Scholar]
- Buckley D. L.; Van Molle I.; Gareiss P. C.; Tae H. S.; Michel J.; Noblin D. J.; Jorgensen W. L.; Ciulli A.; Crews C. M. Targeting the Von Hippel-Lindau E3 Ubiquitin Ligase Using Small Molecules to Disrupt the VHL/HIF-1α Interaction. J. Am. Chem. Soc. 2012, 134 (10), 4465–4468. 10.1021/ja209924v. [DOI] [PMC free article] [PubMed] [Google Scholar]
- Buckley D. L.; Gustafson J. L.; Van Molle I.; Roth A. G.; Tae H. S.; Gareiss P. C.; Jorgensen W. L.; Ciulli A.; Crews C. M. Small-Molecule Inhibitors of the Interaction Between the E3 Ligase VHL and HIF1α. Angew. Chem., Int. Ed. 2012, 51 (46), 11463–11467. 10.1002/anie.201206231. [DOI] [PMC free article] [PubMed] [Google Scholar]
- Dias D. M.; Van Molle I.; Baud M. G. J.; Galdeano C.; Geraldes C. F. G. C.; Ciulli A. Is NMR Fragment Screening Fine-Tuned to Assess Druggability of Protein-Protein Interactions?. ACS Med. Chem. Lett. 2014, 5 (1), 23–28. 10.1021/ml400296c. [DOI] [PMC free article] [PubMed] [Google Scholar]
- Galdeano C.; Gadd M. S.; Soares P.; Scaffidi S.; Van Molle I.; Birced I.; Hewitt S.; Dias D. M.; Ciulli A. Structure-Guided Design and Optimization of Small Molecules Targeting the Protein-Protein Interaction Between the Von Hippel-Lindau (VHL) E3 Ubiquitin Ligase and the Hypoxia Inducible Factor (HIF) Alpha Subunit with in Vitro Nanomolar Affinities. J. Med. Chem. 2014, 57 (20), 8657–8663. 10.1021/jm5011258. [DOI] [PMC free article] [PubMed] [Google Scholar]
- Banks J. W.; Batsanov A. S.; Howard J. A. K.; O’Hagan D.; Rzepa H. S.; Martin-Santamaria S. The Preferred Conformation of A-Fluoroamides. J. Chem. Soc., Perkin Trans. 2 1999, (11), 2409–2411. 10.1039/a907452j. [DOI] [Google Scholar]
- Briggs C.; O’Hagan D.; Howard J.; Yufit D. S. The C-F Bond as a Tool in the Conformational Control of Amides. J. Fluorine Chem. 2003, 119 (1), 9–13. 10.1016/S0022-1139(02)00243-9. [DOI] [Google Scholar]
- Rafi S. B.; Hearn B. R.; Vedantham P.; Jacobson M. P.; Renslo A. R. Predicting and Improving the Membrane Permeability of Peptidic Small Molecules. J. Med. Chem. 2012, 55 (7), 3163–3169. 10.1021/jm201634q. [DOI] [PMC free article] [PubMed] [Google Scholar]
- Arrowsmith C. H.; Audia J. E.; Austin C.; Baell J.; Bennett J.; Blagg J.; Bountra C.; Brennan P. E.; Brown P. J.; Bunnage M. E.; Buser-Doepner C.; Campbell R. M.; Carter A. J.; Cohen P.; Copeland R. A.; Cravatt B.; Dahlin J. L.; Dhanak D.; Edwards A. M.; Frederiksen M.; Frye S. V.; Gray N.; Grimshaw C. E.; Hepworth D.; Howe T.; Huber K. V. M.; Jin J.; Knapp S.; Kotz J. D.; Kruger R. G.; Lowe D.; Mader M. M.; Marsden B.; Mueller-Fahrnow A.; Müller S.; O’Hagan R. C.; Overington J. P.; Owen D. R.; Rosenberg S. H.; Roth B.; Ross R.; Schapira M.; Schreiber S. L.; Shoichet B.; Sundstrom M.; Superti-Furga G.; Taunton J.; Toledo-Sherman L.; Walpole C.; Walters M. A.; Willson T. M.; Workman P.; Young R. N.; Zuercher W. J. The Promise and Peril of Chemical Probes. Nat. Chem. Biol. 2015, 11 (8), 536–541. 10.1038/nchembio.1867. [DOI] [PMC free article] [PubMed] [Google Scholar]
- Kuhn B.; Mohr P.; Stahl M. Intramolecular Hydrogen Bonding in Medicinal Chemistry. J. Med. Chem. 2010, 53 (6), 2601–2611. 10.1021/jm100087s. [DOI] [PubMed] [Google Scholar]
- Rezai T.; Bock J. E.; Zhou M. V.; Kalyanaraman C.; Lokey R. S.; Jacobson M. P. Conformational Flexibility, Internal Hydrogen Bonding, and Passive Membrane Permeability: Successful in Silico Prediction of the Relative Permeabilities of Cyclic Peptides. J. Am. Chem. Soc. 2006, 128 (43), 14073–14080. 10.1021/ja063076p. [DOI] [PubMed] [Google Scholar]
- Rezai T.; Yu B.; Millhauser G. L.; Jacobson M. P.; Lokey R. S. Testing the Conformational Hypothesis of Passive Membrane Permeability Using Synthetic Cyclic Peptide Diastereomers. J. Am. Chem. Soc. 2006, 128 (8), 2510–2511. 10.1021/ja0563455. [DOI] [PubMed] [Google Scholar]
- Liu X.; Testa B.; Fahr A. Lipophilicity and Its Relationship with Passive Drug Permeation. Pharm. Res. 2011, 28 (5), 962–977. 10.1007/s11095-010-0303-7. [DOI] [PubMed] [Google Scholar]
- Veber D. F.; Johnson S. R.; Cheng H.-Y.; Smith B. R.; Ward K. W.; Kopple K. D. Molecular Properties That Influence the Oral Bioavailability of Drug Candidates. J. Med. Chem. 2002, 45 (12), 2615–2623. 10.1021/jm020017n. [DOI] [PubMed] [Google Scholar]
- Hopkins A. L.; Keserü G. M.; Leeson P. D.; Rees D. C.; Reynolds C. H. The Role of Ligand Efficiency Metrics in Drug Discovery. Nat. Rev. Drug Discovery 2014, 13 (2), 105–121. 10.1038/nrd4163. [DOI] [PubMed] [Google Scholar]
- Mateus A.; Matsson P.; Artursson P. Rapid Measurement of Intracellular Unbound Drug Concentrations. Mol. Pharmaceutics 2013, 10 (6), 2467–2478. 10.1021/mp4000822. [DOI] [PubMed] [Google Scholar]
- Yang N. J.; Hinner M. J.. Getting Across the Cell Membrane: An Overview for Small Molecules, Peptides, and Proteins. Site-Specific Protein Labeling; Methods in Molecular Biology; Springer: New York, 2015; Vol. 1266, pp 29–53 10.1007/978-1-4939-2272-7_3. [DOI] [PMC free article] [PubMed] [Google Scholar]
- Copeland R. A.; Pompliano D. L.; Meek T. D. Drug-Target Residence Time and Its Implications for Lead Optimization. Nat. Rev. Drug Discovery 2006, 5 (9), 730–739. 10.1038/nrd2082. [DOI] [PubMed] [Google Scholar]
- Copeland R. A. The Drug-Target Residence Time Model: a 10-Year Retrospective. Nat. Rev. Drug Discovery 2016, 15 (2), 87–95. 10.1038/nrd.2015.18. [DOI] [PubMed] [Google Scholar]
- Kabsch W. XDS. Acta Crystallogr., Sect. D: Biol. Crystallogr. 2010, 66 (2), 125–132. 10.1107/S0907444909047337. [DOI] [PMC free article] [PubMed] [Google Scholar]
- Evans P. R.; Murshudov G. N. How Good Are My Data and What Is the Resolution?. Acta Crystallogr., Sect. D: Biol. Crystallogr. 2013, 69 (7), 1204–1214. 10.1107/S0907444913000061. [DOI] [PMC free article] [PubMed] [Google Scholar]
- Winn M. D.; Ballard C. C.; Cowtan K. D.; Dodson E. J.; Emsley P.; Evans P. R.; Keegan R. M.; Krissinel E. B.; Leslie A. G. W.; McCoy A.; McNicholas S. J.; Murshudov G. N.; Pannu N. S.; Potterton E. A.; Powell H. R.; Read R. J.; Vagin A.; Wilson K. S. Overview of the CCP4 Suite and Current Developments. Acta Crystallogr., Sect. D: Biol. Crystallogr. 2011, 67 (4), 235–242. 10.1107/S0907444910045749. [DOI] [PMC free article] [PubMed] [Google Scholar]
- Murshudov G. N.; Skubák P.; Lebedev A. A.; Pannu N. S.; Steiner R. A.; Nicholls R. A.; Winn M. D.; Long F.; Vagin A. A. REFMAC5 for the Refinement of Macromolecular Crystal Structures. Acta Crystallogr., Sect. D: Biol. Crystallogr. 2011, 67 (4), 355–367. 10.1107/S0907444911001314. [DOI] [PMC free article] [PubMed] [Google Scholar]
- Murshudov G. N.; Vagin A. A.; Dodson E. J. Refinement of Macromolecular Structures by the Maximum-Likelihood Method. Acta Crystallogr., Sect. D: Biol. Crystallogr. 1997, 53 (3), 240–255. 10.1107/S0907444996012255. [DOI] [PubMed] [Google Scholar]
- Emsley P.; Lohkamp B.; Scott W. G.; Cowtan K. Features and Development of Coot. Acta Crystallogr., Sect. D: Biol. Crystallogr. 2010, 66 (4), 486–501. 10.1107/S0907444910007493. [DOI] [PMC free article] [PubMed] [Google Scholar]
- Stebbins C. E.; Kaelin W. G.; Pavletich N. P. Structure of the VHL-ElonginC-ElonginB Complex: Implications for VHL Tumor Suppressor Function. Science 1999, 284 (5413), 455–461. 10.1126/science.284.5413.455. [DOI] [PubMed] [Google Scholar]
- Schüttelkopf A. W.; van Aalten D. M. F. PRODRG: a Tool for High-Throughput Crystallography of Protein-Ligand Complexes. Acta Crystallogr., Sect. D: Biol. Crystallogr. 2004, 60 (8), 1355–1363. 10.1107/S0907444904011679. [DOI] [PubMed] [Google Scholar]
- Chen V. B.; Arendall W. B.; Headd J. J.; Keedy D. A.; Immormino R. M.; Kapral G. J.; Murray L. W.; Richardson J. S.; Richardson D. C. MolProbity: All-Atom Structure Validation for Macromolecular Crystallography. Acta Crystallogr., Sect. D: Biol. Crystallogr. 2010, 66 (1), 12–21. 10.1107/S0907444909042073. [DOI] [PMC free article] [PubMed] [Google Scholar]
- Camurri G.; Zaramella A. High-Throughput Liquid Chromatography/Mass Spectrometry Method for the Determination of the Chromatographic Hydrophobicity Index. Anal. Chem. 2001, 73 (15), 3716–3722. 10.1021/ac001388j. [DOI] [PubMed] [Google Scholar]
- Valko K.; Nunhuck S.; Bevan C.; Abraham M. H.; Reynolds D. P. Fast Gradient HPLC Method to Determine Compounds Binding to Human Serum Albumin. Relationships with Octanol/Water and Immobilized Artificial Membrane Lipophilicity. J. Pharm. Sci. 2003, 92 (11), 2236–2248. 10.1002/jps.10494. [DOI] [PubMed] [Google Scholar]
Associated Data
This section collects any data citations, data availability statements, or supplementary materials included in this article.