
Figure 1.
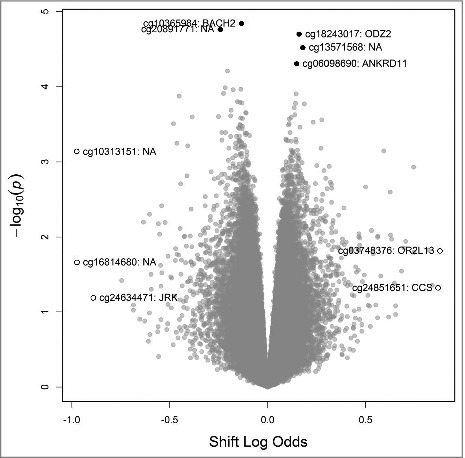
Volcano plot of results from genome-wide analysis of DNA methylation and shift work status, highlighting the 5 loci with the smallest unadjusted P values (•) and the 5 loci with largest absolute differences in effect size (○).
Official websites use .gov
A
.gov website belongs to an official
government organization in the United States.
Secure .gov websites use HTTPS
A lock (
) or https:// means you've safely
connected to the .gov website. Share sensitive
information only on official, secure websites.
Volcano plot of results from genome-wide analysis of DNA methylation and shift work status, highlighting the 5 loci with the smallest unadjusted P values (•) and the 5 loci with largest absolute differences in effect size (○).