

ABSTRACT
To address the limitations in current classic twin/family research on the genetic and/or environmental causes of human methylomic variation, we measured blood DNA methylation for 479 women (mean age 56 years) including 66 monozygotic (MZ), 66 dizygotic (DZ) twin pairs and 215 sisters of twins, and 11 random technical duplicates using the HumanMethylation450 array. For each methylation site, we estimated the correlation for pairs of duplicates, MZ twins, DZ twins, and siblings, fitted variance component models by assuming the variation is explained by genetic factors, by shared and individual environmental factors, and by independent measurement error, and assessed the best fitting model. We found that the average (standard deviation) correlations for duplicate, MZ, DZ, and sibling pairs were 0.10 (0.35), 0.07 (0.21), -0.01 (0.14) and -0.04 (0.07). At the genome-wide significance level of 10−7, 93.3% of sites had no familial correlation, and 5.6%, 0.1%, and 0.2% of sites were correlated for MZ, DZ, and sibling pairs. For 86.4%, 6.9%, and 7.1% of sites, the best fitting model included measurement error only, a genetic component, and at least one environmental component. For the 13.6% of sites influenced by genetic and/or environmental factors, the average proportion of variance explained by environmental factors was greater than that explained by genetic factors (0.41 vs. 0.37, P value <10−15). Our results are consistent with, for middle-aged woman, blood methylomic variation measured by the HumanMethylation450 array being largely explained by measurement error, and more influenced by environmental factors than by genetic factors.
KEYWORDS: DNA methylation, HumanMethylation450 array, familial aggregation, twin study, heritability
Introduction
DNA methylation, mainly occurring at cytosine-guanine dinucleotide (CpG) sites by conversion of a cytosine to a 5-methylcytosine, modifies gene expression without altering the underlying DNA sequence. DNA methylation has been proposed to play a critical role in the etiology of complex traits and diseases.1 Studies have reported associations of methylation with several diseases and traits, such as type 2 diabetes,2 body mass index,3 smoking,4 and maternal plasma folate level.5
Using technology for quantifying genome-wide DNA methylation, several classic twin/family studies including twins or family members only have investigated the influences of genetic and/or environmental factors on human methylomic variation. These studies measured methylation in various tissues for individuals of different ages using different assays: three types of tissues for newborns using the Infinium HumanMethylation27 (HM27) BeadChip array;6 blood for adolescents7,8 and young adults9 using the Infinium HumanMethylation450 (HM450) BeadChip array; and blood and adipose tissue for middle-aged individuals using the HM27 array10 and HM450 array,11 respectively. By assuming that the same classic twin model applies to all methylation sites, these studies found that the average of the estimates of heritability across all methylation sites, defined as the ratio between additive genetic variance and total variance, was 5–20%. However, the assumption that the same model applies to all methylation sites was not tested and, therefore, it remains to be known if variation at different methylation sites has different causes.
Compared with their non-twin relatives, twins might be more similar in methylation given that they share the uterus before birth. The uterine environment is suggested to impact the methylome.6 Twins also share a higher proportion of postnatal environmental factors. Such special similarity cannot be investigated by studying twins alone. A twins and siblings design is ideal to study this issue because it allows fitting a twin-specific variance component. Additionally, compared with the design including twins' parents, the twins and siblings design can minimize age and birth cohort effects, given that siblings are of similar ages to, and of the same temporal generation as, the twins. This design can also avoid bias caused by any transgenerational inheritance in DNA methylation.7,8
The median measurement repeatability [assessed by the intra-class correlation (ICC) within technical duplicate pairs] across probes of the HM450 array has been reported to be 0.2–0.4,12–14 which suggests that substantial measurement error exists. Such measurement error can influence the estimation of genetic and/or environmental effects on methylomic variation. This issue cannot be fully investigated by studying twins alone, given that the effects of individual environment and independent measurement error are combined in the E component of variance under the classic twin model. Technical duplicate pairs are required to investigate.
From reviewing the literature, we have found that current classic twin/family research on genetic and/or environmental causes of human methylomic variation measured by the HM450 array has been limited in several ways: i) No large study has investigated blood methylome for middle-aged individuals; ii) A single classic twin model has been applied to all methylation sites without allowing for variation at different sites having different causes; iii) No study has investigated twin-specific aggregation; iv) No study has investigated the influences of measurement error.
To address these limitations, we conducted a study including middle-aged twins, sisters of twins, and technical duplicates to investigate the influences of genes, environment, and measurement error on variation in blood methylation measured by the HM450 array.
Results
Familial correlation
The averages (standard deviation [SD]) of the correlation for duplicate pairs (rDUP), correlation for monozygotic twin pairs (rMZ), correlation for dizygotic twin pairs (rDZ), and correlation for sibling pairs (rSIB) were 0.10 (0.35), 0.07 (0.21), -0.01 (0.14), and -0.04 (0.07), respectively, across all methylation sites (Table 1), showing that both duplicate and MZ pairs were weakly correlated overall, but neither DZ nor sibling pairs were correlated overall. There were more positive estimates of rDUP and rMZ and more negative estimates of rDZ and rSIB than would be expected by chance (Supplementary Figure 1). We observed many DNA methylation sites for which rMZ > 2rDZ, rDZ > rSIB, and rMZ > 2rSIB (Fig. 1) among the 55,222 methylation sites with positive rMZ, rDZ, and rSIB. 1,040 (1.9%), 465 (0.8%), and 19,725 (35.7%) sites had rMZ > 2rDZ, rDZ > rSIB, and rMZ > 2rSIB, respectively, at 5% Benjamini-Hochberg false discovery rate (FDR),15 and 7,099 (12.9%), 5,880 (10.6%), and 25,262 (45.7%) sites, respectively, at nominal P value <0.05—larger than the expectation by chance (all P values <2.2 × 10⁻¹⁶ from the binomial test). These results are different from the expectation based on the previously applied classic twin model in which familial aggregation is assumed to be solely due to additive genetic factors.
Table 1.
Summary of the correlation and variance component estimates.
| Correlation/component | Min | Median | Mean | Max | |
|---|---|---|---|---|---|
| Correlation | |||||
| rDUP | −0.97 | 0.12 | 0.10 | 0.97 | |
| rMZ | −0.62 | 0.04 | 0.07 | 0.98 | |
| rDZ | −0.57 | −0.02 | −0.01 | 0.76 | |
| rSIB | −0.23 | −0.05 | −0.04 | 0.45 | |
| Component from the ACtCfEM model | |||||
| σA2 | 0 | 0 | 0.03 | 0.90 | |
| σCt2 | 0 | 0 | 0.002 | 0.45 | |
| σCf2 | 0 | 0 | 0.04 | 0.54 | |
| σE2 | 0 | 0.04 | 0.15 | 0.97 | |
| σM2 | 0.02 | 0.84 | 0.77 | 1.00 | |
| Component from the best fitting model | |||||
| σA2 | 0.17 | 0.33 | 0.37 | 0.91 | |
| σCt2 | 0.16 | 0.27 | 0.28 | 0.65 | |
| σCf2 | 0.10 | 0.15 | 0.16 | 0.45 | |
| σE2 | 0.19 | 0.74 | 0.72 | 0.97 |
rMZ, correlation for monozygotic twin pairs; rDZ, correlation for dizygotic twin pairs; rSIB, correlation for sibling pairs; σA2, effects of additive genetic factors; σCt2, effects of environmental factors shared by twins alone; σCf2, effects of environmental factors shared by all family members; σE2, effects of individual environmental factors; σM2, effects of independent measurement error.
Figure 1.
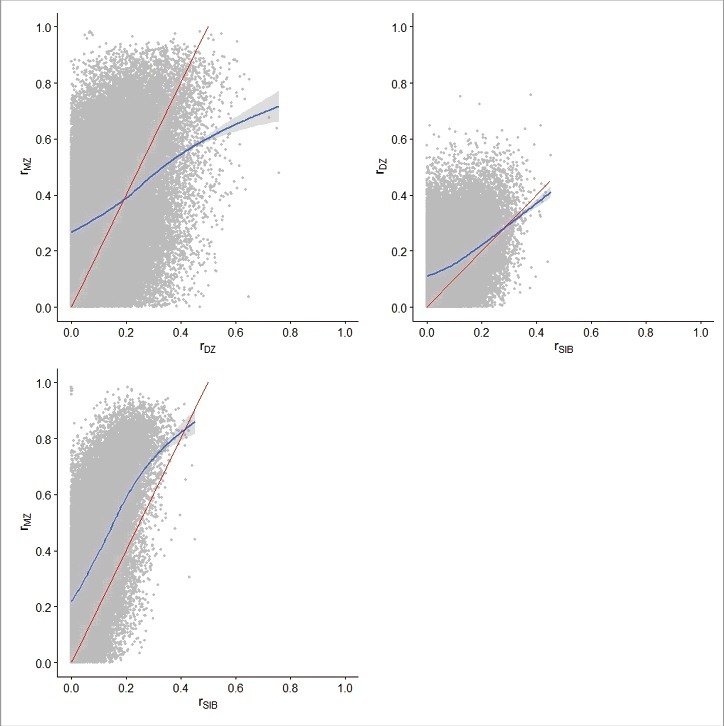
Scatterplots of rMZ, rDZ and rSIB for the methylation sites with positive estimates only The blue line is the locally weighted scatterplot smoothing (LOWESS) line with confidence interval and the red straight line is the expected line if the familial aggregation was solely due to additive genetic factors.
At the genome-wide significance level of 10−7, there was no evidence of correlation for MZ, DZ, or siblings pairs at 383,786 (93.3%) methylation sites. The numbers (proportions) of methylation sites with significant and positive rMZ, rDZ, and rSIB were 22,865 (5.6%), 501 (0.1%), and 784 (0.2%), respectively. The estimates of rMZ, rDZ, and rSIB were all significant and positive for 64 (0.02%) methylation sites (Supplementary Figure 2). The correlations for each methylation site can be found in the supplementary data.
The distributions of familial correlation (rMZ, rDZ, and rSIB) differed by measurement repeatability, methylation level, and variance of the site. Methylation sites with high repeatability had higher familial correlations. That is, the higher the rDUP, the higher the familial correlations. In particular, sites with rDUP >0.8 had the highest familial correlations (Supplementary Figure 3). Intermediate methylated sites had higher familial correlations, and there was a reversed U-shaped relationship between familial correlation and methylation level; sites with mean methylation level ranging 0.4–0.6 had the highest familial correlations (Supplementary Figure 4). In addition, hypervariable sites had higher familial correlations. The higher the variance of the site, the higher the familial correlations, and sites with SD>0.09 had the highest familial correlations (Supplementary Figure 4).
Methylation sites with significant and positive familial correlations had different distributions across the genome (Supplementary Table 1). Overall, these methylation sites were enriched in non-CGI region and depleted in gene promoter, 200 bp upstream of the transcription start site (TSS200), and CpG island regions.
Variance component model
From fitting the full model of ACtCfEM (Α, effects of additive genetic factors; Ct, effects of environmental factors shared by twins alone; Cf, effects of environmental factors shared by all family members; E, effects of individual environmental factors; and M, effects of independent measurement error), the averages (SD) of effects of additive genetic factors (σA2), effects of environmental factors shared by twins alone (σCt2), effects of environmental factors shared by all family members (σCf2), effects of individual environmental factors (σE2), and effects of independent measurement error (σM2) were 0.03 (0.09), 0.04 (0.07), 0.002 (0.01), 0.15 (0.20), and 0.77 (0.23), respectively, across all methylation sites (Table 1; Supplementary Figure 5), which shows that the overall influences of shared genes and environment were small. For 332,984 (80.9%), 227,948 (55.4%), 387,290 (94.1%), and 188,272 (45.8%) methylation sites, the estimate of σA2, σCt2, σCf2, and σE2, respectively, was zero. For 97,051 (23.6%) methylation sites, the estimates of all these four components were zero.
From analyses determining the best fitting variance component model for each methylation site, 355,455 (86.4%) site models included σΜ2 only, and 28,440 (6.9%), 18,974 (4.6%), 1,819 (0.4%), and 8,832 (2.2%) site models included σA2, σCt2, σCf2, and σE2, respectively (Table 2; Supplementary Figure 6). Across methylation sites with σA2, σCt2, σCf2, or σE2, the averages (SD) of σA2, σCt2, σCf2, and σE2 were 0.37 (0.15), 0.28 (0.06), 0.16 (0.05), and 0.72 (0.10), respectively (Table 1; Fig. 2). For these sites, the estimates of σA2, σCt2, σCf2, and σE2 were all significant at the nominal P value <0.05; therefore, they were also all significant at 5% FDR. The number of methylation sites with any environmental component (σCt2, σCf2, or σE2) was 29,305 (7.1%), more than the 28,440 (6.9%) methylation sites with σA2 (P value = 2 × 10⁻⁴). For methylation sites with genetic and/or environmental components, the average proportion of variance explained by environmental factors was larger than that explained by genetic factors (0.41 vs. 0.37, P value <10−15). The best fitting model for each methylation site can be found in the supplementary data.
Table 2.
Summary of the best fitting model for all methylation sites.
| Model/component | Number | Percent | |
|---|---|---|---|
| Model | |||
| ACtEM | 3 | 0.001 | |
| AEM | 311 | 0.08 | |
| CtEM | 257 | 0.06 | |
| CfEM | 10 | 0.002 | |
| ACtM | 1492 | 0.36 | |
| CtCfM | 50 | 0.01 | |
| AM | 26634 | 6.47 | |
| CtM | 17172 | 4.17 | |
| CfM | 1759 | 0.43 | |
| EM | 8251 | 2.01 | |
| M | 355455 | 86.40 | |
| Component | |||
| A | 28440 | 6.91 | |
| Ct | 18974 | 4.61 | |
| Cf | 1819 | 0.44 | |
| E | 8832 | 2.15 | |
| M only | 355455 | 86.40 |
Α, effects of additive genetic factors; Ct, effects of environmental factors shared by twins alone; Cf, effects of environmental factors shared by all family members; E, effects of individual environmental factors; M, effects of independent measurement error.
Figure 2.
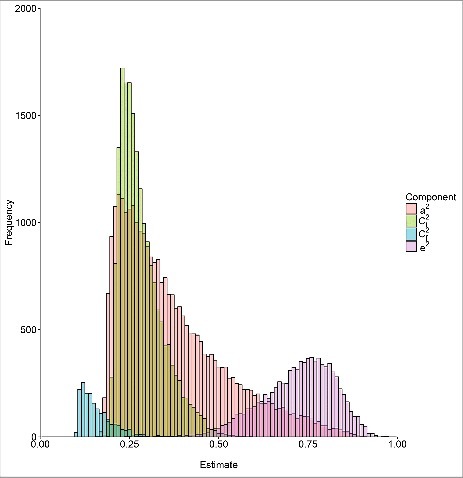
Distributions of genetic and environmental variance components from the best fitting model for the methylation sites with genetic and/or environmental components a2, effects of additive genetic factors, Ct2, effects of environmental factors shared by twins alone; Cf2, effects of environmental factors shared by all family members; and e2, effects of individual environmental factors.
The distributions of σA2, σCt2, σCf2, and σE2 differed by the measurement repeatability, methylation level, and variance of the site. Methylation sites with high repeatability had larger proportions of σA2, σCt2, and σE2, and greater estimates of σA2 and σE2. Methylation sites with intermediate repeatability had a larger proportion of σCf2, and greater estimates of σCt2 and σCf2 (Supplementary Figures 7 & 8). Intermediate methylated sites had larger proportions and greater estimates of all the four components (Supplementary Figures 9 & 10). Hypervariable methylation sites had larger proportions of σA2 and σCt2, and greater estimates of σA2. Intermediate variable methylation sites had larger proportions of σCf2 and σE2, and greater estimates of σCt2, σCf2, and σE2 (Supplementary Figures 11 & 12).
Methylation sites with σA2, σCt2, σCf2, and σE2 had different distributions across the genome (Supplementary Table 1). Overall, for all the four components, methylation sites were depleted in gene promoter, TSS200, and CpG island regions.
From the sensitivity analyses, the averages (SD) of σA2 increased to 0.04 (0.11) when the effects of environmental factors shared by twins alone were ignored (P value <10−15), and increased to 0.07 (0.14) when based on twins alone (P value <10−15). The numbers of methylation sites with σA2 increased to 35,855 (8.7%) and 54,487 (13.2%) from these two analyses (both P value <10−15).
meQTL analysis
Methylation sites with σA2 are sites at which the variation is determined in part by additive genetic factors. To better understand the genetic effects on these sites, we performed single nucleotide polymorphism (SNP)-methylation association analysis to investigate methylation quantitative trait loci (meQTL). Across the 28,440 methylation sites with σA2, there were 39,696 meQTL involving 1,281 (4.5%) sites and 27,630 SNPs. These meQTL comprised 36,766 (92.6%) cis-meQTL, involving 1,233 methylation sites and 25,641 SNPs, and 2,930 (7.4%) trans-meQTLs involving 54 methylation sites and 2,667 SNPs. Most of the cis-meQTLs were located within the region of 100 kb up- or down-stream from the target site (Supplementary Figure 12). Methylation sites with meQTL had a greater average estimate of σA2 than sites without meQTL (0.61 vs. 0.36, P value <10−15).
Pathway analysis
The most statistical significant pathways for which methylation sites with σA2 were enriched included Th1, Th2, antigen presentation, and several cell signaling pathways (Supplementary Table 2). The most statistical significant pathways for which methylation sites with σCt2 were enriched included several cell signaling pathways (Supplementary Table 3). The most statistical significant pathways for which methylation sites with σCf2 were enriched included TR/RXR activation and several cell signaling pathways (Supplementary Table 4). No statistical significant (at 5% FDR) pathway was found for methylation sites with σE2.
Discussion
Our study addressed the limitations of current classic twin/family research to study the genetic and/or environmental causes of methylomic variation measured by the HM450 array. To the best of our knowledge, our study of almost 500 subjects is the first to investigate: (i) blood methylome for middle-aged individuals with a large sample size; (ii) the best fitting model for each methylation site that allows for variation at different sites having different causes; (iii) twin-specific aggregation in methylation; and (iv) the influences of measurement error on studies of the causes of methylomic variation.
Our analyses suggest that the variation in blood methylome of middle-aged women measured by the HM450 array is largely explained by measurement error, as we found that for ∼86% of methylation sites for which the best fitting variance component model included σΜ2 only. Caution is needed when interpreting this result. First, our findings only apply to the HM450 array. The effects of measurement error might be of less concern for other methylation profiling methods with higher repeatability. Second, the blood samples are dried blood spots, which have been found to have a slightly lower repeatability than other sample types.12 Third, the effects of measurement error might be overestimated, as we only had 11 technical duplicate pairs. However, the overestimation could not be severe, given that the repeatability estimates in our study are similar to those based on 68 duplicate pairs: the median rDUP was 0.12 in our study, and the median ICC was 0.2 in Dugué et al.12
Our study implies that genetic factors do not influence the variation of the whole methylome but of certain methylation sites, as we found that for only ∼7% of methylation sites the best fitting model included σA2. The heterogeneous influences of genetic factors have also been reported by previous studies. In previous classic twin studies, the heritability estimates (under certain assumptions that optimize the likelihood of concluding a genetic cause of variation) were significant for only ∼40% of methylation sites after multiple testing adjustment,7,9 and variation of only a small proportion (10–15%) of methylation sites has been found to be associated with meQTL.24–26
Our study casts doubts on the approach for investigating the influences of genetic factors on methylomic variation used in previous classic twin/family studies. Those studies have estimated heritability for each methylation site under the same variance component model, which assumed that all familial correlation is due to additive genetic factors, and none to the sharing of environmental causes. That is, in the parlance of the classic twin model, they have fitted ACE models with C = 0. One justification for this was that the average correlation for MZ pairs was about twice that for DZ pairs. However, the average correlation is not the correlation of any defined entity, so the logic behind the classic twin model has been inappropriately applied. We have allowed the C component to vary across methylation sites, and to also differ between twin pairs (assuming, as in the classic twin model, that C is the same for MZ and DZ pairs) and sibling pairs. We found evidence for substantial variation attributable to shared environmental factors across methylation sites, contrary to the assumption made in previous classic twin/family studies. The average of the heritability estimates across methylation sites was ∼20% in previous classic twin/family studies.7,9–11 How and whether this average estimate can be interpreted as a measure of the influences of genetic factors on the whole methylome, however that might be defined, is open to question in several aspects. First, a substantial proportion of methylation sites were found to have no familial aggregation, let alone to be impacted by any shared factors, including genetic factors. A similar observation had also been found by a study with a large sample size: only ∼40% and ∼10% of methylation sites were correlated for MZ and DZ pairs, respectively.9 Second, this average estimate was based on the assumption that the familial aggregation is due to genetic factors solely; however, as we discussed above, the assumption is questionable. Third, this average estimate was calculated by applying the same variance component model to all methylation sites, while our analyses found that variation at different sites had different causes. Fourth, this average estimate is unlikely to have potential biological representation for the whole methylome, given that the average of heritability estimates is not necessarily equal to the heritability of any defined entity.
Our study suggests that environmental factors have stronger influences on methylomic variation than genetic factors, as we found that environmental factors influenced more methylation sites and explained more variance than genetic factors. Note that, given the potential that our study overestimated measurement error, the influences of individual environmental factors are potentially underestimated. Similar observations have been found in previous studies.6,7,9–11 The results of these studies can be interpreted as individual environmental factors (though combined with measurement error) explain on average 80–95% of variation across all methylation sites. Studies using other methods to quantify genome-wide methylation profile, such as whole genome bisulfite sequencing, also find that environmental factors are the main cause of methylomic variation.16,17
We found that ∼5% of methylation sites were influenced by environmental factors shared by twins alone. These environmental factors might be prenatal, perinatal, or intrauterine environmental factors, given that twins share the uterus before birth and that some intrauterine effects on methylation appear to be long lasting and persist into later life.18–20 There is also evidence that these methylation sites are influenced by prenatal, perinatal, or intrauterine environmental factors: among these sites, 90 have been found to be associated with maternal plasma folate level5 and 794 have been found to be associated with maternal smoking.21 The developmental origins of health and disease (DOHaD) hypothesis considers one possible biological mechanism for the prenatal, perinatal, or intrauterine origins of postnatal health outcomes is prenatal, perinatal, or intrauterine environmental factors influencing the fetus methylome.22,23 Methylation at these sites might mediate the effects of prenatal, perinatal, or intrauterine environmental factors on postnatal health.
Our study shows that the classic twin design alone has the potential to overestimate the genetic effects on methylomic variation, given that the average estimate of σA2 in the full model and the number of methylation sites with σA2 both increased from the sensitivity analyses. By including siblings of twins and investigating a twin-specific variance component, our design and analyses are better in teasing apart the effects of shared genes and shared environment, and have given more insight into the causes of methylomic variation.
Methylation sites with σA2 are sites at which the variation is determined in part by additive genetic factors. However, for these sites, a small proportion was found to be associated with meQTL. This result could be due to the observation that common SNPs cannot explain the whole heritability estimated by classic twin studies, the so-called “missing heritability” problem. One study found that, for 39% of methylation sites the heritability estimated based on the classic twin model could not be explained by common SNPs.9 However, we found that methylation sites associated with meQTL had greater heritability estimates, suggesting that sites with greater estimates of σA2 tend to be more likely to be associated with common SNPs. We also observed that the identified meQTL comprised more than 90% cis-meQTL and most of the cis-meQTL were located within the region of 100 kb up- or down-stream from the target site, which implies that sites with σA2 appear to be impacted by nearby SNPs. Identification of the biological plausibility of disease-associated SNPs from genome-wide association studies is problematic. The same problem is also expected in the meQTL analysis. More research is needed on the biological plausibility of the identified meQTL.
Our study found that methylation sites influenced by genetic and/or environmental factors were distributed unevenly across the genome. Other studies have also reported similar observations.7,9 These results suggest that methylation at different genomic regions have different vulnerabilities to the influences of genetic and/or environmental factors.
We found that sites influenced by genetic and/or environmental factors were enriched in several biological pathways, especially those involved in cell signaling. For middle-aged women, therefore, these pathways might be more easily influenced by genetic and/or environmental factors. The pathways in which sites influenced by genetic factors were enriched included CDC42 signaling pathway, involved in regulation of cell cycle, and several immune response pathways, including Th1 and Th2 activation, antigen presentation, and CXCR4 signaling. These results imply that some biological functions related to regulation of cell cycle and immune response might be influenced by genetic factors. The pathways in which sites influenced by environmental factors were enriched included leptin signaling pathway in obesity, TR/RXR activation pathway involved in thyroid hormone's effects on growth and metabolism, and several cAMP-dependent pathways, including cAMP signaling and protein kinase A signaling, involved in cell communication. These results imply that some biological functions related to growth, metabolism, and cell communication might be influenced by cross-sectional environmental factors. Nonetheless, our results should not be over-interpreted, as they are cross-sectional observations. A greater understanding of the influences of genetic and/or environmental factors on these biological functions could be facilitated by prospective or other epidemiological designs that address issues around causation, and by biological research.
Caution is needed when interpreting our results. Our included participants were middle-aged women and we studied the blood methylation measured by the HM450 array, so our findings may be not generalized to other populations, tissues, or measurement tools. Additionally, targeting on only ∼2% CpGs of the human genome, the HM450 array does not cover the whole genome but only certain genomic regions;24,25 therefore, our findings might be not generalized to the whole genome.
In conclusion, our results are consistent with, for middle-aged women, blood methylomic variation measured by the HM450 array being largely explained by measurement error and more influenced by environmental factors than by genetic factors.
Material and methods
Subjects
Subjects were from the Australian Mammographic Density Twins and Sisters Study (AMDTSS), originally designed to study mammographic density as a predictor of breast cancer risk.26 A subset of 479 women enriched for having the most informative twin and family design, comprising 66 monozygotic (MZ) twin pairs, 66 dizygotic (DZ) twin pairs and their 215 sisters from 130 families, were selected for DNA methylation research.27
DNA methylation data
DNA was extracted from dried blood spots stored on Guthrie cards using a method previously reported.28 DNA was sodium bisulfite converted using the EZ DNA Methylation-Gold protocol as per manufacturers' instructions (Zymo Research, Irvine, CA) and eluted in 20 µl elution buffer. A total of 11 random technical replicates were included in the measurement. Raw intensity data was processed by Bioconductor minfi package,29 which included normalization of data using Illumina's reference factor-based normalization methods (preprocessIllumina) and subset-quantile within array normalization (SWAN)30 for type I and II probe bias correction. An empirical Bayes batch-effects removal method ComBat31 was applied to minimize the technical variation across batches. All samples passed quality control. Probes with missing value (detection P value >0.01) in one or more samples and the 65 control probes were excluded, leaving 479,957 probes in the final dataset (see Li et al.27 for more details). In this analysis, we additionally excluded probes with documented SNPs at the target CpG, binding to multiple locations,32 or binding to the X chromosome, leaving data for 411,394 methylation sites. The data are available at the Gene Expression Omnibus under accession number GSE100227.
Single nucleotide polymorphism (SNP) data
Among the 479 women, 75 unrelated women had genome-wide SNP data. Initially, a total of 343 unrelated women from the ADMTSS were genotyped using the Illumina 610 Quad SNP chip. Standard quality control was performed. Imputation was performed using Impute233–35 with 1000 Genomes Phase I as reference (see Lindstrom et al.36 for more details). In this analysis, additional quality control was performed for the included 75 women to remove SNPs on the X chromosome, with minor allele frequency (MAF) <0.05, missing rate >0.1, Hardy-Weinberg Equilibrium P value <10−6, or imputation info <0.8. A total of 495,133 genotyped SNPs and 4,124,945 imputed SNPs were included in analysis.
Statistical methods
Familial correlation and variance component model
For each methylation site, the methylation M-value was first adjusted for age at blood draw and estimated cell type proportion using a linear regression model. The residuals from the model were standardized to be Z-scores and used in subsequent analyses. The cell type proportion was estimated from the methylation data using the Houseman method37 implemented in the package minfi.
For each methylation site, we estimated the correlations for MZ pairs (rMZ), DZ pairs (rDZ), sibling pairs (including twin-sister pairs, rSIB), and duplicate pairs (rDUP), simultaneously. We fitted variance component models in which we assumed that the residual variance (σ2=1) can be partitioned into five components: σA2, the effects of additive genetic factors (A); σCt2, the effects of environmental factors shared by twins alone (Ct); σCf2, the effects of environmental factors shared by all family members (including twins, Cf); σE2, the effects of individual environmental factors (E); and σM2, the effects of independent measurement error (M). The model is an extension of the classic twin model by dividing the shared environmental factors into those shared by twins alone and those shared by all family members, and by disentangling the effects of individual environmental factors and independent measurement error. Similar to the key assumptions of the classic twin model, we assumed that MZ and DZ pairs share σCt2 to the same extent, and that measurement error is independent across individuals and any aspect of measurement error that is common is accounted for within the shared environment component. We also assumed that all pairs of family members share σCf2 to the same extent. According to such assumptions, σ2 = σA2 + σCt2 + σCf2 + σE2 + σM2, and the covariance is σA2 + σCt2 + σCf2 for MZ pairs, 0.5 × σA2 + σCt2 + σCf2 for DZ pairs, 0.5 × σA2 + σCf2 for sibling pairs, and σA2 + σCt2 + σCf2 + σE2 for duplicate pairs. For each methylation site, a total of 16 models were fitted: ACtCfEM, ACtEM, ACfEM, CtCfEM, ACtCfM, ACtM, ACfM, AEM, CtCfM, CtEM, CfEM, AM, CtM, CfM, EM, and M, and the best fitting model was assessed using the Bayesian Information Criterion (BIC).
We performed two sensitivity analyses to investigate the impact of variations in our design on the estimation of genetic effects: first, we ignored the effects of environmental factors shared by twins alone; second, we included twin pairs only. In both analyses, the classical twin model was assumed, except that the effects of individual environmental factors and measurement error were separated. For each methylation site, a total of eight models (ACEM, ACM, AEM, CEM, AM, CM, EM, and M, where C is the effects of shared environmental factors) were fitted and the best fitting model was assessed. Between the primary and sensitivity analyses, the average estimates of σA2 in the full model were compared using a paired t-test, and the numbers of sites with σA2 were compared using the McNemar's test.
The familial correlations and variance components were estimated based on computationally maximizing the likelihood of a multivariate normal model for pedigree analysis,38–40 using the Sequential Oligogenic Linkage Analysis Routines (SOLAR) program (http://solar-eclipse-genetics.org/).
Genomic region enrichment analysis
Methylation sites with significant and positive familial correlations or being influenced by genetic and/or environmental factors were examined if they were enriched, relative to all methylation sites analyzed, in any genomic region. According to Illumina's annotation file, methylation sites were grouped according to their genomic positions (gene body, intergenic region, promoter, 1,500 bp upstream of the TSS (TSS1500), TSS200, 5′untranslated region (UTR), 1stExon, or 3′UTR) or to their positions relative to a CpG island (CGI) (CpG island, CpG shelf, CpG shore, or non-CGI region). The statistical significance of the enrichment was examined using the chi-square test.
meQTL analysis
For methylation sites with σA2, SNP-methylation association analysis was performed to investigate methylation quantitative trait loci (meQTL). The analysis was performed using the 75 women who had both DNA methylation and SNP data. Both cis-meQTL and trans-meQTL were investigated. The definition of cis-meQTL is the SNP within a region of 500 kb up- or down-stream from the target site (a total of 1 Mb), while the definition of trans-meQTL is the SNP out of that region on the same chromosome or on a different chromosome. The analysis was performed on the Z-score above using the MatrixQTL41 under an additive model. A total of 4,620,078 × 28,440 ≈ 1.3 × 10¹¹ associations were tested. Associations with a P value <3.8 × 10⁻¹³ were regarded as genome-wide significant.
Pathway analysis
For those methylation sites for which the best fitting model including σA2, σCt2, σCf2, or σE2, pathway analysis was performed to investigate whether these sites were enriched for any particular pathway. For each component, according to the proportion of variance explained, the top 2,000 methylation sites were annotated to genes according to the closest transcription start site (TSS).32 The gene lists were uploaded to the QIAGEN's Ingenuity® Pathway Analysis (IPA®, QIAGEN Redwood City, www.qiagen.com/ingenuity) for assessing overrepresentation relative to all human gene functions.42
Ethics
The AMDTSS was approved by the Human Research Ethics Committee of the University of Melbourne. All participants provided written informed consent.
Supplementary Material
Funding Statement
The AMDTSS was supported by NHMRC (grant numbers 1050561 and 1079102), Cancer Australia and National Breast Cancer Foundation (grant number 509307).
Competing financial interests
The authors declare no competing financial interests.
Acknowledgments
We would like to thank all women participating in the study. The data analysis was facilitated by Spartan, the High Performance Computer and Cloud hybrid system of the University of Melbourne.
The AMDTSS was facilitated through the Australian Twin Registry, a national research resource in part supported by a Centre for Research Excellence Grant from the National Health and Medical Research Council (NHMRC) APP 1079102. The AMDTSS was supported by NHMRC (grant numbers 1050561 and 1079102), Cancer Australia and National Breast Cancer Foundation (grant number 509307).
SL is supported by the Australian Government Research Training Program Scholarship from the University of Melbourne. TLN is supported by a NHMRC Post-Graduate Scholarship and the Richard Lovell Travelling Scholarship from the University of Melbourne. MCS is a NHMRC Senior Research Fellow of NHMRC. JLH is a NHMRC Senior Principal Research Fellow.
References
- 1.Petronis A. Epigenetics as a unifying principle in the aetiology of complex traits and diseases. Nature. 2010;465:721–7. doi: 10.1038/nature09230. PMID:20535201. [DOI] [PubMed] [Google Scholar]
- 2.Chambers JC, Loh M, Lehne B, Drong A, Kriebel J, Motta V, Wahl S, Elliott HR, Rota F, Scott WR, et al.. Epigenome-wide association of DNA methylation markers in peripheral blood from Indian Asians and Europeans with incident type 2 diabetes: a nested case-control study. Lancet Diabetes Endocrinol. 2015;3:526–34. doi: 10.1016/S2213-8587(15)00127-8. PMID:26095709. [DOI] [PMC free article] [PubMed] [Google Scholar]
- 3.Dick KJ, Nelson CP, Tsaprouni L, Sandling JK, Aissi D, Wahl S, Meduri E, Morange PE, Gagnon F, Grallert H, et al.. DNA methylation and body-mass index: a genome-wide analysis. Lancet. 2014;383:1990–8. doi: 10.1016/S0140-6736(13)62674-4. PMID:24630777. [DOI] [PubMed] [Google Scholar]
- 4.Breitling LP, Yang R, Korn B, Burwinkel B, Brenner H. Tobacco-smoking-related differential DNA methylation: 27K discovery and replication. Am J Hum Genet. 2011;88:450–7. doi: 10.1016/j.ajhg.2011.03.003. PMID:21457905. [DOI] [PMC free article] [PubMed] [Google Scholar]
- 5.Joubert BR, den Dekker HT, Felix JF, Bohlin J, Ligthart S, Beckett E, Tiemeier H, van Meurs JB, Uitterlinden AG, Hofman A, et al.. Maternal plasma folate impacts differential DNA methylation in an epigenome-wide meta-analysis of newborns. Nat Commun. 2016;7:10577. doi: 10.1038/ncomms10577. PMID:26861414. [DOI] [PMC free article] [PubMed] [Google Scholar]
- 6.Gordon L, Joo JE, Powell JE, Ollikainen M, Novakovic B, Li X, Andronikos R, Cruickshank MN, Conneely KN, Smith AK, et al.. Neonatal DNA methylation profile in human twins is specified by a complex interplay between intrauterine environmental and genetic factors, subject to tissue-specific influence. Genome Res. 2012;22:1395–406. doi: 10.1101/gr.136598.111. PMID:22800725. [DOI] [PMC free article] [PubMed] [Google Scholar]
- 7.McRae AF, Powell JE, Henders AK, Bowdler L, Hemani G, Shah S, Painter JN, Martin NG, Visscher PM, Montgomery GW. Contribution of genetic variation to transgenerational inheritance of DNA methylation. Genome Biol. 2014;15:R73. doi: 10.1186/gb-2014-15-5-r73. PMID:24887635. [DOI] [PMC free article] [PubMed] [Google Scholar]
- 8.Tremblay BL, Guenard F, Lamarche B, Perusse L, Vohl MC. Familial resemblances in blood leukocyte DNA methylation levels. Epigenetics. 2016;11:831–8. doi: 10.1080/15592294.2016.1232234. PMID:27611651. [DOI] [PMC free article] [PubMed] [Google Scholar]
- 9.van Dongen J, Nivard MG, Willemsen G, Hottenga JJ, Helmer Q, Dolan CV, Ehli EA, Davies GE, van Iterson M, Breeze CE, et al.. Genetic and environmental influences interact with age and sex in shaping the human methylome. Nat Commun. 2016;7:11115. doi: 10.1038/ncomms11115. PMID:27051996. [DOI] [PMC free article] [PubMed] [Google Scholar]
- 10.Bell JT, Tsai PC, Yang TP, Pidsley R, Nisbet J, Glass D, Mangino M, Zhai G, Zhang F, Valdes A, et al.. Epigenome-wide scans identify differentially methylated regions for age and age-related phenotypes in a healthy ageing population. PLoS Genet. 2012;8:e1002629. doi: 10.1371/journal.pgen.1002629. PMID:22532803. [DOI] [PMC free article] [PubMed] [Google Scholar]
- 11.Grundberg E, Meduri E, Sandling JK, Hedman AK, Keildson S, Buil A, Busche S, Yuan W, Nisbet J, Sekowska M, et al.. Global analysis of DNA methylation variation in adipose tissue from twins reveals links to disease-associated variants in distal regulatory elements. Am J Hum Genet. 2013;93:876–90. doi: 10.1016/j.ajhg.2013.10.004 . PMID:24183450. [DOI] [PMC free article] [PubMed] [Google Scholar]
- 12.Dugue PA, English DR, MacInnis RJ, Jung CH, Bassett JK, FitzGerald LM, Wong EM, Joo JE, Hopper JL, Southey MC, et al.. Reliability of DNA methylation measures from dried blood spots and mononuclear cells using the HumanMethylation450k BeadArray. Sci Rep. 2016;6:30317. doi: 10.1038/srep30317. PMID:27457678. [DOI] [PMC free article] [PubMed] [Google Scholar]
- 13.Bose M, Wu C, Pankow JS, Demerath EW, Bressler J, Fornage M, Grove ML, Mosley TH, Hicks C, North K, et al.. Evaluation of microarray-based DNA methylation measurement using technical replicates: the Atherosclerosis Risk In Communities (ARIC) Study. BMC Bioinformatics. 2014;15:312. doi: 10.1186/1471-2105-15-312. PMID:25239148. [DOI] [PMC free article] [PubMed] [Google Scholar]
- 14.Shvetsov YB, Song MA, Cai Q, Tiirikainen M, Xiang YB, Shu XO, Yu H. Intraindividual variation and short-term temporal trend in DNA methylation of human blood. Cancer Epidemiol Biomarkers Prev. 2015;24:490–7. doi: 10.1158/1055-9965.EPI-14-0853. PMID:25538225. [DOI] [PMC free article] [PubMed] [Google Scholar]
- 15.Benjamini Y, Hochberg Y. Controlling the False Discovery Rate – a Practical and Powerful Approach to Multiple Testing. Journal of the Royal Statistical Society Series B-Methodological. 1995;57:289–300. [Google Scholar]
- 16.Livshits G, Gao F, Malkin I, Needhamsen M, Xia Y, Yuan W, Bell CG, Ward K, Liu Y, Wang J, et al.. Contribution of Heritability and Epigenetic Factors to Skeletal Muscle Mass Variation in United Kingdom Twins. J Clin Endocrinol Metab. 2016;101:2450–9. doi: 10.1210/jc.2016-1219. PMID:27144936. [DOI] [PMC free article] [PubMed] [Google Scholar]
- 17.Busche S, Shao X, Caron M, Kwan T, Allum F, Cheung WA, Ge B, Westfall S, Simon MM, Multiple Tissue Human Expression R, et al.. Population whole-genome bisulfite sequencing across two tissues highlights the environment as the principal source of human methylome variation. Genome Biol. 2015;16:290. doi: 10.1186/s13059-015-0856-1. PMID:26699896. [DOI] [PMC free article] [PubMed] [Google Scholar]
- 18.Lee KW, Richmond R, Hu P, French L, Shin J, Bourdon C, Reischl E, Waldenberger M, Zeilinger S, Gaunt T, et al.. Prenatal exposure to maternal cigarette smoking and DNA methylation: epigenome-wide association in a discovery sample of adolescents and replication in an independent cohort at birth through 17 years of age. Environ Health Perspect. 2015;123:193–9. PMID:25325234. [DOI] [PMC free article] [PubMed] [Google Scholar]
- 19.Richmond RC, Simpkin AJ, Woodward G, Gaunt TR, Lyttleton O, McArdle WL, Ring SM, Smith AD, Timpson NJ, Tilling K, et al.. Prenatal exposure to maternal smoking and offspring DNA methylation across the lifecourse: findings from the Avon Longitudinal Study of Parents and Children (ALSPAC). Hum Mol Genet. 2015;24:2201–17. doi: 10.1093/hmg/ddu739. PMID:25552657. [DOI] [PMC free article] [PubMed] [Google Scholar]
- 20.Breton CV, Siegmund KD, Joubert BR, Wang X, Qui W, Carey V, Nystad W, Haberg SE, Ober C, Nicolae D, et al.. Prenatal tobacco smoke exposure is associated with childhood DNA CpG methylation. PLoS One. 2014;9:e99716. doi: 10.1371/journal.pone.0099716. PMID:24964093. [DOI] [PMC free article] [PubMed] [Google Scholar]
- 21.Joubert BR, Felix JF, Yousefi P, Bakulski KM, Just AC, Breton C, Reese SE, Markunas CA, Richmond RC, Xu CJ, et al.. DNA Methylation in Newborns and Maternal Smoking in Pregnancy: Genome-wide Consortium Meta-analysis. Am J Hum Genet. 2016;98:680–96. doi: 10.1016/j.ajhg.2016.02.019. PMID:27040690. [DOI] [PMC free article] [PubMed] [Google Scholar]
- 22.Waterland RA, Michels KB. Epigenetic epidemiology of the developmental origins hypothesis. Annu Rev Nutr. 2007;27:363–88. doi: 10.1146/annurev.nutr.27.061406.093705. PMID:17465856. [DOI] [PubMed] [Google Scholar]
- 23.Wadhwa PD, Buss C, Entringer S, Swanson JM. Developmental origins of health and disease: brief history of the approach and current focus on epigenetic mechanisms. Semin Reprod Med. 2009;27:358–68. doi: 10.1055/s-0029-1237424. PMID:19711246. [DOI] [PMC free article] [PubMed] [Google Scholar]
- 24.Sandoval J, Heyn H, Moran S, Serra-Musach J, Pujana MA, Bibikova M, Esteller M. Validation of a DNA methylation microarray for 450,000 CpG sites in the human genome. Epigenetics. 2011;6:692–702. doi: 10.4161/epi.6.6.16196. PMID:21593595. [DOI] [PubMed] [Google Scholar]
- 25.Dedeurwaerder S, Defrance M, Calonne E, Denis H, Sotiriou C, Fuks F. Evaluation of the Infinium Methylation 450K technology. Epigenomics. 2011;3:771–84. doi: 10.2217/epi.11.105. PMID:22126295. [DOI] [PubMed] [Google Scholar]
- 26.Odefrey F, Stone J, Gurrin LC, Byrnes GB, Apicella C, Dite GS, Cawson JN, Giles GG, Treloar SA, English DR, et al.. Common genetic variants associated with breast cancer and mammographic density measures that predict disease. Cancer Res. 2010;70:1449–58. doi: 10.1158/0008-5472.CAN-09-3495. PMID:20145138. [DOI] [PubMed] [Google Scholar]
- 27.Li S, Wong EM, Joo JE, Jung CH, Chung J, Apicella C, Stone J, Dite GS, Giles GG, Southey MC, et al.. Genetic and Environmental Causes of Variation in the Difference Between Biological Age Based on DNA Methylation and Chronological Age for Middle-Aged Women. Twin Res Hum Genet. 2015;18:720–6. doi: 10.1017/thg.2015.75. PMID:26527295. [DOI] [PubMed] [Google Scholar]
- 28.Joo JE, Wong EM, Baglietto L, Jung CH, Tsimiklis H, Park DJ, Wong NC, English DR, Hopper JL, Severi G, et al.. The use of DNA from archival dried blood spots with the Infinium HumanMethylation450 array. Bmc Biotechnology. 2013;13:23. doi: 10.1186/1472-6750-13-23. PMID:23497093. [DOI] [PMC free article] [PubMed] [Google Scholar]
- 29.Aryee MJ, Jaffe AE, Corrada-Bravo H, Ladd-Acosta C, Feinberg AP, Hansen KD, Irizarry RA. Minfi: a flexible and comprehensive Bioconductor package for the analysis of Infinium DNA methylation microarrays. Bioinformatics. 2014;30:1363–9. doi: 10.1093/bioinformatics/btu049. PMID:24478339. [DOI] [PMC free article] [PubMed] [Google Scholar]
- 30.Maksimovic J, Gordon L, Oshlack A. SWAN: Subset-quantile Within Array Normalization for Illumina Infinium HumanMethylation450 BeadChips. Genome Biology. 2012;13:R44. doi: 10.1186/gb-2012-13-6-r44. PMID:22703947. [DOI] [PMC free article] [PubMed] [Google Scholar]
- 31.Johnson WE, Li C, Rabinovic A. Adjusting batch effects in microarray expression data using empirical Bayes methods. Biostatistics. 2007;8:118–27. doi: 10.1093/biostatistics/kxj037. PMID:16632515. [DOI] [PubMed] [Google Scholar]
- 32.Price ME, Cotton AM, Lam LL, Farre P, Emberly E, Brown CJ, Robinson WP, Kobor MS. Additional annotation enhances potential for biologically-relevant analysis of the Illumina Infinium HumanMethylation450 BeadChip array. Epigenetics Chromatin. 2013;6:4. doi: 10.1186/1756-8935-6-4. PMID:23452981. [DOI] [PMC free article] [PubMed] [Google Scholar]
- 33.Howie BN, Donnelly P, Marchini J. A flexible and accurate genotype imputation method for the next generation of genome-wide association studies. PLoS Genet. 2009;5:e1000529. doi: 10.1371/journal.pgen.1000529. PMID:19543373. [DOI] [PMC free article] [PubMed] [Google Scholar]
- 34.Howie B, Marchini J, Stephens M. Genotype imputation with thousands of genomes. G3 (Bethesda). 2011;1:457–70. doi: 10.1534/g3.111.001198. PMID:22384356. [DOI] [PMC free article] [PubMed] [Google Scholar]
- 35.Howie B, Fuchsberger C, Stephens M, Marchini J, Abecasis GR. Fast and accurate genotype imputation in genome-wide association studies through pre-phasing. Nat Genet. 2012;44:955–9. doi: 10.1038/ng.2354. PMID:22820512. [DOI] [PMC free article] [PubMed] [Google Scholar]
- 36.Lindstrom S, Thompson DJ, Paterson AD, Li J, Gierach GL, Scott C, Stone J, Douglas JA, dos-Santos-Silva I, Fernandez-Navarro P, et al.. Genome-wide association study identifies multiple loci associated with both mammographic density and breast cancer risk. Nat Commun. 2014;5:5303. doi: 10.1038/ncomms6303. PMID:25342443. [DOI] [PMC free article] [PubMed] [Google Scholar]
- 37.Houseman EA, Accomando WP, Koestler DC, Christensen BC, Marsit CJ, Nelson HH, Wiencke JK, Kelsey KT. DNA methylation arrays as surrogate measures of cell mixture distribution. BMC Bioinformatics. 2012;13:86. doi: 10.1186/1471-2105-13-86. PMID:22568884. [DOI] [PMC free article] [PubMed] [Google Scholar]
- 38.Hopper JL, Mathews JD. Extensions to multivariate normal models for pedigree analysis. Ann Hum Genet. 1982;46:373–83. doi: 10.1111/j.1469-1809.1982.tb01588.x. PMID:6961886. [DOI] [PubMed] [Google Scholar]
- 39.Hopper JL, Mathews JD. A multivariate normal model for pedigree and longitudinal data and the software ‘FISHER’. Aust J Statist. 1994;36:153–76. doi: 10.1111/j.1467-842X.1994.tb00859.x. [DOI] [Google Scholar]
- 40.Lange K, Westlake J, Spence MA. Extensions to pedigree analysis. III. Variance components by the scoring method. Ann Hum Genet. 1976;39:485–91. [DOI] [PubMed] [Google Scholar]
- 41.Shabalin AA. Matrix eQTL: ultra fast eQTL analysis via large matrix operations. Bioinformatics. 2012;28:1353–8. doi: 10.1093/bioinformatics/bts163. PMID:22492648. [DOI] [PMC free article] [PubMed] [Google Scholar]
- 42.Kramer A, Green J, Pollard J Jr., Tugendreich S. Causal analysis approaches in Ingenuity Pathway Analysis. Bioinformatics. 2014;30:523–30. doi: 10.1093/bioinformatics/btt703. PMID:24336805. [DOI] [PMC free article] [PubMed] [Google Scholar]
Associated Data
This section collects any data citations, data availability statements, or supplementary materials included in this article.