

ABSTRACT
Kabuki syndrome (KS) is caused by mutations in KMT2D, which is a histone methyltransferase involved in methylation of H3K4, a histone marker associated with DNA methylation. Analysis of >450,000 CpGs in 24 KS patients with pathogenic mutations in KMT2D and 216 controls, identified 24 genomic regions, along with 1,504 CpG sites with significant DNA methylation changes including a number of Hox genes and the MYO1F gene. Using the most differentiating and significant probes and regions we developed a “methylation variant pathogenicity (MVP) score,” which enables 100% sensitive and specific identification of individuals with KS, which was confirmed using multiple public and internal patient DNA methylation databases. We also demonstrated the ability of the MVP score to accurately reclassify variants of unknown significance in subjects with apparent clinical features of KS, enabling its potential use in molecular diagnostics. These findings provide novel insights into the molecular etiology of KS and illustrate that DNA methylation patterns can be interpreted as ‘epigenetic echoes’ in certain clinical disorders.
KEYWORDS: Kabuki syndrome, KMT2D, KDM6A, DNA methylation, variant classification
Introduction
Mutations in the genes encoding the epigenetic protein machinery that read, write, and erase posttranslational signals on DNA and histone proteins are implicated in a wide range of constitutional neurodevelopmental disorders.1,2 One such condition, Kabuki syndrome (KS), is a rare congenital disorder characterized by distinct dysmorphic facial features, intellectual disabilities, postnatal dwarfism, skeletal malformations, and dermatoglyphic abnormalities.3 Mutations in the lysine methyltransferase 2D (KMT2D) gene, also known as MLL2, are responsible for the vast majority of KS cases, while 5–8% are caused by mutations in the lysine demethylase 6A (KDM6A) gene.4 Most of these mutations are truncating, leading to haploinsufficiency of the Kmt2d protein.5 For approximately 30% of individuals with a clinical diagnosis of KS, the genetic cause remains unknown, suggesting the possibility of locus heterogeneity,6 misclassification of variants, or as yet unrecognized promoter or deep intronic mutations affecting normal gene splicing. Therefore, exhaustive mutation analysis of KMT2D or KDM6A may not always establish a molecular diagnosis of KS. Also, diagnosis of KS remains challenging due to overlapping clinical presentations with other developmental conditions such as CHARGE syndrome, Larsen syndrome, 22q11 deletion syndrome, and Hardikar syndrome, as well as a lack of consensus clinical diagnostic criteria.
Both KMT2D and KDM6A encode proteins that belong to the histone modification machinery. Kmt2d is required for H3K4 di- and tri-methylation, a hallmark of transcriptional activation.7 Kmt2d contains a highly conserved SET domain and acts in a multiprotein complex (ASC-2 complex) that works in the removal of repressive epigenetic marks, polycomb displacement, and positioning of histone methylation marks.8–10 Kdm6a is an H3K27 demethylase that interacts with Kmt2d in regulating gene expression.11 Defective Kmt2d or Kdm6A activity leads to imbalances in the histone marks on downstream target genes, thereby compromising aberrant gene activation/suppression and resulting in errors in differentiation during embryonic development. It is well established that histone modification overlaps and interacts with genomic DNA methylation to affect chromatin remodeling;12,13 thus, mutations in genes involved in histone modification are expected to leave traces on the methylome.
We have previously described methylation signatures in the peripheral blood specimens of patients carrying mutations in genes involved in chromatin regulation including SRCAP, associated with Floating-Harbor Syndrome,14 DNMT1 associated with DNMT1-associated autosomal dominant cerebellar ataxia, deafness and narcolepsy,15 and ATRX responsible for the alpha thalassemia/mental retardation X-linked syndrome.16 As expected, residual epigenetic signatures in downstream targets of Kmt2d have also been found recently in patients with Kabuki syndrome.17 In the present study, we expand on these findings and report a specific DNA methylation signature in the peripheral blood specimens of 24 patients with truncating mutations in KMT2D and propose a diagnostic classification model which can accurately assign a classification score to variants in KMT2D and separate Kabuki patients from those with overlapping clinical presentations. As well, we show that this DNA methylation classification model is highly specific to Kabuki syndrome and is not sensitive to other diseases that result from defects in the epigenomic machinery.
Results
Description of the study cohort
A total of 42 patients analyzed for KMT2D variants were recruited for this study. All of these patients presented with clinical features suggesting Kabuki syndrome as a primary diagnosis. Using the American College of Medical Genetics (ACMG) guidelines, 24 patients were identified to carry a pathogenic or likely pathogenic mutation in KMT2D and, thus, they were confirmed to be affected by Kabuki syndrome. From the remaining 18 individuals, 11 were found to carry benign mutations and, thus, were not likely to be a case of KS, and 7 carried variants of unknown significance (VUS), leaving them unsolved. Table 1 represents the mutation types and demographic characteristics of all 42 individuals. For the 24 patients with confirmed pathogenic mutations [15 females (62.5%); mean age: 7.9 ± 7.3], a sample of 216 sex- and age-matched controls [135 females (62.5%); mean age: 8.2 ± 9.1] was identified from our reference database to perform epigenomic profiling and develop a classification model.
Table 1.
Molecular and demographic characteristics of the study cohort.
| Row | Patient ID | Sex | Age | cDNA Nomenclature | Protein Change | Mutation Type | ACMG Classification |
|---|---|---|---|---|---|---|---|
| 1 | KAB2 | F | 19.1 | c.16048A > T | p.K5350X | nonsense | Pathogenic |
| 2 | KAB3 | M | 3.4 | c.16360C > T | p.R5454X | nonsense | Pathogenic |
| 3 | KAB4 | M | 3.1 | c.8692C > T | p.Q2898X | nonsense | Pathogenic |
| 4 | KAB5 | F | 4.1 | c.14878C > T | p.R4960X | nonsense | Pathogenic |
| 5 | KAB6 | F | 6.9 | c.10740+1G > A | splice-site | Pathogenic | |
| 6 | KAB7 | F | 1.0 | c.11596C > T | p.Q3866X | nonsense | Pathogenic |
| 7 | KAB8 | M | 7.1 | c.10201C > T | p.Q3401X | nonsense | Pathogenic |
| 8 | KAB10 | F | 2.8 | c.10741-42G > A | intronic | Likely Benign | |
| 9 | KAB11 | F | 23.1 | c.6265A > T | p.K2089X | nonsense | Pathogenic |
| 10 | KAB12 | M | 2.2 | c.13652T > A | p.L4551X | nonsense | Pathogenic |
| 11 | KAB13 | M | 13.8 | c.12889T > C | p.S4297P | missense | VUS |
| 12 | KAB14 | F | 16.6 | c.548delC | frame-shift | Pathogenic | |
| 13 | KAB15 | F | 3.3 | c.7411C > T | p.R2471X | nonsense | Pathogenic |
| 14 | KAB16 | F | 24.1 | c.1966dupC | frame-shift | Pathogenic | |
| 15 | KAB17 | M | 1.3 | c.6752C > T | p.S2251L | missense | Likely Benign |
| 16 | KAB18 | F | 9.5 | c.6200delA | frame-shift | Pathogenic | |
| 17 | KAB19 | F | 5.8 | c.13450C > T | p.R4484X | nonsense | Pathogenic |
| 18 | KAB20 | M | 1.8 | c.4143G > A | p.V1381V | synonymous | VUS |
| 19 | KAB21 | M | 13.4 | c.401-11delC | intronic | Likely Benign | |
| 20 | KAB22 | M | 6.3 | c.12913G > A | p.V4305I | missense | Likely Benign |
| 21 | KAB23 | F | 4.3 | c.15108_15110del3 | p.H5036_E5037delinsQ | in-frame deletion | VUS |
| 22 | KAB24 | F | 9.3 | c.7933C > T | p.R2645X | nonsense | Pathogenic |
| 23 | KAB25 | M | 7.7 | c.13644C > T | p.S4548S | synonymous | Benign |
| 24 | KAB26 | F | 9.1 | c.8382C > A | p.G2794G | synonymous | Likely Benign |
| 25 | KAB27 | M | 10.8 | c.2438C > T | p.P813L | missense | Benign |
| 26 | KAB28 | F | 14.4 | c.15540G > C | p.V5180V | synonymous | Likely Benign |
| 27 | KAB29 | F | 1.3 | c.16229G > A | p.G5410E | missense | VUS |
| 28 | KAB30 | M | 2.8 | c.4265G > C | p.W1422S | missense | VUS |
| 29 | KAB31 | M | 21.6 | c.16294C > T | p.R5432W | missense | Likely Pathogenic |
| 30 | KAB32 | F | 6.7 | c.13059delG | frame-shift | Pathogenic | |
| 31 | KAB33 | M | 1.9 | c.839+1delG | splice-site | Pathogenic | |
| 32 | KAB34 | F | 9.3 | c.5868-25G > A | intronic | Likely Benign | |
| 33 | KAB35 | F | 9.2 | c.1938C > G | p.P646P | synonymous | Likely Benign |
| 34 | KAB36 | F | 3.9 | c.15844C > T | p.R5282X | nonsense | Pathogenic |
| 35 | KAB37 | F | 0.0 | c.8488C > T | p.R2830X | nonsense | Pathogenic |
| 36 | KAB39 | F | 3.6 | c.15641G > T | p.R5214L | missense | VUS |
| 37 | KAB40 | F | 1.4 | c.3907-15C > G | intronic | Likely Benign | |
| 38 | KAB41 | F | 3.8 | c.4168dupG | frame-shift | Pathogenic | |
| 39 | KAB42 | M | 4.3 | c.15289C > T | p.R5097X | nonsense | Pathogenic |
| 40 | KAB43 | M | 1.2 | c.11750_11758del9 | in-frame deletion | VUS | |
| 41 | KAB44 | M | 2.6 | c.4419-2A > G | splice-site | Pathogenic | |
| 42 | KAB45 | M | 7 | c.1801_1822dup 22 | frame-shift | Pathogenic |
All the mutations are heterozygous. ACMG: American College of Medical Genetics Guidelines. VUS: variants of unknown significance.
DNA methylation epi-signature of KS patients with pathogenic mutations in KMT2D
From a total of 421,509 CpG probes in the Illumina Infinium HumanMethylation450 BeadChip (450K) array that passed the quality control, 1,504 probes were found to have >10% methylation difference between the KS patients and controls with multiple testing corrected P value < 0.01, adjusted for blood cell type compositions using limma regression modeling, which is particularly important given the relatively common occurrence of immune anomalies in patients with Kabuki syndrome (Table S1). Hierarchical clustering of these probes revealed a complete separation of the patients from all of the controls (Figure S1). Most of these probes were hypomethylated in the KS samples relative to the controls (856 hypomethylated vs. 648 hypermethylated, Table S1). The majority of these sites (n = 1,053) were located inside or nearby CpG islands. A total of 383 overlapped with enhancer elements, and 251 were located at regions recognized as a DNase I hypersensitive site (Table S1).
Mapping of differentially methylated genomic regions in KS patients with pathogenic mutations in KMT2D
Using a “bump hunting” approach, we identified 24 genomic coordinates containing a minimum of 3 CpG probes, an average regional methylation difference >0.10, and a family-wise error rate (FWER) <0.01 (Table 2). The vast majority of these regions overlaps protein coding genes and close to three-quarter overlap a CpG island (n = 16). Among these regions, Chr19: 8,591,354-8,591,786, annotating to exons 22–23 and intron 22 of the MYO1F gene is the most differentially methylated region (>29% hypomethylation; Fig. 1), and Chr7: 27,182,493-27,183,946, overlapping with the promoters of HOXA5 and HOXA-AS3, is the longest region with a differential methylation pattern (20 probes, 1,453 bp).
Table 2.
Genomic regions containing multiple probes differentially methylated between the patients with KMT2D loss of function and controls.
| Coordinates | Methylation difference | Probes | FWER | Overlapping Genes | CpG island |
|---|---|---|---|---|---|
| chr19: 8591364–8591776 | −0.29 | 4 | 0 | MYO1F | Yes |
| chr7: 27182493–27183946 | 0.19 | 20 | 0 | HOXA_AS3; HOXA5 | Yes |
| chr7: 30635762–30636176 | −0.19 | 4 | 0 | GARS | |
| chr15: 29968032–29968195 | 0.19 | 3 | 0 | BC043570; LOC100130111 | |
| chr5: 61028265–61028748 | 0.18 | 4 | 0.001 | ||
| chr11: 65360123–65360327 | −0.18 | 3 | 0.002 | Yes | |
| chr1: 36787356–36787932 | 0.17 | 3 | 0.01 | SH3D21 | Yes |
| chr2: 206628553–206628692 | 0.17 | 3 | 0.003 | NRP2 | |
| chr5: 1849983–1850261 | 0.17 | 3 | 0.005 | ||
| chr5: 1856713–1857477 | 0.17 | 4 | 0.001 | LINK02116 | Yes |
| chr8: 1321333–1321727 | 0.17 | 4 | 0.002 | DLGAP2 | Yes |
| chr12: 58119915–58120635 | −0.17 | 7 | 0 | AGAP2 | Yes |
| chr19: 49001890–49002477 | 0.17 | 3 | 0.01 | LMTK3 | Yes |
| chr1: 227746191–227746882 | 0.16 | 4 | 0 | ZNF678 | Yes |
| chr2: 218843435–218843735 | −0.16 | 3 | 0.01 | TNS1 | Yes |
| chr7: 27184369–27184521 | 0.16 | 7 | 0 | HOXA_AS3 | Yes |
| chr7: 4778839–4779225 | 0.16 | 4 | 0.001 | FOXK1 | |
| chr12: 53343514–53343849 | 0.16 | 3 | 0.005 | KRT8; KRT18 | |
| chr14: 103593503–103593520 | −0.16 | 3 | 0.009 | TNFAIP2 | Yes |
| chr18: 7011217–7011463 | −0.16 | 4 | 0.003 | LAMA1 | Yes |
| chr19: 49000743–49000998 | 0.16 | 3 | 0.006 | LMTK3 | Yes |
| chr1: 228658371–228659093 | 0.15 | 5 | 0.001 | Yes | |
| chr3: 49170496–49171051 | 0.15 | 7 | 0.002 | LAMB2 | |
| chr7: 27170241–27170892 | −0.15 | 13 | 0 | HOXA4 | Yes |
The table represents 24 regions with at least 10% average methylation change and FWER<0.01. The regions are sorted according to the absolute methylation difference. Difference: mean regional β values in patients vs. controls. FWER: family-wise error rate.
Figure 1.
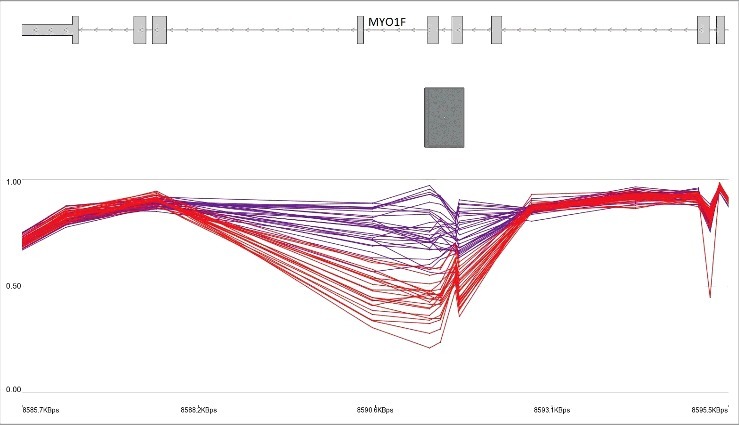
Hypomethylation of MYO1F gene body in KS patients with KMT2D loss of function mutations. The top track represents the gene transcript. The middle track (rectangle) shows a CpG island. The lower track shows the average methylation levels ranging 0–1 for controls (purple) and KS patients with loss of function (red). Every breakpoint in the lines shows a CpG probe.
Evaluation of subjects with VUS and benign variants in KMT2D using the epi-signature
Assessment of the identified regions in Table 2 revealed that the samples with a demonstrated benign or likely benign variants had a similar methylation pattern as the controls, whereas the average methylation levels from those with VUS did not align with either of the groups and tended to stay in between (Fig. 2). This suggested that carriers of VUS must belong to either of the two classes. A determination was made of whether the hierarchical clustering using the identified CpG probes (Table S1) could differentiate the KS patients with KMT2D loss of function mutations from the samples with benign variants. The inclusion of the 11 samples with likely benign or benign variants into the clustering resulted in grouping all of them with the normal cohort, whereas the VUS variants clustered with either the patients or controls (Fig. 3). These observations suggested that the DNA methylation signature of the KS patients has the potential to be used as a diagnostic method for differentiating the samples with pathogenic mutations from those with benign variants.
Figure 2.
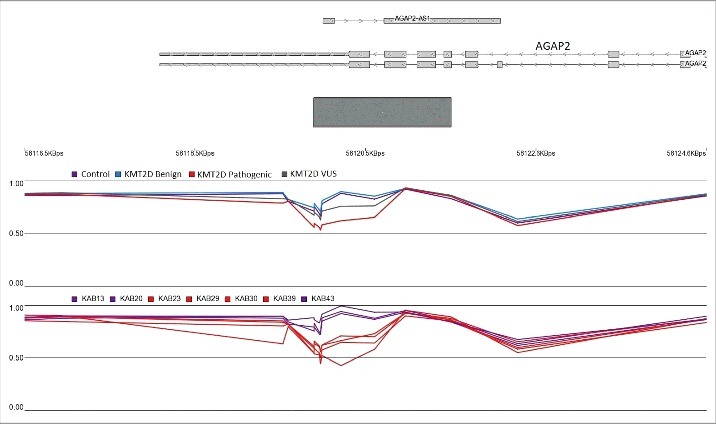
Hypomethylation of AGAP2 body and 3’UTR in KS patients with KMT2D loss of function mutations. The top track represents the gene transcript. The gray rectangle denotes a CpG island. The middle and lower tracks show the average methylation levels ranging 0–1. Every breakpoint in the lines represents a CpG probe. The top methylation track shows that the average methylation level in subjects with benign variants (blue) is comparable to the healthy controls (purple), while the mean methylation levels of those with VUS (gray) are located in between the two groups. Individual examinations of the seven VUS variants in the lower methylation track reveal that, indeed, four of the patients (red) have a methylation level similar to the KMT2D loss of function group, while the remaining three (purple) resemble the normal cohort.
Figure 3.
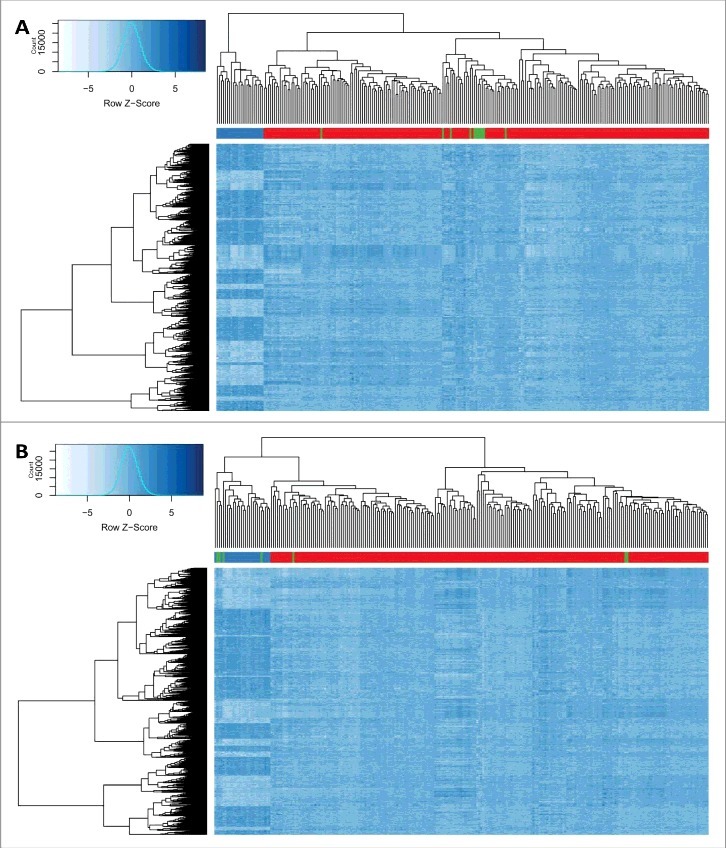
Hierarchical clustering of subjects with KMT2D pathogenic, benign and VUS variants and controls. Rows represent 1,504 CpG probes. Dark blue shows higher methylation, while light blue represents lower levels of methylation. The color is indexed by the rows. (A) columns represent 24 KS samples with KMT2D loss of function mutations (blue bar), 216 controls (red bar), and 11 individuals with benign or likely benign variants (green bar) (B) columns represent 24 KS samples with KMT2D loss of function mutations (blue bar), 216 controls (red bar), and 7 individuals with variants of unknown significance (green bar). All carriers of benign and three VUS variants are clustered with the controls, whereas the other four VUS carriers are grouped with the patients.
Development of a classification model for prediction of variant pathogenicity
To develop a classification model with functionality of variant classficiation, a support vector machine (SVM) with linear kernel was trained using a subset of 142 most differentiating and non-redundant probes selected from the epi-signature of KS patients (Tables S2 and S3). The model was set to generate a classification score between 0–1 as the probability of having a methylation profile related to Kabuki syndrome. We call this “methylation variant pathogenicity” (MVP) score. Cross-validation of this model revealed an accuracy of 100%, and it correctly predicted all of the 24 patients and 216 controls that were used for its training (Fig. 4).
Figure 4.
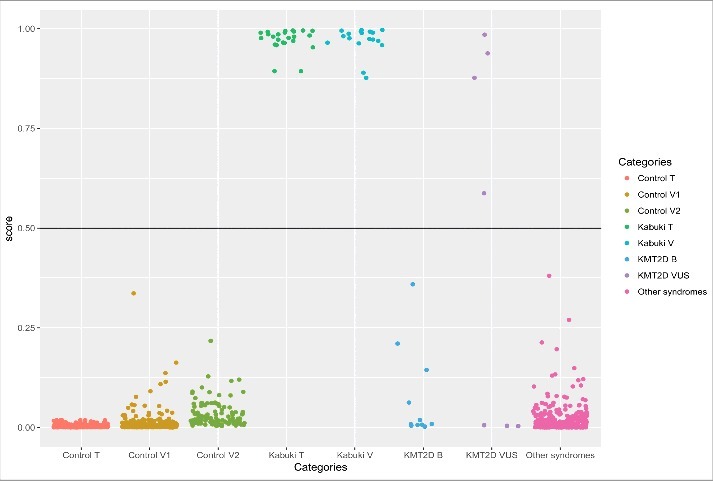
Probability scores generated by the classification model. Control T: 216 controls used to describe the signature and train the model. Control V1: 288 controls used to measure the specificity of the model. Control V2: 125 controls downloaded from the GEO to confirm the specificity of the model. Kabuki T: 24 Kabuki patients with pathogenic mutations in KMT2D used for identification of the signature and training of the model. Kabuki V: 19 Kabuki patients with pathogenic mutations in KMT2D downloaded from GEO to measure the sensitivity of the model. KMT2D B: 11 individuals with benign variants in KMT2D. KMT2D VUS: 7 samples with variants of unknown significance in KMT2D. Other syndromes: 241 patients with confirmed clinical and molecular diagnosis of various Mendelian disorders resulting from defects in epigenomic machinery. Y-axis represents scores 0–1, with higher scores indicating a higher chance of carrying a pathogenic mutation leading to Kabuki syndrome as stratified by categories in X-axis. By default, the SVM classifier defines a cut-off of 0.5 for predicting the class; however, the vast majority of the tested individuals received a score close to 0 or 1. Therefore, for the purpose of better visualization, the points are jittered.
Sensitivity and specificity of the classification model for Kabuki syndrome
To determine the sensitivity of our model in detecting Kabuki patients, we downloaded a total of 20 450K methylation array files publically available from the Gene Expression Omnibus (GEO) database (accession ID: GSE97362) belonging to the peripheral blood of Kabuki patients with confirmed pathogenic mutations in KMT2D (n = 19) and KDM6A (n = 1), and supplied them to our classification model. All of these patients received a score of close to 1, suggesting that our model is not only 100% sensitive for detecting KS resulting from pathogenic mutations in KMT2D, but also can detect KS caused by mutations in KDM6A. To estimate the specificity of our method, we used 292 normal samples from our reference cohort that were not used for epigenomic profiling of the KS patients or training the classification model. In addition, we downloaded the methylation data from a set of 125 healthy subjects available publically from the GEO (accession ID: GSE97362). All of these samples received very low scores by our model (Fig. 4), suggesting that this model is 100% specific to KS patients using these two confirmation datasets.
The classification model for KS is not sensitive to other diseases of epigenomic machinery
To determine whether this model can distinguish the epigenomic profile of Kabuki patients from other syndromes resulting from defects in the epigenomic machinery, we supplied the model with a cohort of 241 samples from our dataset composed of patients with both clinical and molecular diagnoses of Alpha-Thalassemia X-Linked Intellectual Disability syndrome (ATRX, n = 19), Floating Harbour syndrome (n = 17), CHARGE syndrome (n = 83), DNMT1-associated autosomal dominant cerebellar ataxia, deafness, and narcolepsy (n = 5), Sotos syndrome (n = 38), Coffin-Lowry syndrome (n = 11), Coffin-Siris syndrome (n = 9), X-linked syndromic mental retardation Claes-Jensen Type (n = 10), Weaver syndrome (n = 7), Saethre-Chotzen syndrome (n = 25), and Rett syndrome (n = 17). Details of this cohort are presented in Table S4. All of these patients received low scores for having a pathogenic mutation in KMT2D, further indicating that our classification model is 100% specific to Kabuki syndrome (Fig. 4) and it is not sensitive to other Mendelian disorders that result from the disruption of the epigenomic machinery.
Reclassification of KMT2D variants of unknown significance
First, the model was assigned to score 11 subjects with clinical features similar to KS but no pathogenic mutations in KMT2D. As expected, all of them received low scores (Fig. 4). Next, the seven patients with VUS were tested. The model predicted a high score for four of the patients to carry a pathogenic mutation and a probability of <0.01 for the remaining of them (Table 3, Fig. 4). In the hierarchical clustering, the same four patients grouped with the loss of function mutation carriers and the other three were clustered with controls (Fig. 3). As well, evaluations of the genomic regions designated the same classification to these variants. Fig. 2 shows that, in the promoter of AGAP2, the four subjects that were predicted to have a pathogenic mutation in KMT2D presented similar methylation levels to Kabuki patients, whereas the other three had a methylation pattern similar to controls. To further confirm these finding, we performed an in silico analysis and re-evaluated the available clinical information (Table 3). All of the seven patients had overlapping clinical features, including facial dysmorphism and intellectual disability/developmental delay, similar to those seen in Kabuki syndrome, and, thus, this information could not be used to distinguish them. Therefore, we mainly relied on in silico analysis to confirm the re-classification. Three of the four mutations that were predicted as pathogenic were located at the highly conserved nucleotide and protein domains with deleterious effects on phenotype as suggested by SIFT and Mutation Taster. The mutations in two of these individuals were also reported to be de novo. Two of the other three mutations that were re-classified as benign were predicted as not exerting a deleterious effect on phenotype or not being located in conserved domains. None of these three mutations were reported to be de novo. For two of the variants, in silico prediction was not possible since they were inducing an in-frame change. Overall, these evaluations were in concordance with the predictions made by our epigenetic classification model (Table 3).
Table 3.
Reclassification of seven variants of unknown significance.
| Sample ID | cDNA Nomenclature | Protein Change | Mutation Type | Hierarchical Clustering | MVP Score | de novo | pyloP (Nucleotide Conservation Score) | Amino Acid Conservation | Protein Domain | SIFT | Mutation Taster |
|---|---|---|---|---|---|---|---|---|---|---|---|
| KAB13 | c.12889T>C | p.S4297P | missense | Benign | 0 | NA | −0.12 (not conserved) | Weakly conserved | NA | Tolerated | Polymorphism |
| KAB20 | c.4143G>A | p.V1381V | synonymous | Benign | 0 | NA | −0.12 (not conserved) | No change | NA | NA | NA |
| KAB23 | c.15108_15110del3 | p.H5036_E5037delinsQ | in-frame deletion | Pathogenic | 0.98 | NA | NA | NA | NA | NA | NA |
| KAB29 | c.16229G>A | p.G5410E | missense | Pathogenic | 0.94 | yes | 5.69 (highly conserved) | Highly conserved | SET | Deleterious | Disease causing |
| KAB30 | c.4265G>C | p.W1422S | missense | Pathogenic | 0.59 | yes | 5.45 (highly conserved) | Highly conserved | Zinc Finger | Deleterious | Disease causing |
| KAB39 | c.15641G>T | p.R5214L | missense | Pathogenic | 0.88 | NA | 5.69 (highly conserved) | Highly conserved | FY-rich, N-terminal | Deleterious | Disease causing |
| KAB43 | c.11750_11758del9 | in-frame deletion | Benign | 0.01 | NA | NA | NA | NA | NA | NA |
NA: In silico prediction not applicable or no information available.
Discussion
In this study, we have reported the global DNA methylation changes in a large cohort of Kabuki patients with confirmed pathogenic KMT2D mutations. It is worthwhile to emphasize that this study is built on a population size of 24 confirmed patients, which, given the rarity of the condition (1 in 32,000 birth), is a considerable sample size. Our analysis has found a signature fully sensitive and specific to the patients with Kabuki syndrome, which can precisely differentiate KS resulting from the KMT2D loss of function mutations from healthy individuals or those with the KS-like presentations of other etiologies. Also, we have identified multiple genomic regions showing significant methylation changes among the Kabuki patients. These findings are consistent with previous studies on other diseases of chromatin remodeling as well as the recent report on methylation changes in Kabuki syndrome.17 In this manuscript, we have used an independent data set to identify a unique epi-signature associated with Kabuki syndrome. During the study, Bucher et al. published an independent data set that we used to confirm our findings.17 Confirmation of the overlap in the findings presented in this study with the independent data set described by Butcher et al. provides further evidence of the robustness of these findings and consequent conclusions. We have previously showed that unique epi-signatures exist in a number of conditions resulting from the disruption of epigenomic machinery, and have also shown that DNA methylation profiling by microarray can be used in the clinical diagnosis of many Mendelian and imprinting disorders.14–16,18–21 Our current study demonstrates the novel finding that the epi-signature of Kabuki syndrome is not sensitive to the epi-signature of other developmental conditions resulting from the disruption of epigenomic machinery. These results further support the hypothesis that loss of function of KMT2D in KS patients generates an epi-signature unique to patients carrying these mutations, presumably due to crosstalk between cellular pathways responsible for establishing reversible histone modifications and DNA methylation patterns.
The protein encoded by KMT2D is involved in the methylation of H3K4 histone marks, which has a direct role in blocking DNA methylation, opening the chromatin state, and regulating numerous downstream genes.22 KMT2D belongs to the mixed-lineage leukemia gene family that controls other genes essential for embryonic development, such as the HOX genes. It is of interest to note that numerous probes that were differentially methylated in our study annotate to multiple HOX genes. Also, the longest differentially methylated region in this study overlaps the promoter of HOXA5 (Table 2). Butcher et al. also found hypermethylation of the same gene region in both Kabuki and CHARGE syndromes, two conditions with overlapping clinical features.17 KMT2D has specifically been shown to regulate the expression of a number of HOX genes, which are required for normal body segmentation and anterior-posterior patterning of the brain during development.23,24 Zebrafish engineered with a KMT2D knockout presents with a reduced posterior body length and abnormal curvature of the spine, along with notochord degeneration and variable expression of HOX genes.27 Interestingly, spinal cord defects, such as scoliosis and spina bifida occulta, are common findings in Kabuki patients, which are observed in up to 35% of the subjects.28
Of the other regions that we found differentially methylated in Kabuki patients is a segment in the MYO1F gene body. This region has lost methylation by about 30% relative to controls, and it is the most differentially methylated segment that we found in Kabuki patients. Butcher et al.17 also report the same pattern of hypomethylation in the Kabuki patients for this region. Interestingly, in our previous study on patients with Floating-Harbor syndrome, which belongs to another class of diseases of epigenomic machinery, we found the same region to be significantly hypomethylated in patients.14 It is not clear how this methylation pattern is related to the clinical presentations of patients with Floating Harbor or Kabuki. MYO1F encodes a class of myosin that is expressed in the inner ear.29 This product does not appear to be of any biological relevance to Kabuki or Floating Harbor patients. However, the identified region in MYO1F is annotated to a CpG island that contains regulatory features, including enhancer or promoter in various cell lines. This methylation pattern may be a signal of the regulatory mechanisms yet to be understood in chromatin remodeling and histone modifications.
In addition to the partial overlap between the epi-signatures described by Butcher et al. and us, this study has identified additional regions with significant methylation differences that were previously not reported. Specifically, this study identified approximately 1,500 significant probe sets. From these, 142 probes are used for building a classification model, 45 of which were amongst the roughly 200 significant probes reported by Butcher et al. The differences between the two studies might suggest a degree of heterogeneity in the molecular etiology of this condition, which needs to be further investigated. An alternative possibility is that larger cohort of cases and controls in this study, compared to the previous report, may have enabled an increased statistical power in detection of regions with increased signal variability.
Nevertheless, the shared and replicated regions across different cohorts and diseases discussed here points to the overlapping biological mechanism between all diseases caused by defects in epigenomic machinery and raises the question of how specific is the epigenetic signature we report here to Kabuki syndrome. We tried to answer this question by testing 241 samples with various diseases of epigenomic machinery, including CHARGE and Floating-Harbor syndromes, using our classification model, which is built on the epigenetic signature of the Kabuki patients. The model predicted all of those samples as not having a methylation profile similar to Kabuki patients. This interesting finding suggests that although the core processes in many of such epigenetic diseases can be overlapping, the downstream changes are disease specific. This is further supported by the data from a patient with KDM6A mutation being predicted as Kabuki using the same model that is built on the epigenetic signature of KMT2D mutations. Butcher et al.17 previously demonstrated the same prediction for this single patient. The immediate target of these two genes is not overlapping; however, they mutually regulate a large number of genes downstream,30 and their disruption leads to a single medical condition with indistinguishable clinical features, further suggesting that the epigenetic profile of the Kabuki patients is mostly composed of the downstream changes unique to the disease rather than the primary epigenomic event. This will have a direct clinical application.
Perhaps the most exotic utility of this study is the re-classification of variants of unknown significance (VUS) and resolving the unsolved cases where the sequence variants alone do not provide a definitive answer. The clinical diagnosis of KS is challenging. The mutation screening of KDM6A and KMT2D only identifies pathogenic mutations in 70% of patients with KS.4 The remaining patients might carry pathogenic mutations in non-coding regions that are often not screened (e.g., promoter, intron) or have missense and in-frame insertions/deletions that are usually classified as VUS. Classification and interpretation of such variants is a challenge in molecular diagnostics and genetic counseling, despite the fact that they can induce protein truncation through altering the protein synthesis, stability, posttranslational modification, and interaction with other proteins, or induce haploinsufficiency through a dominant-negative effect.31 This study provides further confirmation of the previously published approaches for identification of epi-signatures and assessment of pathogenicity of genetic variants by using epi-signatures in genetic disorders.14-18 Our classification model with 142 CpG probes has an optimal performance, with 100% sensitivity and specificity in predicting the chance of a patient carrying a pathogenic mutation causing KS, and can be used as a low-cost, accurate clinical test for these patients. This classification model identified four patients with previously ambiguous variant classes as having pathogenic mutations (Table 2). According to the ACMG guidelines,32 the chance of a variant being pathogenic increases if it is proved to be de novo. In compliance with this, the only two de novo variants among the VUS patients were reclassified as pathogenic. It is also assumed that synonymous variants are less likely being pathogenic and the only one of its kind among the seven VUS was reclassified as benign. This KS-specific “methylation variant pathogenicity (MVP)” score was consistent with in silico predictions for all four missense VUS variants, including nucleotide and protein conservation score and the presence of functional domains along with SIFT and MutationTaster pathogenicity predictions. In silico analyses including tools such as SIFT, Polyphen, Protein or nucleic acid conservation scores, and Splice prediction algorithms to name a few, are not considered conclusive evidence in the assessment of variants of unknown clinical significance in clinical genetic variant assessment. The American College of Medical Genetics and Genomics and the Association for Molecular Pathology Standards and Guidelines for the interpretation of sequence variants32 do not recommended that these predictions be used as the sole source of evidence to make a clinical assertion; rather, they recommend to use them as supplemental to other findings, including family segregation or functional evidence. The epigenetic MVP score that we presented here could be used as an additional analysis to these tools with the unique advantage that it can also be applied for assessment of in-frame deletions and duplications that are not amenable to be assessed by SIFT and PolyPhen. Due to a shortage of functional experimental evaluation and co-segregation analyses in multiple families, these in-frame variants are often difficult to classify in a clinical setting. Interestingly, the MVP showed a clear difference between the two in-frame mutations, with c.15108_15110del3 being classified as pathogenic and c.11750_11758del9 presenting as a benign variant, which has also been observed with allele frequency above 0.01 in the South Asian population (SAS) from the ExAC variant database. Therefore, it can be concluded that the variants that are not classified as pathogenic using the epi-signature reported here do not result in KS, and patients carrying them are most likely KS-like phenocopies.
These findings will have a potential application in the molecular diagnostics of KS and the methods used in this study can be further expanded to other conditions resulting from the mutations in the genes that regulate the epigenetic machinery. Together, these data not only suggest that a mutation in an epigenetic regulator can lead to deficits in downstream developmental pathways that result in a defined clinical syndrome, but also create germ line epigenetic traces retained in other cell types, such as peripheral blood leucocytes. In fact, our data further supports the ability of such epigenetic signatures to be a functional readout of protein function, by delineating between benign and pathogenic mutations in that protein. Such an approach of matching unique gene variants with epigenetic signatures may provide novel profiles that better elucidate biochemical pathways within an individual syndrome. In addition, identifying a common molecular basis across seemingly unrelated clinical disorders could lead to enhanced targeted treatments that have broader clinical applications.
Methods
Study population
Peripheral blood samples from patients referred for genetic testing at the Greenwood Genetic Center were collected for methylation study. Genetic variants were interpreted according to the American College of Medical Genetics Guidelines for interpretation of genomic sequence variants.32 The mutation status of all of the patients is shown in Table 1. Age of the patients was recorded at the time of blood draw. A group of age- and sex-matched controls was selected from our lab reference cohort of individuals with no known aberrant epigenomic change. This reference cohort includes individuals that were previously preselected from a larger cohort of about 1000 individuals across the broad range of age, sex, and ethnicity distribution. The methylation analysis of these individuals was performed in the same facility as that of patients, and the same data processing pipeline was used for all of them. Selection of the matched group of controls for the patients was done using MatchIt package in R 3.4.
Methylation array and quality assessment
Genomic DNA was extracted from peripheral blood using standard techniques. Following bisulfite conversion, DNA methylation analysis was performed using the Illumina HumanMethylation450 BeadChip (San Diego, CA), according to the manufacturer's protocol, at the Genetic and Molecular Epidemiology Laboratory at McMaster University and the London Health Sciences Molecular Genetic Laboratory. This array covers above 485,000 human genomic methylation CpG sites, including 99% of RefSeq genes and 96% of CpG islands. Methylated and unmethylated intensity data were generated as idat files and imported into R 3.4.0 for analysis. Normalization was performed using Illumina normalization method with background correction using minfi package in R 3.4.0.33 Probes with detection P value >0.01 were excluded from the downstream analysis. For further quality improvement, probes located on chromosomes X and Y, probes known to contain SNPs at the CpG interrogation or the single nucleotide extension, and probes known to cross-react with sex chromosomes34 were removed. In addition, samples representing discordance between the predicted and labeled sex were not used in the analysis. All of the samples were examined for genome-wide methylation density, and those deviating from the bimodal distribution were excluded. A factor analysis using principle component analysis was performed to rule out the possibility of a batch effect or other sources of variability.
Identification of the methylation epi-signature
The methylation levels for each probe were measured as β value, calculated from the ratio of the methylated signals vs. the sum of unmethylated and methylated signals, ranging between 0 (no methylation) and 1 (full methylation). This value was used for biological interpretation and visualization. For the purpose of statistical analysis, wherever a normal distribution was required, β values were transformed to M values using the following equation: log2[β/(1-β)]. To identify the differentially methylated probes, a linear regression modeling using the limma package was used.35 The analysis was adjusted for blood cell type compositions predicted using minfi package. The generated P values were moderated using the eBayes function in limma package and corrected for multiple testing using Benjamini and Hogberg method. Probes with a corrected P value < 0.01 and a methylation difference greater than 10% were considered significant. The identified signature was examined using unsupervised hierarchical clustering to determine its ability in separating the patients from controls.
Identification of regions with methylation changes
To find genomic regions harboring methylation changes a bump hunting approach was used by the bumphunter package.36 The analysis considered regions with greater than 10% change in the overall methylation between cases and controls with gaps no more than 500 bp among neighboring CpGs. As suggested by the package, 1000 bootstrapping procedure was performed to compute family-wise error rate (FWER). We selected regions containing a minimum of three consecutive probes and FWER <0.01. The identified regions were mapped to CpG islands and coding genes. Partek Genomic Suite 6.6 was used for visualization of the identified regions.
Constructing and validating a classification model for Kabuki syndrome
The identified signature was used to build a classification model for Kabuki syndrome. Caret package37 was used for feature selection from the signature. First, a receiver's operating characteristic curve analysis was performed to identify the most differentiating probes. Those probes with an Area Under the Curve (AUC) above 0.95 were retained. Next, pairwise correlations among the remaining probes were measured to identify and exclude the redundant signals with R-squared cut-off >0.95. A support vector machine with linear kernel was trained on the remaining probes using e1071 package.38 To determine the best hyper-parameters and to measure the accuracy of the model, a 10-fold cross-validation was performed. The model was set to generate a classification score between 0–1 as the probability of having a methylation profile related to Kabuki syndrome. To assess the sensitivity of the model, a cohort of DNA methylation array of Kabuki patients from the GEO public dataset (accession ID: GSE97362) was downloaded and supplied to our model. To determine the specificity, we supplied a large cohort of healthy samples from our cohort and the GEO (accession ID: GSE97362) to the model. To understand whether the signature of Kabuki syndrome is sensitive to other diseases of epigenomic machinery, we tested a group of patients with confirmed molecular and clinical diagnosis of various diseases of such kind other than Kabuki syndrome using the constructed model. These included patients with DNMT1-associated autosomal dominant cerebellar ataxia, deafness, and narcolepsy, ATRX, and Floating Harbor syndrome, collected from Children's Hospital of Eastern Ontario. Samples from patients with Saethre-Chotzen Syndrome, Coffin Siris syndrome, Coffin Lowry syndrome, Rett syndrome, Claes-Jensen syndrome, and CHARGE syndrome were collected from the Greenwood Genetic Center. The same methylation array procedures as described earlier were conducted for these samples. The CHARGE cohort was supplemented by methylation array files publically available from the GEO (GSE97362). Patients with Sotos and Weaver syndromes were also downloaded from the GEO (GSE74432) and added to this cohort. The details of this cohort are presented in Table S4.
Assessing variants of unknown significance
The approved model was used to perform a prediction on the KS patients with variants of unknown significance in KMT2D. The patients were then further assessed according to the available medical history, and the variants were analyzed in silico. These findings were compared with the outcome of the classification model.
Ethics statement
De-identified and anonymized DNA samples from patients submitted for diagnostic testing at Greenwood Genetic Center were provided for this study. This study has been approved by the Western University Research Ethics Boards (REB ID 106302) and the Hamilton Integrated Research Ethics Board (REB ID 13-653-T).
Supplementary Material
Conflict of interest
The authors do not have any competing interest to declare.
Acknowledgments
We thank the families, the molecular genetics diagnostic laboratory at the Greenwood Genetic Center for identifying the mutations in the KS patients and the clinical geneticists at the Greenwood Genetic Center for making the clinical diagnoses. Dedicated to the memory of Ethan Francis Schwartz, 1996–1998
References
- 1.Fahrner JA, Bjornsson HT. Mendelian disorders of the epigenetic machinery: tipping the balance of chromatin states. Annu Rev Genomics Hum Genet. 2014;15:269-93. doi: 10.1146/annurev-genom-090613-094245. PMID:25184531 [DOI] [PMC free article] [PubMed] [Google Scholar]
- 2.Bjornsson HT. The Mendelian disorders of the epigenetic machinery. Genome Res. 2015;25:1473-81. doi: 10.1101/gr.190629.115. PMID:26430157 [DOI] [PMC free article] [PubMed] [Google Scholar]
- 3.Cheon CK, Ko JM. Kabuki syndrome: clinical and molecular characteristics. Korean J Pediatr. 2015;58:317-24. doi: 10.3345/kjp.2015.58.9.317. PMID:26512256 [DOI] [PMC free article] [PubMed] [Google Scholar]
- 4.Bögershausen N, Gatinois V, Riehmer V, Kayserili H, Becker J, Thoenes M, Simsek‐Kiper PÖ, Barat‐Houari M, Elcioglu NH, Wieczorek D, Tinschert S. Mutation Update for Kabuki Syndrome Genes KMT2D and KDM6A and Further Delineation of X‐Linked Kabuki Syndrome Subtype 2. Hum Mutat. 2016;37(9): 847-64. doi: 10.1002/humu.23026. PMID:27302555 [DOI] [PubMed] [Google Scholar]
- 5.Cheon CK, Sohn YB, Ko JM, Lee YJ, Song JS, Moon JW, Yang BK, Ha IS, Bae EJ, Jin HS, Jeong SY. Identification of KMT2D and KDM6A mutations by exome sequencing in Korean patients with Kabuki syndrome. J Hum Genet. 2014;59:321-25. doi: 10.1038/jhg.2014.25. PMID:24739679 [DOI] [PubMed] [Google Scholar]
- 6.Bögershausen N, Wollnik B. Unmasking Kabuki syndrome. Clin Genet. 2013;83(3): 201-11. doi: 10.1111/cge.12051. PMID:23131014 [DOI] [PubMed] [Google Scholar]
- 7.Prasad R, Zhadanov AB, Sedkov Y, Bullrich F, Druck T, Rallapalli R, Yano T, Alder H, Croce CM, Huebner K, Mazo A. Structure and expression pattern of human ALR, a novel gene with strong homology to ALL-1 involved in acute leukemia and to Drosophila trithorax. Oncogene. 1997;15(5): 549-60. doi: 10.1038/sj.onc.1201211. PMID:9247308 [DOI] [PubMed] [Google Scholar]
- 8.Agger K, Cloos PA, Christensen J, Pasini D, Rose S, Rappsilber J, Issaeva I, Canaani E, Salcini AE, Helin K. UTX and JMJD3 are histone H3K27 demethylases involved in HOX gene regulation and development. Nature. 2007;449(7163):731-4. doi: 10.1038/nature06145. PMID:17713478 [DOI] [PubMed] [Google Scholar]
- 9.Issaeva I, Zonis Y, Rozovskaia T, Orlovsky K, Croce CM, Nakamura T, Mazo A, Eisenbach L, Canaani E. Knockdown of ALR (MLL2) reveals ALR target genes and leads to alterations in cell adhesion and growth. Mol Cell Biol, 2007;27:1889-903. doi: 10.1128/MCB.01506-06. PMID:17178841 [DOI] [PMC free article] [PubMed] [Google Scholar]
- 10.Dillon SC, Zhang X, Trievel RC, Cheng X. The SET-domain protein superfamily: protein lysine methyltransferases. Genome Biol. 2005;6(8):227. doi: 10.1186/gb-2005-6-8-227. PMID:16086857 [DOI] [PMC free article] [PubMed] [Google Scholar]
- 11.Schuettengruber B, Chourrout D, Vervoort M, Leblanc B, Cavalli G. Genome regulation by polycomb and trithorax proteins. Cell. 2007;128(4):735-45. doi: 10.1016/j.cell.2007.02.009. PMID:17320510 [DOI] [PubMed] [Google Scholar]
- 12.Denis H, Ndlovu MN, Fuks F. Regulation of mammalian DNA methyltransferases: a route to new mechanisms. EMBO Rep. 2011;12(7):647-56. doi: 10.1038/embor.2011.110. PMID:21660058 [DOI] [PMC free article] [PubMed] [Google Scholar]
- 13.Cedar H, Bergman Y. Linking DNA methylation and histone modification: patterns and paradigms. Nat Rev Genet. 2009;10(5):295-304. doi: 10.1038/nrg2540. PMID:19308066 [DOI] [PubMed] [Google Scholar]
- 14.Hood RL, Schenkel LC, Nikkel SM, Ainsworth PJ, Pare G, Boycott KM, Bulman DE, Sadikovic B. The defining DNA methylation signature of Floating-Harbor Syndrome. Sci Rep. 2016;6:38803. doi: 10.1038/srep38803. PMID:27934915 [DOI] [PMC free article] [PubMed] [Google Scholar]
- 15.Kernohan KD, Schenkel LC, Huang L, Smith A, Pare G, Ainsworth P, Boycott KM, Warman-Chardon J, Sadikovic B. Identification of a methylation profile for DNMT1-associated autosomal dominant cerebellar ataxia, deafness, and narcolepsy. Clin epigenetics. 2016;8(1):91. doi: 10.1186/s13148-016-0254-x. PMID:27602171 [DOI] [PMC free article] [PubMed] [Google Scholar]
- 16.Schenkel LC, Kernohan KD, McBride A, Reina D, Hodge A, Ainsworth PJ, Rodenhiser DI, Pare G, Bérubé NG, Skinner C, Boycott KM, Sadikovic B. Identification of epigenetic signature associated with alpha thalassemia/mental retardation X-linked syndrome. Epigenetics Chromatin. 2017;10(1):10. doi: 10.1186/s13072-017-0118-4. PMID:28293299 [DOI] [PMC free article] [PubMed] [Google Scholar]
- 17.Butcher DT, Cytrynbaum C, Turinsky AL, Siu MT, Inbar-Feigenberg M, Mendoza-Londono R, Chitayat D, Walker S, Machado J, Caluseriu O, Dupuis L. CHARGE and Kabuki Syndromes: Gene-Specific DNA Methylation Signatures Identify Epigenetic Mechanisms Linking These Clinically Overlapping Conditions. Am J Hum Genet. 2017;100(5):773-88. doi: 10.1016/j.ajhg.2017.04.004. PMID:28475860 [DOI] [PMC free article] [PubMed] [Google Scholar]
- 18.Schenkel LC, Rodenhiser D, Siu V, McCready E, Ainsworth P, Sadikovic B. Constitutional Epi/Genetic Conditions: Genetic, Epigenetic, and Environmental Factors. J Pediatr Genet. 2016;6(1):30-41. doi: 10.1055/s-0036-1593849. PMID:28180025 [DOI] [PMC free article] [PubMed] [Google Scholar]
- 19.Schenkel LC, Schwartz C, Skinner C, Rodenhiser DI, Ainsworth PJ, Pare G, Sadikovic B. Clinical validation of fragile X syndrome screening by DNA methylation array. J Mol Diagn. 2016;18(6):834-41. doi: 10.1016/j.jmoldx.2016.06.005. PMID:27585064 [DOI] [PubMed] [Google Scholar]
- 20.Schenkel LC, Rodenhiser DI, Ainsworth PJ, Paré G, Sadikovic B. DNA methylation analysis in constitutional disorders: clinical implications of the epigenome. Crit Rev Clin Lab Sci. 2016;53(3):147-65. doi: 10.3109/10408363.2015.1113496. PMID:26758403 [DOI] [PubMed] [Google Scholar]
- 21.Aref-Eshghi E, Schenkel LC, Lin H, Skinner C, Ainsworth P, Paré G, Siu V, Rodenhiser D, Schwartz C, Sadikovic B. Clinical validation of a genome-wide DNA methylation assay for molecular diagnosis of imprinting disorders. J Mol Diagn. 2017; in press doi: 10.1016/j.jmoldx.2017.07.002 [DOI] [PubMed] [Google Scholar]
- 22.Rose NR, Klose RJ. Understanding the relationship between DNA methylation and histone lysine methylation. Biochim Biophys Acta. 2014;1839(12):1362-72. doi: 10.1016/j.bbagrm.2014.02.007. PMID:24560929 [DOI] [PMC free article] [PubMed] [Google Scholar]
- 23.Guo C, Chang CC, Wortham M, Chen LH, Kernagis DN, Qin X, Cho YW, Chi JT, Grant GA, McLendon RE, Yan H. Global identification of MLL2-targeted loci reveals MLL2's role in diverse signaling pathways. Proc Nat Acad Sci. 2012;109(43):17603-8. doi: 10.1073/pnas.1208807109. PMID:23045699 [DOI] [PMC free article] [PubMed] [Google Scholar]
- 24.Holder NI, Hill JA. Retinoic acid modifies development of the midbrain-hindbrain border and affects cranial ganglion formation in zebrafish embryos. Development. 1991;113(4):1159-70. PMID:1811934 [DOI] [PubMed] [Google Scholar]
- 25.Agger K, Cloos PA, Christensen J, Pasini D, Rose S, Rappsilber J, Issaeva I, Canaani E, Salcini AE, Helin K. UTX and JMJD3 are histone H3K27 demethylases involved in HOX gene regulation and development. Nature. 2007;449(7163):731-4. doi: 10.1038/nature06145. PMID:17713478 [DOI] [PubMed] [Google Scholar]
- 26.Ansari KI, Hussain I, Shrestha B, Kasiri S, Mandal SS. HOXC6 Is transcriptionally regulated via coordination of MLL histone methylase and estrogen receptor in an estrogen environment. J Mol Biol. 2011;411(2):334-49. doi: 10.1016/j.jmb.2011.05.050. PMID:21683083 [DOI] [PMC free article] [PubMed] [Google Scholar]
- 27.Lan F, Bayliss PE, Rinn JL, Whetstine JR, Wang JK, Chen S, Iwase S, Alpatov R, Issaeva I, Canaani E, Roberts TM. A histone H3 lysine 27 demethylase regulates animal posterior development. Nature. 2007;449(7163):689-94. doi: 10.1038/nature06192. PMID:17851529 [DOI] [PubMed] [Google Scholar]
- 28.Matsumoto N Niikawa N. Kabuki make‐up syndrome: a review. Am J Med Genet C Semin Med Genet. 2003;117:57-65. doi: 10.1002/ajmg.c.10020 [DOI] [PubMed] [Google Scholar]
- 29.Zadro C, Alemanno MS, Bellacchio E, Ficarella R, Donaudy F, Melchionda S, Zelante L, Rabionet R, Hilgert N, Estivill X, Van Camp G. Are MYO1C and MYO1F associated with hearing loss?. Biochim Biophys Acta. 2009;1792(1):27-32. doi: 10.1016/j.bbadis.2008.10.017. PMID:19027848 [DOI] [PubMed] [Google Scholar]
- 30.Kim JH, Sharma A, Dhar SS, Lee SH, Gu B, Chan CH, Lin HK, Lee MG. UTX and MLL4 coordinately regulate transcriptional programs for cell proliferation and invasiveness in breast cancer cells. Cancer Res. 2014;74(6):1705-17. doi: 10.1158/0008-5472.CAN-13-1896. PMID:24491801 [DOI] [PMC free article] [PubMed] [Google Scholar]
- 31.Micale L, Augello B, Maffeo C, Selicorni A, Zucchetti F, Fusco C, De Nittis P Pellico MT, Mandriani B, Fischetto R, Boccone L. Molecular analysis, pathogenic mechanisms, and readthrough therapy on a large cohort of Kabuki syndrome patients. Hum Mut. 2014;35(7):841-50. doi: 10.1002/humu.22547. PMID:24633898 [DOI] [PMC free article] [PubMed] [Google Scholar]
- 32.Richards S, Aziz N, Bale S, Bick D, Das S, Gastier-Foster J, Grody WW, Hegde M, Lyon E, Spector E, Voelkerding K. Standards and guidelines for the interpretation of sequence variants: a joint consensus recommendation of the American College of Medical Genetics and Genomics and the Association for Molecular Pathology. Genet Med. 2015;17(5):405-23. doi: 10.1038/gim.2015.30. PMID:25741868 [DOI] [PMC free article] [PubMed] [Google Scholar]
- 33.Aryee MJ, Jaffe AE, Corrada-Bravo H, Ladd-Acosta C, Feinberg AP, Hansen KD, Irizarry RA. Minfi: a flexible and comprehensive Bioconductor package for the analysis of Infinium DNA methylation microarrays. Bioinformatics. 2014;30(10):1363-9. doi: 10.1093/bioinformatics/btu049. PMID:24478339 [DOI] [PMC free article] [PubMed] [Google Scholar]
- 34.Chen YA, Lemire M, Choufani S, Butcher DT, Grafodatskaya D, Zanke BW, Gallinger S, Hudson TJ, Weksberg R. Discovery of cross-reactive probes and polymorphic CpGs in the Illumina Infinium HumanMethylation450 microarray. Epigenetics. 2013;8(2):203-9. doi: 10.4161/epi.23470. PMID:23314698 [DOI] [PMC free article] [PubMed] [Google Scholar]
- 35.Ritchie ME, Phipson B, Wu D, Hu Y, Law CW, Shi W and Smyth GK “limma powers differential expression analyses for RNA-sequencing and microarray studies.” Nucleic Acids Res. 2015; 43(7): e47. doi: 10.1093/nar/gkv007. PMID:25605792 [DOI] [PMC free article] [PubMed] [Google Scholar]
- 36.Jaffe AE, Murakami P, Lee H, Leek JT, Fallin DM, Feinberg AP and Irizarry RA “Bump hunting to identify differentially methylated regions in epigenetic epidemiology studies.” Int J Epidemiol. 2012; 41(1): 200-209. doi: 10.1093/ije/dyr238. PMID:22422453 [DOI] [PMC free article] [PubMed] [Google Scholar]
- 37.Kuhn M. Caret package. J Stat Soft. 2008;28(5):1-26. [Google Scholar]
- 38.Meyer David, Dimitriadou Evgenia, Hornik Kurt, Andreas Weingessel, Friedrich Leisch. e1071: Misc Functions of the Department of Statistics, Probability Theory Group (Formerly: E1071), TU Wien. R package version. 2017;16-8. https://CRAN.R-project.org/package=e1071. [Google Scholar]
Associated Data
This section collects any data citations, data availability statements, or supplementary materials included in this article.