

ABSTRACT
Recent studies have demonstrated that dysregulation of macroautophagy/autophagy may play a central role in the pathogenesis of neurodegenerative disorders, and the induction of autophagy protects against the toxic insults of aggregate-prone proteins by enhancing their clearance. Thus, autophagy has become a promising therapeutic target against neurodegenerative diseases. In this study, quantitative phosphoproteomic profiling together with a computational analysis was performed to delineate the phosphorylation signaling networks regulated by 2 natural neuroprotective autophagy enhancers, corynoxine (Cory) and corynoxine B (Cory B). To identify key regulators, namely, protein kinases, we developed a novel network-based algorithm of in silico Kinome Activity Profiling (iKAP) to computationally infer potentially important protein kinases from phosphorylation networks. Using this algorithm, we observed that Cory or Cory B potentially regulated several kinases. We predicted and validated that Cory, but not Cory B, downregulated a well-documented autophagy kinase, RPS6KB1/p70S6K (ribosomal protein S6 kinase, polypeptide 1). We also discovered 2 kinases, MAP2K2/MEK2 (mitogen-activated protein kinase kinase 2) and PLK1 (polo-like kinase 1), to be potentially upregulated by Cory, whereas the siRNA-mediated knockdown of Map2k2 and Plk1 significantly inhibited Cory-induced autophagy. Furthermore, Cory promoted the clearance of Alzheimer disease-associated APP (amyloid β [A4] precursor protein) and Parkinson disease-associated SNCA/α-synuclein (synuclein, α) by enhancing autophagy, and these effects were dramatically diminished by the inhibition of the kinase activities of MAP2K2 and PLK1. As a whole, our study not only developed a powerful method for the identification of important regulators from the phosphoproteomic data but also identified the important role of MAP2K2 and PLK1 in neuronal autophagy.
KEYWORDS: autophagy, corynoxine, kinase activity, phosphoproteome, phosphorylation, protein kinase
Introduction
Autophagy is a cellular pathway for the degradation of long-lived proteins, aggregates and damaged organelles via lysosomes. In neurodegenerative diseases, proteins typically accumulate in the central nervous system as the disease progresses, and defective autophagy has been observed in the brains of patients with neurodegenerative diseases and in related animal models.1,2 Defective autophagy in neurons causes neurodegenerative disease-like phenotypes in mice3,4 whereas enhanced autophagy is found to be neuroprotective by promoting the clearance of disease-associated aggregates.5 Therefore, small-molecule autophagy enhancers have been suggested as potential drugs for the treatment of neurodegenerative diseases.6 Previously, we identified 2 neuroprotective autophagy enhancers, corynoxine (Cory)7 and corynoxine B (Cory B),8,9 from the Chinese herbal medicine Uncaria rhynchophylla (Gouteng). Although the structures of Cory and Cory B differ only in the stereochemistry of the spiro carbon, the manners in which they induce autophagy are quite different,7 and the reasons for this are still unclear.
Protein phosphorylation is one of the most important post-translational modifications in living cells and is involved in the regulation of a large number of biological processes, such as cell cycle, signal transduction, differentiation, proliferation, metabolism, and autophagy.10,11 Advances in proteomic technology with a rapid development of liquid chromatography-tandem mass spectrometry (LC/MS-MS) have provided a great opportunity to study phosphorylation events in detail.12,13 Recently, several phosphoproteomic studies were performed to characterize the landscape of the phosphorylation dynamics in autophagy. For example, Yeh et al. adopted nanoLC-MS/MS to identify 15 potential phosphorylation sites (p-sites) on Atg1 in the yeast Saccharomyces cerevisiae and confirmed that phosphorylation of S34 inhibits both Atg1 kinase activity and autophagy.14 Using the stable isotope labeling by amino acids in cell culture (SILAC) labeling technique, Harder et al. performed a quantitative phosphoproteomic analysis of ammonia- or rapamycin-induced autophagy and observed that up to 328 p-sites were only significantly up- or downregulated by ammonia, in an MTOR (mechanistic target of rapamycin [serine/threonine kinase])-independent manner.15 In addition, Rigbolt et al. quantified 6,801 p-sites in 2,155 proteins from MCF-7 human breast cancer cells treated with rapamycin or subjected to starvation and discovered several MAP1LC3-interacting proteins that exhibit distinct phosphorylation dynamics upon starvation or rapamycin treatment.16 Although both nonquantitative and quantitative proteomic techniques have been widely used, the identification of key upstream regulators, namely, protein kinases from the phosphoproteomic data, is still difficult.
In this study, we systematically quantified the phosphoproteome in mouse neuroblastoma cell line N2a treated with Cory and Cory B. To identify the potential kinases that were significantly regulated by Cory or Cory B, we developed a novel algorithm of in silico Kinome Activity Profiling (iKAP) to computationally infer the kinase activities from the phosphoproteomic data. With the help of iKAP, 3 kinases, including RPS6KB1, MAP2K2 and PLK1, were predicted to be specifically up- or downregulated by Cory. We found that Cory, but not Cory B, increases the phosphorylation level and kinase activity of MAP2K2 and PLK1, whereas the siRNA-mediated knockdown of Map2k2 and Plk1 inhibited Cory-induced autophagy, although Plk1 depletion also affected Cory B-induced autophagy. Moreover, the inhibition of MAP2K2 and PLK1 diminished the clearance of Alzheimer disease-associated APP/β-amyloid precursor protein, and Parkinson disease-associated SNCA/α-synuclein by Cory-induced autophagy. In this regard, our studies demonstrated that both MAP2K2 and PLK1 are essential in the regulation of neuronal autophagy.
Results
A large-scale quantification of the phosphoproteome in compound-induced autophagy
Using SILAC coupled to LC-MS/MS, we systematically profiled the quantitative phosphoproteome in N2a cells treated with 15 μM Cory or Cory B for 3 h, both of which could efficiently induce neuronal autophagy (Fig. 1, Fig. S1). In total, we identified 5,328 unique phosphopeptides (Table S1) and observed that a large proportion of the phosphopeptides (3,943; 74.0%) were matched with more than one spectral count, whereas the average spectral counts for each phosphopeptide were calculated as 5.5 (Fig. 2A). By mapping the phosphopeptides to their corresponding protein sequences, we comprehensively quantified 2,233 phosphoproteins with 5,413 unique p-sites, including 4,749 p-Ser (∼87.7%), 643 p-Thr (∼11.9%), and 21 p-Tyr (∼0.4%) sites (Fig. 2B, Table S2). There were 2,070 proteins (38.2%) identified with ≤ 5 p-sites and only a few proteins (58 proteins, 1.1%) contained ≥ 10 p-sites (Fig. 2C). To assess the reliability of the phosphoproteomic identification, we retrieved 132,159 known mouse p-sites from 8 public databases, including Phospho.ELM,17 dbPTM,18 PHOSIDA,19 SysPTM,20 PTMfunc,21 PhosphoSitePlus,22 dbPAF23 and UniProt.24 In comparison, we found that up to 5,150 (∼95.1%) p-sites quantified in this study were annotated and included in at least one phosphorylation database (Fig. 2D). The high overlapping rate suggested that most of our identifications were bona fide p-sites with high confidence.
Figure 1.
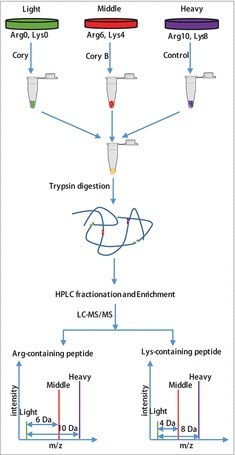
Flowchart of the identification of the quantitative phosphoproteome in neuronal autophagy. According to the weights of the labeled essential amino acids, N2a cells were divided into 3 groups, including “heavy” (13C615N2-Lysine, 13C615N4-Arginine), “middle” (13C414N2-Lysine, 13C614N4-Arginine) and “light” (12C614N2-Lysine, 12C614N4-Arginine). After checking the labeling efficiency (> 96%), the “light” and “middle” groups were treated with 15 μM Cory or Cory B for 3 h (Fig. S1), and the “heavy” group, which acted as a control group, was treated with 0.1% (v:v) DMSO. The cell lysates were mixed at a ratio of 1:1:1 and reduced with 10 mM dithiothreitol for 1 h at 56°C and then alkylated with 20 mM iodoacetamide for 45 min at room temperature and protected from light. Then, proteins were digested in solution with trypsin gold at a ratio of 1:50 (trypsin to protein) overnight and 1:100 (trypsin to protein) for another 4 h. After fractionation by high-pH reverse-phase HPLC, peptides were divided into 12 fractions. Finally, enriched phosphopeptides were subjected to LC-MS/MS for the identification of the quantitative phosphoproteome.
Figure 2.
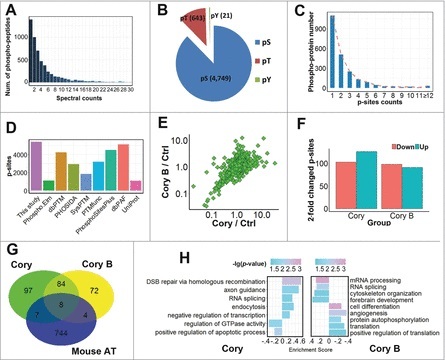
A summary of the identified and quantified phosphoproteome and p-sites. (A) The distribution of MS/MS spectral counts (≤ 30) of phosphopeptides identified in this study. (B) The numbers of p-Ser, p-Thr and p-Tyr residues. (C) The number distribution of p-sites in quantified phosphoproteins. (D) The overlap of p-sites identified in this study compared with known p-sites in public databases. (E) The distribution of SILAC ratios for quantified p-sites in Cory- and Cory B-treated N2a cells against the control group. (F) The number of significantly upregulated (≥ 2-fold) or downregulated (≤ 0.5-fold) p-sites in the Cory or Cory B groups relative to the control. (G) The overlap of phosphoproteins with at least one ≥ 2-fold changed p-site against curated autophagy regulators in the THANATOS database.25 (H) The GO-based enrichment analysis of biologic processes that are differentially regulated by Cory (left) and Cory B (right) using GSEA (p-value < 0.05).
With the comparison of the modification levels of p-sites in the Cory and Cory B groups, we observed that the Cory:Cory B ratio of most p-sites was mainly centered at 1.0 with a relatively low variance, and the results demonstrated that only a small proportion of p-sites were potentially regulated upon the Cory or Cory B treatment, in a direct or indirect manner (Fig. 2E). Using a 2-fold change threshold, we found that the phosphorylation levels of the 126 and 103 p-sites were dramatically increased and decreased by Cory, respectively (Fig. 2F). Additionally, there were 91 and 98 p-sites significantly up- and downregulated by Cory B, respectively (Fig. 2F). In a recent study, we developed an integrative database known as The Autophagy, Necrosis, ApopTosis OrchestratorS (THANATOS, http://thanatos.biocuckoo.org), which contains both known and highly likely proteins involved in regulating autophagy and cell death pathways, based on experimental evidence or an orthologous search.25 We mapped 196 and 168 proteins with at least one ≥ 2-fold changed p-site in the Cory and Cory B groups respectively, to 763 mouse proteins associated with autophagy in THANATOS and found that 19 phosphoproteins had been annotated as autophagy regulators in the database (Fig. 2G, Table S3). Whether these proteins are implicated in Cory- or Cory B-induced autophagy remains to be further dissected.
In addition, we performed enrichment analyses of biological processes based on Gene Ontology (GO) annotations for the phosphoproteins in the Cory and Cory B groups using the gene set enrichment analysis (GSEA) approach, which took the quantification information into account.26 Obviously, different GO terms were significantly associated with the 2 drug treatments (Fig. 2H). For example, DSB repair via homologous recombination (GO:0000724) and axon guidance (GO:0007411) were highly enriched in Cory-treated cells, while RNA-related processes such as mRNA processing (GO:0006397) and RNA splicing (GO:0008380) were significantly over-represented in the Cory B treatment group (Fig. 2H). Thus, our analyses indicated that there were potentially distinct mechanisms for the regulation of neuronal autophagy induced by the 2 compounds. Although thousands of p-sites have been quantified, the regulatory kinases responsible for modifying these p-sites were still elusive. Additionally, it was not known whether some of these kinases were involved in regulating neuronal autophagy.
A novel computational method for inferring protein kinase activities from a weighted kinase-site phosphorylation network
Although the Cory and Cory B treatment groups could not be easily distinguished directly from the p-sites, we asked whether there were any particular protein kinases that played distinct roles in these 2 groups. To address this question, we developed a novel network-based method, iKAP, to computationally infer significant changes in the kinase activity from the phosphoproteomic data. The basic idea was derived from the working concept that the more important kinases preferentially induce more significant changes in the phosphorylation network level rather than at a single p-site. For example, if the activity of a kinase is increased, it will produce a more positive regulation of the phosphorylation network and vice versa. In this study, we used the quantification ratio, an indicator of phosphorylation changes at the phosphopeptide level, as the weight information, which explicitly reflected the differential regulation of protein kinases on substrates in the phosphorylation network.
Here, to obtain upstream kinases with high confidence and to construct the phosphorylation network, a prediction of site-specific kinase-substrate relationships (ssKSRs) and the integration of protein-protein interactions between kinases and substrates was performed for the phosphoproteomic data (Fig. 3A).27 Simply, we hypothesized that the change to the phosphopeptide level was uniformly derived from each of its kinases and mapped the ratio information to each kinase-site association. Then, we constructed a weighted kinase-site phosphorylation network (WKSPN) containing 360 protein kinases, 1,524 substrate sites and 21,065 ssKSRs (Fig. 3B).
Figure 3.

The iKAP algorithm to profile the change in kinase activity. (A) The in silico prediction of ssKSRs and the integration of protein-protein interactions between kinases and substrates were performed using our previously reported iGPS 1.0 method.27 (B) A WKSPN was modeled using the ssKSRs and the quantification information of each phosphopeptide. (C) All single-kinase networks were extracted out and each was further separated into 2 subnetworks, including the upregulated network (ratio > 1) and downregulated network (ratio < 1). (D) The Chi-square test was performed to calculate the significant changes in kinase activity.
To investigate the changes in kinase activities induced by the drug treatment, we first extracted 360 single-kinase networks and then separated the network into 2 subnetworks based on the ratio change for each kinase. In our study, the network containing p-sites with ratios > 1 was considered as the upregulated network, while the network containing p-sites with ratios < 1 was considered as the downregulated network (Fig. 3C). To statistically test which network was preferentially regulated by the kinase, the Yate's Chi-square test was performed for a network comparison (Fig. 3D). At a significance level of p-value < 0.05, the number of protein kinases that were significantly up- and downregulated by Cory was 38 and 43, respectively. Meanwhile, the number of protein kinases that were significantly up- and downregulated by Cory B was 22 and 35, respectively.
Identification of potentially important protein kinases in neuronal autophagy
To further investigate protein kinases that were potentially involved in Cory- or Cory B-induced autophagy, all kinases were mapped to THANATOS,25 which contained 118 mouse protein kinases annotated as autophagy regulators (Fig. 4A, B, Table S4). Through direct mapping, 7 up- and 12 downregulated kinases induced by Cory (Fig. 4A, C) and 2 up- and 11 downregulated kinases induced by Cory B were detected as autophagy regulators, respectively (Fig. 4B, D). From the results, we observed that the kinase activity of CDK1, a cyclin-dependent kinase, was highly upregulated by both Cory and Cory B (Fig. 4C, D), suggesting that cell cycle events might be commonly regulated in the neuroprotective autophagy process. Additionally, PRKAA2, a component of the AMP-activated protein kinase (AMPK) that inhibits the phosphatidylinositol 3-kinase complex that is not involved in autophagy by phosphorylating PIK3C3,11,28 was predicted to be downregulated in both the Cory and Cory B groups (Fig. 4C, D). In addition, we observed that AKT family members, including AKT1, AKT2 and AKT3, were significantly downregulated by both compounds during autophagy. This result was also consistent with a previous study that AKT1 led to the inhibition of autophagy by downregulating the expression of UVRAG (UV radiation resistance associated gene).29 Taken together, our results highlighted common mechanisms that exist in compound-induced neuronal autophagy and provided potentially important targets for the therapy of neurodegenerative diseases.
Figure 4.
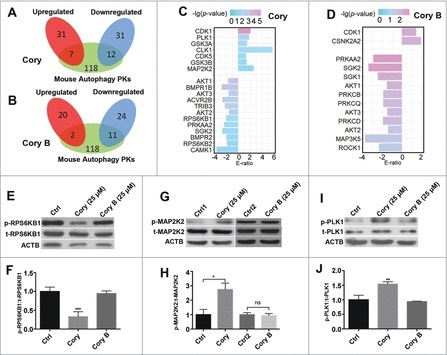
The phosphoproteome-based identification of protein kinases potentially involved in neuronal autophagy. We used the iKAP algorithm for the prediction of differentially regulated kinases (p-value < 0.05) and adopted mouse proteins annotated in THANATOS to filter potentially false positive hits for the (A) Cory and (B) Cory B groups. (C) The list of kinases differentially regulated by Cory. (D) The differentially regulated kinases induced by Cory B. (E) The total (t-) protein and phosphorylation (p-) levels of RPS6KB1 were measured to probe the RPS6KB1 activity dynamics upon Cory or Cory B treatment. (F) Cory but not Cory B decreases the phosphorylation level and the kinase activity of RPS6KB1 (***p < 0.001, Cory vs. Ctrl). (G) The total protein and phosphorylation levels of MAP2K2 were measured. (H) Cory increases the phosphorylation level and kinase activity of MAP2K2 (*p < 0.05; ns, not significant). (I) The total protein and phosphorylation dynamics of PLK1. (J) Cory increases the PLK1 activity (*p < 0.01, Cory vs. Ctrl).
Interestingly, we observed that there were several kinases potentially regulated by only Cory or Cory B. For example, RPS6KB1 (ribosomal protein S6 kinase, polypeptide 1), a serine/threonine protein kinase, was significantly downregulated by Cory, but not by Cory B. Previously, we found that Cory, but not Cory B, induced autophagy potentially through the MTOR pathway by reducing the phosphorylation level of RPS6KB1.7,8 With an immunoblotting analysis, we simultaneously detected the phosphorylation levels of RPS6KB1 at T389, a p-site positively correlated with RPS6KB1 kinase activity, with the treatment of Cory and Cory B. Our results confirmed that Cory, but not Cory B, significantly decreased the phosphorylation level and kinase activity of RPS6KB1 (Fig. 4E, F).
Next, we aimed to discover new protein kinases that participate in the regulation of neuronal autophagy. We mainly focused on protein kinases with significantly upregulated activities since these kinases may be directly or indirectly activated upon Cory or Cory B treatment. In our results, the kinase activities of MAP2K2 and PLK1 were predicted to be exclusively upregulated in Cory-induced autophagy. As a member of the MAPKK or MAP2K family, MAP2K2 was reported to be associated with tumourigenesis and involved in the well-known RAS-RAF-MAP2K/MEK-MAPK/ERK pathway, which positively regulates autophagy in response to starvation and curcumin treatment in human cancer.30-33 PLK1, a key protein kinase that functions throughout the M phase of the cell cycle, is often overexpressed in human tumors.34 The inhibition of PLK1 kinase activity leads to apoptosis, necroptosis, and attenuated autophagy in cancer.35,36 Although both kinases are involved in the autophagy of human cancers, it is unknown whether MAP2K2 and PLK1 participate in the regulation of neuronal autophagy.
To validate the upregulated change of MAP2K2, an immunoblotting analysis was performed to measure the phosphorylation level of MAP2K2 S222, which is phosphorylated by RAF or MAP3Ks and positively correlated with MAP2K2 kinase activity.37 Indeed, a significant upregulation in phospho-MAP2K2 at S222 was found in Cory-treated cells, while a stable level was observed in the Cory B-treated group, suggesting that Cory upregulated the activity of MAP2K2 (Fig. 4G, H). Meanwhile, we measured the phosphorylation level of PLK1 at T210, which is phosphorylated by AURKA/Aurora-A and positively correlates with PLK1 kinase activity.38 Similar to MAP2K2, Cory but not Cory B increased the phospho-PLK1 level at T210 (Fig. 4I, J). These experiments are consistent with the iKAP results and suggest that both kinases might play potential roles in Cory-induced autophagy.
MAP2K2 and PLK1 are required for autophagy-associated clearance of pathological proteins in neurodegenerative diseases
To confirm whether MAP2K2 and PLK1 are involved in neuronal autophagy, we performed siRNA experiments to knock down Map2k2 or Plk1 (Fig. S2A, S2B). From the results, we found that both Cory and Cory B induced an increase in MAP1LC3B/LC3B (microtubule-associated protein 1 light chain 3 β)-II (Fig. 5A, B, C). For Cory, the increase in LC3B-II was diminished by Map2k2 silencing, but dramatically enhanced by the depletion of Plk1 (Fig. 5A, B). In contrast, the LC3B-II increased by Cory B was not influenced by Map2k2 knockdown but considerably enhanced by Plk1 silencing (Fig. 5B, C). Additionally, both Cory and Cory B significantly reduced SQSTM1/p62, whereas Map2k2 deprivation only blocked the effect in Cory- but not Cory B-treated cells (Fig. 5D, E, F). Thus, it could be proposed that MAP2K2 is mainly involved in Cory- but not Cory B-induced autophagy. However, Plk1 silencing inhibited the effect caused by both Cory and Cory B, and the results suggested that both compounds potentially regulate PLK1.
Figure 5.
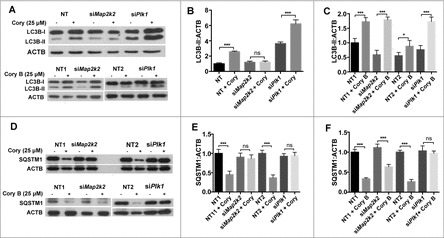
MAP2K2 and PLK1 are involved in the regulation of compound-induced neuronal autophagy. (A) The changes in LC3B-II upon the Cory and Cory B treatments, after silencing MAP2K2 and PLK1. (B) Quantifications of the LC3B-II:ACTB ratio in the Cory or (C) Cory B group. (D) The changes in SQSTM1 treated with Cory and Cory B, after the silencing of MAP2K2 and PLK1. (E) Quantifications of the SQSTM1:ACTB ratio in the Cory or (F) Cory B group. *p < 0.5; ***p < 0.001; ns, not significant; NT, nontargeting.
To evaluate whether MAP2K2 and PLK1 are essential for ensuring the neuroprotective effects generated by Cory, we first inhibited the kinase activity of MAP2K2 or PLK1 using kinase inhibitors U0126 or BI2356, respectively (Fig. 6A). Immunoblotting analyses revealed that the Cory-mediated SQSTM1 decrease was diminished by the inhibition of MAP2K2 or PLK1, whereas the effect of the LC3B-II increase by Cory was blocked by MAP2K2 inhibition but greatly enhanced by BI2356 (Fig. 6B, C, D). The results were consistent with the observations from the siRNA experiments and confirmed that both kinases were involved in Cory-induced autophagy. Previously, we found that Cory promotes the clearance of wild-type and mutant SNCA by inducing autophagy.7 In this study, full-length APP (FI-APP), which is associated with the progress of Alzheimer disease, was also found to be degraded by Cory in N2S cells, which stably express a human Swedish mutant, APP695 (Fig. 6E, F). From the results, we found that the Cory-mediated clearance of FI-APP was greatly diminished by the inhibition of MAP2K2 and PLK1 (Fig. 6E, F). In addition, the Cory-mediated clearance of the mutant SNCAA53T, a molecular marker associated with Parkinson disease, was also blocked by the inhibition of the 2 kinases (Fig. 6G, H). In this regard, the inhibition of either MAP2K2 or PLK1 attenuated Cory-induced autophagy and disrupted the clearance of the overexpressed neurodegenerative disease-associated proteins. The results demonstrated that both MAP2K2 and PLK1 play critical roles in neuronal autophagy.
Figure 6.

The clearance of overexpressed APP and SNCA by Cory was greatly diminished through the inhibition of MAP2K2 or PLK1. (A) U0126 inhibits the phosphorylation and kinase activity of MAP2K2. (B) BI2356 reduces the PLK1 activity. (C) The changes in LC3B-II and SQSTM1 treated with Cory, after the inhibition of MAP2K2 or PLK1. (D) Quantifications of the SQSTM1:ACTB ratio. (E) Quantifications of the LC3B-II:ACTB ratio. (F) The clearance of FI-APP by Cory, after the inhibition of MAP2K2 or PLK1. (G) Quantifications of the FI-APP:ACTB ratio. (H) The clearance of mutant SNCA by Cory, after the inhibition of MAP2K2 or PLK1. (I) Quantifications of the SNCA:ACTB ratio. **p < 0.01; ***p < 0.001.
Discussion
Abnormal accumulation of protein aggregates and defective autophagy are hallmarks of neurodegenerative diseases.1-4 It has been demonstrated that small-molecule autophagy inducers can enhance neuronal autophagy, prompt the clearance of dysfunctional cellular components or proteins, and be used as potent drugs for the treatment of Alzheimer and Parkinson diseases.5-9 However, the molecular mechanisms of neuronal autophagy are far from being fully understood, and how these autophagy enhancers generate neuroprotective effects in the context of neurodegenerative diseases remains to be delineated.
As one of the mostly characterized PTMs, phosphorylation is involved in almost all cellular processes and plays a critical role in the regulation of autophagy.10,11 Recently, advances in the development of phosphoproteomic techniques have enabled the identification and quantification of thousands of p-sites in a single run,,12,13 and several autophagy-responsive phosphoproteomes have been characterized.15,16,39 For example, Harder et al. quantified 5,901 p-sites in 1,931 proteins from MCF-7 cells treated with ammonia or rapamycin, which is a widely used MTOR inhibitor for the induction of autophagy.15 They performed 2 technical replicates, and up to 80.5% of p-sites were simultaneously detected in both replicates.15 Additionally, Rigbolt et al. performed 2 biologic replicates and comprehensively quantified 6,801 p-sites in starvation- or rapamycin-induced autophagy.16 The median relative standard deviation of the site quantifications between the 2 replicates was calculated as 11.6%, and such a small deviation indicated that the reproducibility of the phosphoproteomic quantifications was highly promising.16 Later, Alayev et al. performed 2 biological replicates and quantified 3,042 p-sites of 1,289 proteins from serum-deprived MCF-7 cells with an acute resveratrol treatment.39 They not only observed that a similar number of phosphopeptides was detected in each replicate but also found that the distribution of phosphopeptide quantifications was also highly similar between the 2 biological replicates. Taken together, the results from both the technical and biologic replicates supported a satisfying reproducibility of quantitative phosphoproteomic profilings. Although several large-scale studies have been reported, the identification of key regulatory protein kinases from the flood of data is still a great challenge.
To find potentially important kinases involved in regulating neuronal autophagy, we quantified a phosphoproteome from N2a cells treated with 2 natural isomer compounds: Cory and Cory B. By developing a network-based method, iKAP, we comprehensively predicted 19 and 13 protein kinases to be significantly up- or downregulated by Cory and Cory B, respectively. We experimentally validated the activities of 3 differentially regulated kinases including RPS6KB1, MAP2K2 and PLK1, and the results supported the accuracy of the iKAP predictions. We also compared iKAP to GSEA, a widely used algorithm for analyzing gene expression profiles.26 We performed the GSEA analysis using the p-site ratio information (p-value < 0.05) and filtered the results using the THANATOS database. By comparison, we observed that GSEA only identified 13 protein kinases to be significantly up- or downregulated by Cory and Cory B, and 4 of these kinases were covered by iKAP (Fig. S3). In the Cory-treated group, GSEA correctly predicted MAP2K2 as a differentially regulated kinase, but missed RPS6KB1 and PLK1 (Fig. S3). Thus, our results demonstrated that the GSEA prediction was quite stringent, and too many potentially positive hits were neglected.
To gain more molecular insights into the potential roles of MAP2K2 and PLK1 in neuronal autophagy, we further predicted 35 and 140 p-sites in 34 and 64 substrates specifically modified by MAP2K2 and PLK1 from the phosphoproteomic data, respectively (Table S5). Then, we mapped these proteins to the THANATOS database and found that 10 and 14 MAP2K2- and PLK1-specific substrates were annotated to be associated with mouse autophagy (Table S5). From 14 annotated PLK1-specific substrates, we did not find any p-sites exhibiting a ≥ 2-fold change between the Cory and Cory B treatments (Table S5). Thus, the PLK1 regulation in neuronal autophagy is complicated, and its major substrates involved in autophagy are difficult to identify. However, we observed several annotated MAP2K2-specific substrates containing at least 1 differentially regulated p-site between the Cory and Cory B treatments (Table S5). For example, it was reported that the phosphorylation of human RB1 (RB transcriptional corepressor 1) at S807/S811 (S800/S804 in mouse) inhibits apoptosis by promoting its interaction with the pro-apoptotic protein BAX,40 whereas RB1 deprivation blocks the autophagic flux.41 In the results, we found a single p-site for mouse RB1 at S804 that was upregulated by Cory (2.51-fold) but downregulated by Cory B (0.69-fold) relative to the control, with a Cory:Cory B ratio of 3.62. Because MAP2K2 was predicted and validated to be specifically activated by Cory but not Cory B, the significantly higher phosphorylation level of RB1 S804 potentially inhibits apoptosis and promotes autophagic flux upon activation of MAP2K2 and might partially explain the different mechanisms of the 2 compounds. Additionally, we found that the T497 of PRKCA/PKCα and S348 of the histone acetyltransferase KAT8 were differentially phosphorylated with Cory:Cory B ratios of 2.88 and 2.02, respectively. Both proteins were reported to negatively regulate autophagy.11,42 A determination of whether the phosphorylation inhibits the activity of the 2 proteins to promote autophagy will require a further investigation.
Starvation is a classical treatment to induce autophagy. To justify whether MAP2K2 and PLK1 would be activated by starvation, the time-course changes of the protein and phosphorylation levels of MAP2K2 and PLK1 were analyzed after the starvation treatment (Fig. S4). Interestingly, we found that the phosphorylation levels of MAP2K2 and PLK1 were only significantly upregulated at the early stages of starvation-induced autophagy within 30 min, at the time that LC3B-II levels were not increased at all (Fig. S4). After one h, both MAP2K2 and PLK1 were no longer activated. In our study, we first observed that a higher concentration (25 μM) of Cory induced higher phosphorylation levels of MAP2K2 and PLK1 at 6 h (Fig. S5A, S5B), and a time-series analysis of the 2 kinases was performed by adopting this higher dose. From the results, we found that the phosphorylation levels of MAP2K2 and PLK1 were significantly increased after a 1-h treatment with Cory but not Cory B. (Fig. S5C-F). In this regard, although MAP2K2 and PLK1 were potentially involved in starvation-induced autophagy, our analyses suggested that both kinases might play more specific and important roles in compound-induced autophagy. From the results, Cory induces an increase in LC3B-II and a decrease of SQSTM1 to promote autophagic flux, whereas the inhibition or depletion of MAP2K2 greatly diminishes both effects (Fig. 5, 6). Although the depletion of PLK1 enhances the effect of increased LC3B-II by Cory, PLK1 silencing blocks the Cory-mediated decrease of SQSTM1 (Fig. 5, 6). Thus, MAP2K2 might be essential for the induction of autophagy, whereas PLK1 plays a potential role in the maturation of the autophagosome (Fig. 7). In addition, we determined cell death and viability by measuring the relative release of LDH (lactate dehydrogenase) from N2a cells treated with different concentrations of Cory and Cory B for 24 h; the doses for either the phosphoproteomic quantification (15 μM) or further validations (25 μM) did not influence cell viability (Fig. S6A, S6B).
Figure 7.

A model of Cory-induced neuroprotective autophagy through the upregulation of MAP2K2 and PLK1 kinase activity. MAP2K2 is important for the induction of autophagy, whereas PLK1 might participate in maturation of the autophagosome.
Altogether, this study provides a novel network-based approach, iKAP, to computationally infer differentially regulated protein kinase activities using quantitative phosphoproteomic data. Our validation results supported the accuracy and efficiency of this new method. Using iKAP, we predicted several protein kinases to be differentially up- or downregulated by 2 isomers, Cory and Cory B, that induced neuronal autophagy. The analysis provides new evidence for the important roles of MAP2K2 and PLK1 in the autophagy of neurodegenerative disease, which will be helpful for further experimental and clinical studies. We anticipate that iKAP can also be extended to the analysis of the phosphoproteomes of other diseases or treatments.
Materials and methods
Reagents and antibodies
H2O was purchased from Thermo (10977023); ACN (acetonitrile; A998–1) and fa (ethyl alcohol; A995–4) was purchased from Fisher Chemical; formic acid (FA; 5.43804) was purchased from Fluka; DMEM medium (11965118) and fetal bovine serum (FBS; 16000044) were purchased from Invitrogen; SILAC™ Protein Identification and Quantitation Media Kit was purchased from Thermo (SP10001); Sequencing Grade Modified Trypsin was purchased from Promega (V5280); trifluoroacetic acid (TFA; 574732), iodoacetamide (A3221) and dithiothreitol (43817) were purchased from Sigma; 2-D Quant kit was purchased from GE Healthcare (80–6483–56); IMAC beads was purchased from Dalian Institute of Chemical Physics.43 Corynoxine and Corynoxine B were purchased from Aktin Chemicals (APC-461, APC-459). 3-methyladenine (3-MA; M9281), doxycycline (Dox, D9891) and chloroquine (CQ, C6628) were purchased from Sigma-Aldrich. BI2356 (A3965) was purchased from ApexBio. U0126 (tlrl-u0126) was purchased from InvivoGen. Nontargeted siRNA (D-001810–01–05) and Plk1 siRNA (L-040566–00–0005) were purchased from Dharmacon. Anti-ACTB (sc-47778) antibody was purchased from Santa Cruz Biotechnology. Anti-LC3 (2775), anti-phospho-RPS6KB1 (Thr389; 9234), anti-RPS6KB1 (9202) antibodies and Map2k2 siRNA (6403) were purchased from Cell Signaling Technology. Anti-SNCA antibody (610786) was purchased from BD Transduction Laboratories. Anti-SQSTM1 (ab91526), anti-phospho-PLK1 (T210; ab155095), anti-PLK1 (ab17056), anti-phospho-MAP2K2 (S222; ab194754) and anti-MAP2K2 (ab178876) antibodies were purchased from Abcam. Goat anti-mouse (626520) and goat anti-rabbit (G21234) secondary antibodies were purchased from Invitrogen. EBSS (24010–043) was purchased from Thermo Fisher Scientific.
Cell culture and assays
N2a cells were maintained in DMEM (Invitrogen, 12800017), supplemented with 10% FBS. N2S cells were maintained in DMEM, supplemented with 10% FBS and 200 μg/ml G418 (Thermo, 10131035). Inducible PC12 cells were maintained in DMEM, supplemented with 10% FBS and 5% horse serum (Invitrogen, 16050122). To perform siRNA-mediated knockdown experiments, N2a cells were pretreated with siMap2k2, siPlk1 or non-targeted siRNAs for 48 h and then treated with 25 μM Cory, 25 μM Cory B or 0.1% (v:v) dimethyl sulfoxide (DMSO) for another 6 h. To analyze the effects of the kinase inhibitions on the clearance of FI-APP, N2a cells were pretreated with 12.5 μM U0126 (MAP2K2 inhibitor) or 30 nM BI2356 (PLK1 inhibitor) for 2 h and then co-treated with 25 μM Cory or 0.1% (v:v) DMSO for another 24 h. For the analysis of the clearance of mutant SNCA, inducible PC12/A53T-SNCA cells were first treated with 1 μg/ml doxycycline (Dox) for 24 h to induce the expression of mutant SNCA (A53T). Then, the cells were pretreated with 12.5 μM U0126 or 30 nM BI2356 for 2 h and then co-treated with 25 μM Cory or 0.1% (v:v) DMSO for another 24 h. To perform the LDH assay, we treated N2a cells with different concentrations of Cory, Cory B or 0.1% (v:v) DMSO (control) for 24 h, whereas the supernatant was collected and analyzed using the LDH kit.
Immunoblotting analysis
Cells were lysed with RIPA lysis buffer (Thermo, 89900) with protease inhibitor (Merck, 539137). The boiled samples (each containing 10–20 μg of protein) were subjected to SDS-PAGE on a 10–15% acrylamide gel and transferred to PVDF membranes (GE Healthcare, RPN303F). The membranes were blocked for 1 h in 1X TBST (CST, 9997) containing 5% nonfat milk and then probed with the appropriate primary and secondary antibodies. The desired bands were visualized using the ECL kit (Pierce, 32106). The band density was quantified using the ImageJ program and normalized to the band density of the control group. As described previously,7,8 one-way ANOVA with the Newman-Keuls test was performed to analyze the data. At least 3 replicates of independent experiments were performed for each immunoblotting assay, and the data were presented as the mean ± SEM of multiple (≥ 3) independent experiments.
Isolation of peptides and determination of labeling efficiency
N2a cells were grown in light, middle or heavy medium for 3 and 6 d. The labeling efficiency was determined according to a previously published protocol with small modifications.44 Cell pellets were first incubated with 100 μl of 0.1% TFA for 5 min at 4°C, incubated in a sonication bath for another 5 min and centrifuged for 10 min at 12000 g at 4°C. The supernatant was concentrated by speed vac and purified using μ-C18 ZipTips (Millipore, ZTC8M096). The eluate was added to the Nano-LC/Ion Trap MS (Ultimate 3000, Diones; amaZon ETD, BRUKER) mass spectrometer as described below. In the MASCOT search engine, “none” enzyme was selected, and N-acetyl (protein) was chosen as the variable modification.
Total protein extraction for phosphoproteomic profiling
Cell pellets were lysed with lysis buffer (Thermo, 89900) supplemented with Phosphatase Inhibitor Cocktail (Merck, 524625) and Protease Inhibitor Cocktail (Merck, 539137) on ice using a high-intensity ultrasonic processor (Scientz) for 30 min. The supernatants were collected after centrifuging at 20,000 g for 10 min at 4°C. The protein concentration was determined with a 2-D Quant kit according to the manufacturer's instructions.
HPLC fractionation and phosphopeptide enrichment
After digestion with trypsin, the sample was fractionated into fractions by high-pH reverse-phase HPLC using the Agilent 300 Extend C18 column (5 μm particles, 4.6 mm ID, 250 mm length). Briefly, peptides were first separated with a gradient of 2% to 60% acetonitrile in 10 mM ammonium bicarbonate pH 10 over 80 min into 80 fractions. Then, the peptides were combined into 12 fractions and dried by vacuum centrifugation.
For phosphopeptide enrichment, fractionated peptide mixtures were first incubated with an IMAC microsphere suspension by vibration. The IMAC microspheres with enriched phosphopeptides were collected by centrifugation, and the supernatant was removed. To remove nonspecifically adsorbed peptides, the IMAC microspheres were washed with 50% ACN:6% TFA and 30% ACN:0.1% TFA, sequentially. To elute the enriched phosphopeptides from the IMAC microspheres, elution buffer containing 10% NH4OH was added and the enriched phosphopeptides were eluted with vibration. The supernatant containing phosphopeptides was collected and lyophilized for the LC-MS/MS analysis.
LC-MS/MS analysis
Peptides were dissolved in solvent A (0.1% FA in 2% ACN), directly loaded onto a reversed-phase precolumn (Acclaim PepMap 100, Thermo Scientific). Peptide separation was performed using a reversed-phase analytical column (Acclaim PepMap RSLC, Thermo Scientific) with a linear gradient of 5–20% solvent B (0.1% FA in 98% ACN) for 50 min, 20–35% solvent B for 10 min, and 35–80% solvent B for 10 min at a constant flow rate of 300 nl/min on an EASY-nLC 1000 UPLC system. The resulting peptides were analyzed with a Q Exactive™ Plus hybrid quadrupole-Orbitrap mass spectrometer (Thermo Fisher Scientific).
The peptides were subjected to an NSI source followed by tandem mass spectrometry (MS/MS) in Q Exactive™ Plus (Thermo) coupled online to the UPLC. Intact peptides were detected in the Orbitrap at a resolution of 70,000. Peptides were selected for MS/MS using 28% NCE; ion fragments were detected in the Orbitrap at a resolution of 17,500. A data-dependent procedure that alternated between one MS scan followed by 10 MS/MS scans was applied for the top 10 precursor ions above a threshold ion count of 2E4 in the MS survey scan with a 5.0-s dynamic exclusion. The electrospray voltage applied was 2.0 kV. Automatic gain control (AGC) was used to prevent overfilling of the ion trap; 5E4 ions were accumulated for generation of MS/MS spectra. For MS scans, the m/z scan range was 350 to 1800.
Database search
The resulting MS/MS data were processed using MaxQuant with integrated Andromeda search engine (v.1.4.1.2).45 Tandem mass spectra were searched against Swiss-Prot mouse database concatenated with reverse decoy database. Trypsin/P was specified as cleavage enzyme allowing up to 2 missing cleavages, 4 modifications per peptide and 5 charges. Mass error was set to 10 ppm for precursor ions and 0.02 Da for fragment ions. Carbamidomethylation on Cys was specified as fixed modification and oxidation on Met, phosphorylation on Ser, Thr, Tyr and acetylation on protein N-termini were specified as variable modifications. False discovery rate thresholds for protein, peptide and modification site were specified at 1%. Minimum peptide length was set at 7. All the other parameters in MaxQuant were set to default values. The mass spectrometry proteomics data including the annotated mass spectra have been deposited to the ProteomeXchange Consortium via the PRIDE46,47 partner repository with the data set identifier PXD004891 (Reviewer account: reviewer61816@ebi.ac.uk, Password: 6kOmNOzP; Login: http://www.ebi.ac.uk/pride/archive/login).
The iKAP algorithm
The quantification result of the phosphoproteome was first preprocessed by averaging the quantification ratios for the same p-sites to remove any redundancy. Subsequently, the phosphopeptides with 7 residues flanking the p-site were submitted to iGPS for the prediction of ssKSRs and the construction of the mouse WKSPN (Fig. 3A, B).27 By default, we used the “Low threshold” and “Experiment/STRING PPI” filter. Species of “Mouse” was selected. In the network, the edges represent the ssKSRs, with assigned quantification ratios.
Based on the hypothesis that more important kinases preferentially induce more significant changes in the phosphorylation network, we first retrieved single kinase networks individually, and then separated a single kinase network into 2 subnetworks, including upregulated network and downregulated network, based on p-site ratios in the single kinase network (Fig. 3C).
Then, for any kinase , the upregulated kinase activity could be inferred by summing up all of its upregulated phosphorylation sites in substrates in the upregulated network, whereas the downregulated kinase activity could be inferred by summing up all of its downregulated phosphorylation sites in the downregulated network. And total upregulated kinase activity and total downregulated activity can be calculated as below:
Yate's chi-square test was used to compare the upregulated and downregulated kinases of an individual kinase with the following Chi-square 2 × 2 contingency table (Fig. 3D):
| Upregulated | Downregulated | Total | |
|---|---|---|---|
| Kinase i | |||
| Others | |||
The enrichment ratio (E-ratio) of kinase of the upregulated kinase activity against the downregulated kinase activity was calculated as below:
E-ratio > 1 means the kinase i was preferentially to be upregulated, and vice versa. The was calculated as below:
Then the p-value (< 0.05) was calculated by the function of CHIDIST() in Excel. The degree_freedom is equal to 1 for the 2 × 2 table.
Supplementary Material
Funding Statement
This work was supported by grants from the Special Project on Precision Medicine under the National Key R&D Program (SQ2017YFSF090210 to Y.XUE), the National Basic Research Program (973 project) (2013CB933900 to Y.XUE), and Natural Science Foundation of China (31671360 to Y. XUE). It was also supported by grants from Shenzhen Science, Technology & Innovation Foundation (2014/03/1857 to M.LI), the General Research Fund of Hong Kong Government (RGC/HKBU-121009/14 to M.LI), the Health and Medical Research Fund from Food and Health Bureau of Hong Kong Government (HMRF/12132091 to M.LI) and the Interdisciplinary Research Matching Scheme (IRMS) of Hong Kong Baptist University (RC-IRMS/15–16/04 to M.LI).
Abbreviations
- 3-MA
3-methyladenine
- ACN
acetonitrile
- AD
Alzheimer disease
- AMPK
AMP-activated protein kinase
- APP
amyloid β [A4] precursor protein
- Cory
corynoxine
- Cory B
corynoxine B
- CQ
chloroquine
- DMEM
Dulbecco's modified Eagle's medium
- DMSO
dimethyl sulfoxide
- FBS
fetal bovine serum
- GO
gene ontology
- GSEA
gene set enrichment analysis
- iKAP
in silico kinome activity profiling
- LC/MS-MS
liquid chromatography-tandem mass spectrometry
- LDH
lactate dehydrogenase
- MAP1LC3B/LC3B
microtubule-associated protein 1 light chain 3 β
- MAP2K2
mitogen-activated protein kinase kinase 2
- MTOR
mechanistic target of rapamycin (serine/threonine kinase)
- PD
Parkinson disease
- PLK1
polo-like kinase 1
- RPS6KB1
ribosomal protein S6 kinase, polypeptide 1
- SILAC
stable isotope labeling by amino acids in cell culture
- SNCA
synuclein, α
- ssKSRs
site-specific kinase-substrate relationships
- UVRAG
UV radiation resistance associated gene
- WKSPN
weighted kinase-site phosphorylation network.
Acknowledgments
The authors would like to thank Dr. Martha Dahlen for her English editing of this manuscript. American Journal Experts reviewed the manuscript before submission.
References
- 1.Lynch-Day MA, Mao K, Wang K, Zhao M, Klionsky DJ. The role of autophagy in Parkinson's disease. Cold Spring Harb Perspect Med. 2012;2:a009357. doi: 10.1101/cshperspect.a009357. PMID:22474616. [DOI] [PMC free article] [PubMed] [Google Scholar]
- 2.Yang DS, Stavrides P, Mohan PS, Kaushik S, Kumar A, Ohno M, Schmidt SD, Wesson D, Bandyopadhyay U, Jiang Y, et al.. Reversal of autophagy dysfunction in the TgCRND8 mouse model of Alzheimer's disease ameliorates amyloid pathologies and memory deficits. Brain. 2011;134:258–77. doi: 10.1093/brain/awq341. PMID:21186265. [DOI] [PMC free article] [PubMed] [Google Scholar]
- 3.Komatsu M, Waguri S, Chiba T, Murata S, Iwata J, Tanida I, Ueno T, Koike M, Uchiyama Y, Kominami E, et al.. Loss of autophagy in the central nervous system causes neurodegeneration in mice. Nature. 2006;441:880–4. doi: 10.1038/nature04723. PMID:16625205. [DOI] [PubMed] [Google Scholar]
- 4.Hara T, Nakamura K, Matsui M, Yamamoto A, Nakahara Y, Suzuki-Migishima R, Yokoyama M, Mishima K, Saito I, Okano H, et al.. Suppression of basal autophagy in neural cells causes neurodegenerative disease in mice. Nature. 2006;441:885–9. doi: 10.1038/nature04724. PMID:16625204. [DOI] [PubMed] [Google Scholar]
- 5.Lim J, Yue Z. Neuronal aggregates: formation, clearance, and spreading. Dev Cell. 2015;32:491–501. doi: 10.1016/j.devcel.2015.02.002. PMID:25710535. [DOI] [PMC free article] [PubMed] [Google Scholar]
- 6.Martinez-Vicente M. Autophagy in neurodegenerative diseases: From pathogenic dysfunction to therapeutic modulation. Semin Cell Dev Biol. 2015;40:115–26. doi: 10.1016/j.semcdb.2015.03.005. PMID:25843774. [DOI] [PubMed] [Google Scholar]
- 7.Chen LL, Song JX, Lu JH, Yuan ZW, Liu LF, Durairajan SS, Li M. Corynoxine, a natural autophagy enhancer, promotes the clearance of alpha-synuclein via Akt/mTOR pathway. J Neuroimmune Pharmacol. 2014;9:380–7. doi: 10.1007/s11481-014-9528-2. PMID:24522518. [DOI] [PubMed] [Google Scholar]
- 8.Lu JH, Tan JQ, Durairajan SS, Liu LF, Zhang ZH, Ma L, Shen HM, Chan HY, Li M. Isorhynchophylline, a natural alkaloid, promotes the degradation of alpha-synuclein in neuronal cells via inducing autophagy. Autophagy. 2012;8:98–108. doi: 10.4161/auto.8.1.18313. [DOI] [PubMed] [Google Scholar]
- 9.Song JX, Lu JH, Liu LF, Chen LL, Durairajan SS, Yue Z, Zhang HQ, Li M. HMGB1 is involved in autophagy inhibition caused by SNCA/alpha-synuclein overexpression: a process modulated by the natural autophagy inducer corynoxine B. Autophagy. 2014;10:144–54. doi: 10.4161/auto.26751. PMID:24178442. [DOI] [PMC free article] [PubMed] [Google Scholar]
- 10.Manning G, Whyte DB, Martinez R, Hunter T, Sudarsanam S. The protein kinase complement of the human genome. Science. 2002;298:1912–34. doi: 10.1126/science.1075762. PMID:12471243. [DOI] [PubMed] [Google Scholar]
- 11.Xie Y, Kang R, Sun X, Zhong M, Huang J, Klionsky DJ, Tang D. Posttranslational modification of autophagy-related proteins in macroautophagy. Autophagy. 2015;11:28–45. doi: 10.4161/15548627.2014.984267. PMID:25484070. [DOI] [PMC free article] [PubMed] [Google Scholar]
- 12.Huttlin EL, Jedrychowski MP, Elias JE, Goswami T, Rad R, Beausoleil SA, Villen J, Haas W, Sowa ME, Gygi SP. A tissue-specific atlas of mouse protein phosphorylation and expression. Cell. 2010;143:1174–89. doi: 10.1016/j.cell.2010.12.001. PMID:21183079. [DOI] [PMC free article] [PubMed] [Google Scholar]
- 13.Mann M, Ong SE, Gronborg M, Steen H, Jensen ON, Pandey A. Analysis of protein phosphorylation using mass spectrometry: deciphering the phosphoproteome. Trends Biotechnol. 2002;20:261–8. doi: 10.1016/S0167-7799(02)01944-3. PMID:12007495. [DOI] [PubMed] [Google Scholar]
- 14.Yeh YY, Shah KH, Chou CC, Hsiao HH, Wrasman KM, Stephan JS, Stamatakos D, Khoo KH, Herman PK. The identification and analysis of phosphorylation sites on the Atg1 protein kinase. Autophagy. 2011;7:716–26. doi: 10.4161/auto.7.7.15155. [DOI] [PMC free article] [PubMed] [Google Scholar]
- 15.Harder LM, Bunkenborg J, Andersen JS. Inducing autophagy: a comparative phosphoproteomic study of the cellular response to ammonia and rapamycin. Autophagy. 2014;10:339–55. doi: 10.4161/auto.26863. PMID:24300666. [DOI] [PMC free article] [PubMed] [Google Scholar]
- 16.Rigbolt KT, Zarei M, Sprenger A, Becker AC, Diedrich B, Huang X, Eiselein S, Kristensen AR, Gretzmeier C, Andersen JS, et al.. Characterization of early autophagy signaling by quantitative phosphoproteomics. Autophagy. 2014;10:356–71. doi: 10.4161/auto.26864. PMID:24275748. [DOI] [PMC free article] [PubMed] [Google Scholar]
- 17.Dinkel H, Chica C, Via A, Gould CM, Jensen LJ, Gibson TJ, Diella F. Phospho.ELM: a database of phosphorylation sites–update 2011. Nucleic Acids Res. 2011;39:D261–7. doi: 10.1093/nar/gkq1104. PMID:21062810. [DOI] [PMC free article] [PubMed] [Google Scholar]
- 18.Lu CT, Huang KY, Su MG, Lee TY, Bretana NA, Chang WC, Chen YJ, Chen YJ, Huang HD. DbPTM 3.0: an informative resource for investigating substrate site specificity and functional association of protein post-translational modifications. Nucleic Acids Res. 2013;41:D295–305. doi: 10.1093/nar/gks1229. PMID:23193290. [DOI] [PMC free article] [PubMed] [Google Scholar]
- 19.Gnad F, Gunawardena J, Mann M. PHOSIDA 2011: the posttranslational modification database. Nucleic Acids Res. 2011;39:D253–60. doi: 10.1093/nar/gkq1159. PMID:21081558. [DOI] [PMC free article] [PubMed] [Google Scholar]
- 20.Li J, Jia J, Li H, Yu J, Sun H, He Y, Lv D, Yang X, Glocker MO, Ma L, Yang J, Li L, Li W, Zhang G, Liu Q, Li Y, Xie L. SysPTM 2.0: an updated systematic resource for post-translational modification. Database: J Biol Database Curation 2014; 2014:bau025. doi: 10.1093/database/bau025. [DOI] [PMC free article] [PubMed] [Google Scholar]
- 21.Beltrao P, Albanese V, Kenner LR, Swaney DL, Burlingame A, Villen J, Lim WA, Fraser JS, Frydman J, Krogan NJ. Systematic functional prioritization of protein posttranslational modifications. Cell. 2012;150:413–25. doi: 10.1016/j.cell.2012.05.036. PMID:22817900. [DOI] [PMC free article] [PubMed] [Google Scholar]
- 22.Hornbeck PV, Kornhauser JM, Tkachev S, Zhang B, Skrzypek E, Murray B, Latham V, Sullivan M. PhosphoSitePlus: a comprehensive resource for investigating the structure and function of experimentally determined post-translational modifications in man and mouse. Nucleic Acids Res. 2012;40:D261–70. doi: 10.1093/nar/gkr1122. PMID:22135298. [DOI] [PMC free article] [PubMed] [Google Scholar]
- 23.Ullah S, Lin S, Xu Y, Deng W, Ma L, Zhang Y, Liu Z, Xue Y. dbPAF: an integrative database of protein phosphorylation in animals and fungi. Sci Rep. 2016;6:23534. doi: 10.1038/srep23534. PMID:27010073. [DOI] [PMC free article] [PubMed] [Google Scholar]
- 24.UniProt Consortium UniProt: the universal protein knowledgebase. Nucleic Acids Res. 2017;45:D158–D69. doi: 10.1093/nar/gkw1099. PMID:27899622. [DOI] [PMC free article] [PubMed] [Google Scholar]
- 25.Klionsky DJ, Abdelmohsen K, Abe A, Abedin MJ, Abeliovich H, Acevedo Arozena A, Adachi H, Adams CM, Adams PD, Adeli K, et al.. Guidelines for the use and interpretation of assays for monitoring autophagy (3rd edition). Autophagy. 2016;12:1–222. doi: 10.1080/15548627.2015.1100356. PMID:26799652. [DOI] [PMC free article] [PubMed] [Google Scholar]
- 26.Subramanian A, Tamayo P, Mootha VK, Mukherjee S, Ebert BL, Gillette MA, Paulovich A, Pomeroy SL, Golub TR, Lander ES, et al.. Gene set enrichment analysis: a knowledge-based approach for interpreting genome-wide expression profiles. Proc Natl Acad Sci U S A. 2005;102:15545–50. doi: 10.1073/pnas.0506580102. PMID:16199517. [DOI] [PMC free article] [PubMed] [Google Scholar]
- 27.Song C, Ye M, Liu Z, Cheng H, Jiang X, Han G, Songyang Z, Tan Y, Wang H, Ren J, et al.. Systematic analysis of protein phosphorylation networks from phosphoproteomic data. Mol Cell Proteomics. 2012;11:1070–83. doi: 10.1074/mcp.M111.012625. PMID:22798277. [DOI] [PMC free article] [PubMed] [Google Scholar]
- 28.Kim J, Kim YC, Fang C, Russell RC, Kim JH, Fan W, Liu R, Zhong Q, Guan KL. Differential regulation of distinct Vps34 complexes by AMPK in nutrient stress and autophagy. Cell. 2013;152:290–303. doi: 10.1016/j.cell.2012.12.016. PMID:23332761. [DOI] [PMC free article] [PubMed] [Google Scholar]
- 29.Yang W, Ju JH, Lee KM, Nam K, Oh S, Shin I. Protein kinase B/Akt1 inhibits autophagy by down-regulating UVRAG expression. Exp Cell Res. 2013;319:122–33. doi: 10.1016/j.yexcr.2012.11.014. PMID:23200933. [DOI] [PubMed] [Google Scholar]
- 30.Codogno P, Meijer AJ. Autophagy and signaling: their role in cell survival and cell death. Cell Death Differ. 2005;12 Suppl 2:1509–18. doi: 10.1038/sj.cdd.4401751. PMID:16247498. [DOI] [PubMed] [Google Scholar]
- 31.Hanahan D, Weinberg RA. The hallmarks of cancer. Cell. 2000;100:57–70. doi: 10.1016/S0092-8674(00)81683-9. PMID:10647931. [DOI] [PubMed] [Google Scholar]
- 32.Meijer AJ, Codogno P. Regulation and role of autophagy in mammalian cells. Int J Biochem Cell Biol. 2004;36:2445–62. doi: 10.1016/j.biocel.2004.02.002. PMID:15325584. [DOI] [PubMed] [Google Scholar]
- 33.Shinojima N, Yokoyama T, Kondo Y, Kondo S. Roles of the Akt/mTOR/p70S6K and ERK1/2 signaling pathways in curcumin-induced autophagy. Autophagy. 2007;3:635–7. doi: 10.4161/auto.4916. PMID:17786026. [DOI] [PubMed] [Google Scholar]
- 34.Strebhardt K, Ullrich A. Targeting polo-like kinase 1 for cancer therapy. Nat Rev Cancer. 2006;6:321–30. doi: 10.1038/nrc1841. PMID:16557283. [DOI] [PubMed] [Google Scholar]
- 35.Deeraksa A, Pan J, Sha Y, Liu XD, Eissa NT, Lin SH, Yu-Lee LY. Plk1 is upregulated in androgen-insensitive prostate cancer cells and its inhibition leads to necroptosis. Oncogene. 2013;32:2973–83. doi: 10.1038/onc.2012.309. PMID:22890325. [DOI] [PMC free article] [PubMed] [Google Scholar]
- 36.Valianou M, Cox AM, Pichette B, Hartley S, Paladhi UR, Astrinidis A. Pharmacological inhibition of Polo-like kinase 1 (PLK1) by BI-2536 decreases the viability and survival of hamartin and tuberin deficient cells via induction of apoptosis and attenuation of autophagy. Cell Cycle. 2015;14:399–407. doi: 10.4161/15384101.2014.986394. PMID:25565629. [DOI] [PMC free article] [PubMed] [Google Scholar]
- 37.Caunt CJ, Sale MJ, Smith PD, Cook SJ. MEK1 and MEK2 inhibitors and cancer therapy: the long and winding road. Nat Rev Cancer. 2015;15:577–92. doi: 10.1038/nrc4000. PMID:26399658. [DOI] [PubMed] [Google Scholar]
- 38.Macurek L, Lindqvist A, Lim D, Lampson MA, Klompmaker R, Freire R, Clouin C, Taylor SS, Yaffe MB, Medema RH. Polo-like kinase-1 is activated by aurora A to promote checkpoint recovery. Nature. 2008;455:119–23. doi: 10.1038/nature07185. PMID:18615013. [DOI] [PubMed] [Google Scholar]
- 39.Alayev A, Doubleday PF, Berger SM, Ballif BA, Holz MK. Phosphoproteomics reveals resveratrol-dependent inhibition of Akt/mTORC1/S6K1 signaling. J Proteome Res. 2014;13:5734–42. doi: 10.1021/pr500714a. PMID:25311616. [DOI] [PMC free article] [PubMed] [Google Scholar]
- 40.Antonucci LA, Egger JV, Krucher NA. Phosphorylation of the Retinoblastoma protein (Rb) on serine-807 is required for association with Bax. Cell Cycle. 2014;13:3611–7. doi: 10.4161/15384101.2014.964093. PMID:25483096. [DOI] [PMC free article] [PubMed] [Google Scholar]
- 41.Biasoli D, Kahn SA, Cornelio TA, Furtado M, Campanati L, Chneiweiss H, Moura-Neto V, Borges HL. Retinoblastoma protein regulates the crosstalk between autophagy and apoptosis, and favors glioblastoma resistance to etoposide. Cell Death Dis. 2013;4:e767. doi: 10.1038/cddis.2013.283. PMID:23949216. [DOI] [PMC free article] [PubMed] [Google Scholar]
- 42.Fullgrabe J, Lynch-Day MA, Heldring N, Li W, Struijk RB, Ma Q, Hermanson O, Rosenfeld MG, Klionsky DJ, Joseph B. The histone H4 lysine 16 acetyltransferase hMOF regulates the outcome of autophagy. Nature. 2013;500:468–71. doi: 10.1038/nature12313. PMID:23863932. [DOI] [PMC free article] [PubMed] [Google Scholar]
- 43.Zhou H, Ye M, Dong J, Corradini E, Cristobal A, Heck AJ, et al.. Robust phosphoproteome enrichment using monodisperse microsphere-based immobilized titanium (IV) ion affinity chromatography. Nat Protoc. 2013;8:461–80. doi: 10.1038/nprot.2013.010. PMID:23391890. [DOI] [PubMed] [Google Scholar]
- 44.Schmidt F, Strozynski M, Salus SS, Nilsen H, Thiede B. Rapid determination of amino acid incorporation by stable isotope labeling with amino acids in cell culture (SILAC). Rapid Commun Mass Spectrom. 2007;21:3919–26. doi: 10.1002/rcm.3290. PMID:17979108. [DOI] [PubMed] [Google Scholar]
- 45.Tyanova S, Temu T, Cox J. The MaxQuant computational platform for mass spectrometry-based shotgun proteomics. Nat Protoc. 2016;11:2301–19. doi: 10.1038/nprot.2016.136. PMID:27809316. [DOI] [PubMed] [Google Scholar]
- 46.Vizcaino JA, Deutsch EW, Wang R, Csordas A, Reisinger F, Rios D, Dianes JA, Sun Z, Farrah T, Bandeira N, et al.. ProteomeXchange provides globally coordinated proteomics data submission and dissemination. Nat Biotechnol. 2014;32:223–6. doi: 10.1038/nbt.2839. PMID:24727771. [DOI] [PMC free article] [PubMed] [Google Scholar]
- 47.Vizcaino JA, Csordas A, del-Toro N, Dianes JA, Griss J, Lavidas I, Mayer G, Perez-Riverol Y, Reisinger F, Ternent T, et al.. 2016 update of the PRIDE database and its related tools. Nucleic Acids Res. 2016;44:D447–56. doi: 10.1093/nar/gkv1145. PMID:26527722. [DOI] [PMC free article] [PubMed] [Google Scholar]
Associated Data
This section collects any data citations, data availability statements, or supplementary materials included in this article.