ABSTRACT
The production of reactive species contributes to the age-dependent accumulation of dysfunctional mitochondria and protein aggregates, all of which are associated with neurodegeneration. A putative mediator of these effects is the lipid peroxidation product 4-hydroxynonenal (4-HNE), which has been shown to inhibit mitochondrial function, and accumulate in the postmortem brains of patients with neurodegenerative diseases. This deterioration in mitochondrial quality could be due to direct effects on mitochondrial proteins, or through perturbation of the macroautophagy/autophagy pathway, which plays an essential role in removing damaged mitochondria. Here, we use a click chemistry-based approach to demonstrate that alkyne-4-HNE can adduct to specific mitochondrial and autophagy-related proteins. Furthermore, we found that at lower concentrations (5–10 μM), 4-HNE activates autophagy, whereas at higher concentrations (15 μM), autophagic flux is inhibited, correlating with the modification of key autophagy proteins at higher concentrations of alkyne-4-HNE. Increasing concentrations of 4-HNE also cause mitochondrial dysfunction by targeting complex V (the ATP synthase) in the electron transport chain, and induce significant changes in mitochondrial fission and fusion protein levels, which results in alterations to mitochondrial network length. Finally, inhibition of autophagy initiation using 3-methyladenine (3MA) also results in a significant decrease in mitochondrial function and network length. These data show that both the mitochondria and autophagy are critical targets of 4-HNE, and that the proteins targeted by 4-HNE may change based on its concentration, persistently driving cellular dysfunction.
KEYWORDS: 4-hydroxynonenal, autophagy, mitochondria, mitochondrial dynamics, neurodegeneration, oxidative stress
Introduction
Oxidative stress is a prevalent feature of stroke, ischemia-reperfusion, and neurodegenerative diseases.1 As a major consequence of oxidative stress, accumulation of lipid peroxidation products and their adduction to target molecules is a prevalent feature of these neuronal pathologies.2-6 4-hydroxynonenal (4-HNE) is typical of the highly reactive lipid peroxidation products that form covalent protein adducts, and 4-HNE stimulates the formation of other reactive species in the brains of stroke and neurodegenerative disease patients.7-10 Pathologically, 4-HNE levels have been reported to be in the range of 1–10 μM in patient plasma, tissues, and neurons, increasing as much as 10-fold from levels found in normal tissues.11-18 Furthermore, 4-HNE can reach concentrations up to 100 μM in the ventricular fluid of Alzheimer disease brains.14 Mitochondria are major targets of 4-HNE, and covalent adducts with mitochondrial respiratory chain subunits have been reported and are associated with enhanced reactive species production and a decrease in the mitochondrial reserve capacity, all of which contribute to bioenergetic dysfunction.19-22 If these damaged mitochondria, which are capable of generating secondary reactive oxygen species and amplifying the initial oxidative insult, are not removed by autophagy, cellular dysfunction and ultimately cell death occurs.23-25 In response to oxidative stress, autophagy is then essential for clearing damaged proteins and organelles, and in this role serves an essential antioxidant function.26-28
Changes in cellular metabolism, the production of reactive species, and autophagy are closely linked.29 For example, the selective removal of damaged mitochondria by autophagy (mitophagy) provides a system whereby damaged organelles can be specifically removed without requiring bulk degradation of cytosolic constituents.30 Furthermore, changes in the mitochondrial network, through mitochondrial fission and fusion events, can also play a significant role in mitigating the effects of increased oxidative stress, and these events, coupled with mitochondrial biogenesis or removal by autophagy, are required for successful maintenance of a healthy mitochondrial population.31,32 Failure of mitochondria to properly function, or an inability of autophagy to remove the mitochondria damaged by oxidative stress, can result in an accumulation of mitochondria that not only contributes to the bioenergetic deficit in the cell, but also propagate the formation of more reactive species.33 This could, in part, explain why neurodegenerative disease brains exhibit both autophagic abnormalities and mitochondrial dysfunction both early and late in the disease process.34-36 While several studies have shown 4-HNE modifies mitochondrial proteins, including subunits of the mitochondrial respiratory chain,22,37-39 the effects of 4-HNE on mitochondrial fission and fusion proteins are unknown.
An important factor in determining the interplay between mitochondrial and autophagic dysfunction as a result of increased oxidative stress, is determining if specific reactive species target specific proteins in the mitochondria or autophagy pathways. This is important because of the potential synergistic effect of reactive species impairing both mitochondrial bioenergetics and the autophagy pathway needed to correct it. As mentioned above, 4-HNE adducts to several proteins in the cell, including mitochondrial respiratory chain subunits, and several metabolic enzymes.8,9,19,39 With regard to the autophagy pathway, there has been only one study demonstrating that 4-HNE can target the vacuolar-type H+-translocating ATPase.40 While our previous study indicated that 4-HNE activates autophagy in differentiated SH-SY5Y cells, and other studies have shown that 4-HNE-induced aggregates can inhibit autophagy,41 the mechanism underlying 4-HNE regulation of autophagy is still unknown. We hypothesized that if both autophagy and mitochondrial proteins are targets for 4-HNE, their dysfunction may jointly contribute to bioenergetic dysfunction. To test this possibility, we exposed embryonic rat primary cortical neurons to 4-HNE, and determined whether 4-HNE can target specific proteins involved in the autophagy pathway and whether this was associated with deteriorating mitochondrial quality using bioenergetic endpoints. Finally, we assessed whether modulation of the autophagy pathway using the autophagy activator rapamycin, and the autophagy inhibitor 3-methyladenine (3MA), could affect both basal and 4-HNE-dependent mitochondrial dysfunction.
Results
aHNE modifies mitochondrial and autophagy proteins in a concentration-dependent manner
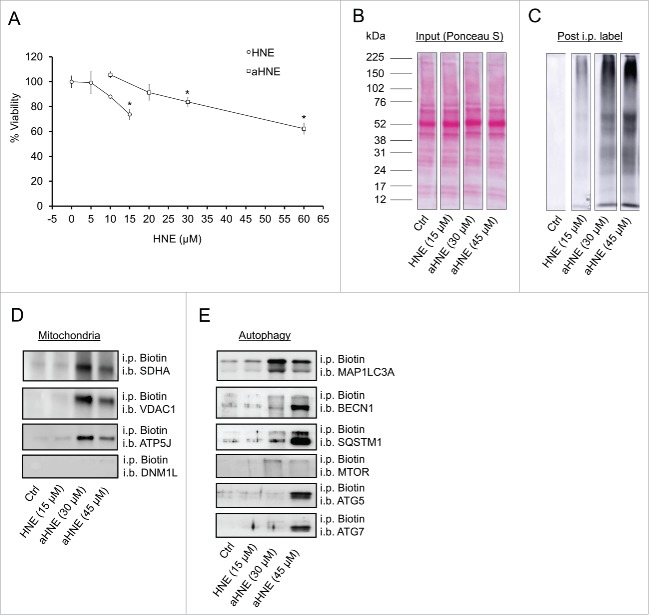
Because increased 4-HNE levels, mitochondrial dysfunction, and decreased autophagy are all common characteristics associated with neurodegenerative diseases,14,35,42,43 we determined whether 4-HNE modifies proteins involved in the autophagy pathway in rat E18 primary cortical neurons. Using click chemistry and an alkyne modified form of 4-HNE (aHNE), we first tested if aHNE-associated toxicity differed from unmodified 4-HNE (Fig. 1A). Comparison of the 4-HNE and aHNE treated cells for 4 h revealed that 30–45 μM aHNE exhibited similar toxicity to 10–15 μM 4-HNE (Fig. 1A). In subsequent experiments, we adjusted for this difference in potency by using aHNE at a 2- to 3-fold higher concentration. Next, we performed the same treatment with aHNE and conducted click chemistry, followed by biotin-streptavidin-based affinity isolation on the neuronal protein lysates. After the affinity isolation we performed western blot analysis on the purified samples to determine which mitochondrial or autophagy pathway proteins were modified by the aHNE (Fig. 1B–E). We found that the mitochondrial proteins SDHA (succinate dehydrogenase complex, subunit A, flavoprotein [Fp]), VDAC1 (voltage-dependent anion channel 1), and ATP5J (ATP synthase, H+ transporting, mitochondrial F0 complex, subunit F), as well as the autophagy initiation proteins ATG5 (autophagy-related 5), ATG7 (autophagy-related 7), BECN1 (Beclin 1, autophagy related), MAP1LC3A/B (microtubule-associated protein 1 light chain 3 α/β), and SQSTM1/p62 (sequestosome 1) were all modified at a concentration of 45 μM aHNE (Fig. 1D and E). We also tested whether aHNE could modify key mitochondrial dynamics machinery; however, DNM1L/Drp1 (dynamin 1-like) was not modified by aHNE at either concentration tested (Fig. 1D). SDHA, VDAC1, ATP5J, BECN1, SQSTM1, MAP1LC3A/B-I, MAP1LC3A/B-II, and the autophagy signaling protein MTOR (mechanistic target of rapamycin [serine/threonine kinase]) were also modified at 30 μM aHNE. Interestingly, MAP1LC3A/B-I, MAP1LC3A/B-II, MTOR, and all 3 mitochondrial targets exhibited more modification at 30 μM aHNE compared with 45 μM (Fig. 1B–E), indicating there may be specific targets in both the mitochondria and autophagy pathway sensitive to changing concentrations of 4-HNE.
Figure 1.
aHNE modifies mitochondrial and autophagy proteins. E18 primary cortical neurons were treated on DIV 7–14 in XF medium containing 0, 5, 10 or 15 μM 4-HNE or 20, 30 and 45 μM aHNE for 4 h. (A) Cell counts for neuronal viability following treatment. (B-D) Click chemistry and western blot analysis of aHNE-modified autophagy proteins. (B) Ponceau S stain of total protein (Input). (C) Western blot against streptavidin to demonstrate only aHNE-modified proteins were enriched by biotin-streptavidin affinity purification. (D and E) Western blot analysis of mitochondrial and autophagy protein targets following biotin immunoprecipitation (i.p.): SDHA, VDAC1, ATP5J, DNM1L, BECN1, SQSTM1, MAP1LC3A/B, MTOR, ATG5, and ATG7.
4-HNE affects autophagic flux in a concentration-dependent manner
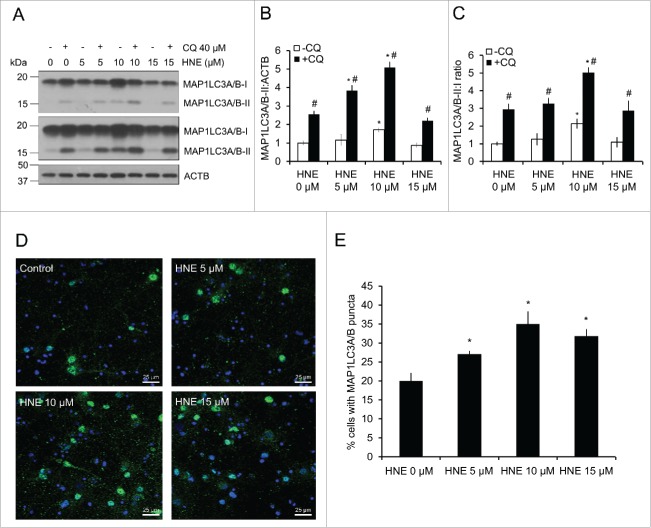
To determine if 4-HNE-based modifications of autophagy proteins are activating or inhibiting autophagy, we performed an autophagic flux assay in primary cortical neurons by inhibiting lysosomal function using chloroquine (CQ) in the presence or absence of 4-HNE, and measuring the levels of MAP1LC3A/B-II, as well as the conversion of MAP1LC3A/B-I to MAP1LC3A/B-II (Fig. 2A–C). MAP1LC3A/B-II levels were significantly increased following treatment with 10 μM 4-HNE in both the presence and absence of CQ, consistent with an increase in autophagy initiation. However, the levels of MAP1LC3A/B-II, and the ratio of MAP1LC3A/B-II:MAP1LC3A/B-I in the 15 μM 4-HNE-treated groups were similar to control levels. We interpret this result to mean that autophagy activation at the lower concentration of 4-HNE was suppressed at the higher concentrations, and may therefore be inadequate to remove the damaged proteins (Fig. 2A–C). A 2-way ANOVA analysis of the ratio of MAP1LCA/B-II to actin and MAP1LC3A/B-I to MAP1LC3A/B-II confirmed a significant increase at 10 μM, but not 5 or 15 μM 4-HNE (Fig. S1A and B). These results were further verified using levels of SQSTM1, which is turned over by autophagy. The levels of SQSTM1 decreased in the 10 μM +/− CQ groups, indicating autophagy activation; however, SQSTM1 levels increased in the 15 μM +/− CQ-treated group compared with the control, indicating autophagy inhibition at this concentration (Fig. S1C).
Figure 2.
4-HNE alters autophagic flux. E18 primary cortical neurons were treated with XF medium containing 0, 5, 10 or 15 μM 4-HNE in the presence or absence of 40 μM chloroquine (CQ) for 4 h. (A) Western blot analysis of autophagic flux measuring MAP1LC3A/B-II levels, and MAP1LC3A/B-I to MAP1LC3A/B-II conversion following HNE treatment with and without CQ. (B) Quantification of MAP1LC3A/B-II levels from panel (A). (C) Quantification of MAP1LC3A/B (LC3)-II:MAP1LC3A/B-I ratio from panel (A). Data = mean ± SEM, n = 3; normalized to control. *p < 0.05 compared with no HNE. #p < 0.05 compared with -CQ. Two-way ANOVA, followed by post hoc Tukey's HSD. (D) Immunocytochemistry of MAP1LC3A/B puncta and Hoechst nuclear staining following treatment. (E) Quantification of Hoechst-positive cells that contained MAP1LC3A/B puncta (3 images per treatment). Data = mean ± SEM, n = 150–250 cells per group (x3 experimental replicates); normalized to control. *p < 0.05 compared with no HNE. Student t test.
We further examined autophagosome accumulation to confirm autophagy activation at the lower concentrations of 4-HNE by immunocytochemistry for the formation of GFP-MAP1LC3A/B-positive puncta. All 3 concentrations of 4-HNE significantly increased autophagosome levels; however, while the increased autophagosomal number in the 5 and 10 μM 4-HNE groups indicate increased autophagy, the increase in the number of autophagosomes in the 15 μM group is consistent with autophagosome accumulation resulting from autophagy inhibition, as evidenced by the increased levels of SQSTM1 (Fig. 2D and E, Fig. S1C). These results indicate that autophagy is stimulated at lower concentrations of 4-HNE, but higher concentrations are associated with a decrease in autophagic flux.
4-HNE causes mitochondrial fragmentation without changing mitochondrial mass
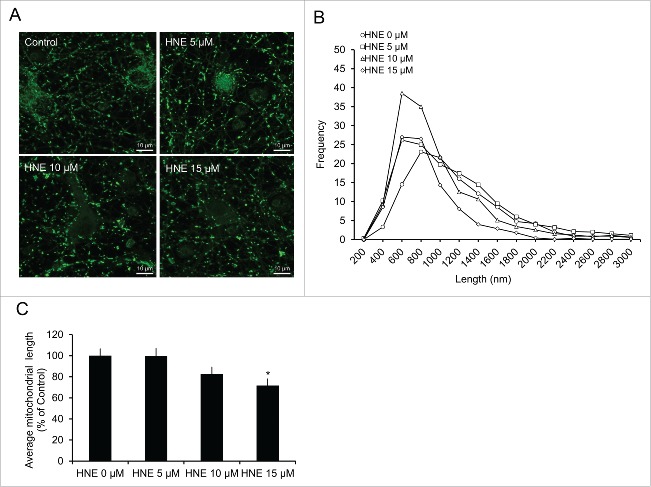
We have shown previously that 4-HNE inhibits neuronal mitochondrial function in neuroblastoma cells;20,21 however, whether 4-HNE affects mitochondrial function in primary neurons, and what effects 4-HNE has on the mitochondrial network has not been reported. To determine the effects of 4-HNE on the network of the overall mitochondrial population, particularly when the autophagy pathway is compromised, we measured mitochondrial length using MitoTracker Green staining and confocal microscopy following exposure to 4-HNE (Fig. 3A–C). A distribution plot showed that the peak mitochondrial length shifted from the 800–1000 nm range in untreated cells, to the 600–800 nm range in 5, 10 and 15 μM 4-HNE-treated neurons (Fig. 3B). Furthermore, the average mitochondrial length decreased significantly following treatment with 15 μM 4-HNE (Fig. 3C).
Figure 3.
4-HNE alters mitochondrial fission and fusion. Rat E18 primary cortical neurons were treated on DIV 7–14 with XF medium containing 0, 5, 10 or 15 μM 4-HNE for 4 h. (A) 4-HNE-treated neurons were incubated with 25 nM MitoTracker Green for 15 min and imaged using laser-scanning confocal microscopy. (B) Histogram data of changes in mitochondrial length were generated for each group (3 images per treatment [x3 experimental replicates]). The average frequency was then plotted into buckets of 200 for each experiment. (C) Quantification of the combined average mitochondrial length following treatment. Data = mean ± SEM, n = 3; normalized to control.
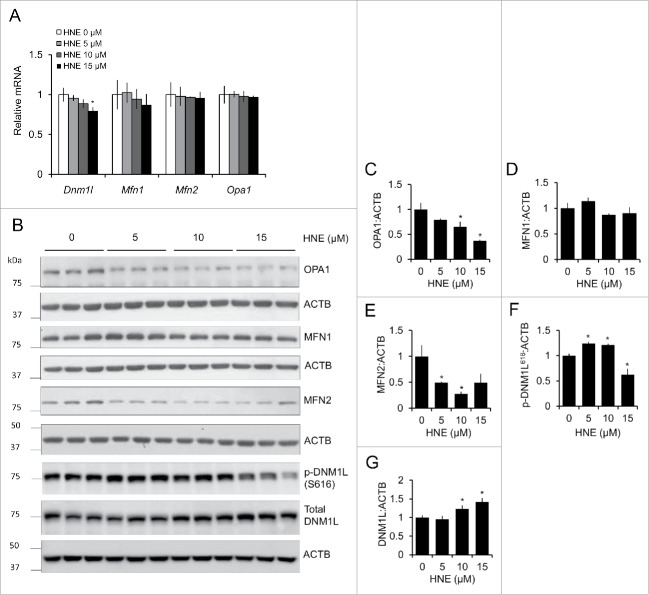
Next, we determined if the changes in mitochondrial length were a result of 4-HNE-induced changes to the mRNA or protein levels of mitochondrial fission and fusion proteins. The mRNA levels of MFN1 (mitofusin 1), MFN2 (mitofusin 2), and OPA1 (OPA1, mitochondrial dynamin like GTPase) were not significantly changed by treatment with 4-HNE, whereas DNM1L levels were slightly decreased following treatment with 15 μM 4-HNE (Fig. 4A). At 5 and 10 μM 4-HNE, both OPA1 and MFN2 protein levels were decreased, whereas MFN1 levels did not change (Fig. 4B–E). At 10 and 15 μM 4-HNE, levels of the fission protein DNM1L were significantly increased, and the phosphorylation of residue S616, which promotes fission, was increased at 5 and 10 μM 4-HNE, and decreased at 15 μM 4-HNE (Fig. 4B, F and G). Taken together, these results suggest that 4-HNE concentration-dependently affects the levels of mitochondrial fission and fusion proteins, also affecting their phosphorylation status, resulting in changes to mitochondrial network morphology.
Figure 4.
4-HNE alters mitochondrial fission and fusion mRNA and protein levels. Rat E18 primary cortical neurons were treated on DIV 7–14 with XF medium containing 0, 5, 10 or 15 μM 4-HNE for 4 h. (A) RT-PCR of Dnm1l, Mfn1, Mfn2, and Opa1 mRNA levels following treatment with 4-HNE. (B) Western blot analysis of mitochondrial fission and fusion proteins: OPA1, MFN1, MFN2, phosphor (p)-DNM1L (S616), and total DNM1L. ACTB/β-actin was used as an internal loading control. (C) Quantification of OPA1 from panel (B). (D) Quantification of MFN1 from panel (B). (E) Quantification of MFN2 from panel (B). (F) Quantification of phospho-DNM1L (S616) from panel (B). (G) Quantification of total DNM1L from panel (B). Data = mean ± SEM, n = 3; normalized to control. *p < 0.05 compared with control. Student t test.
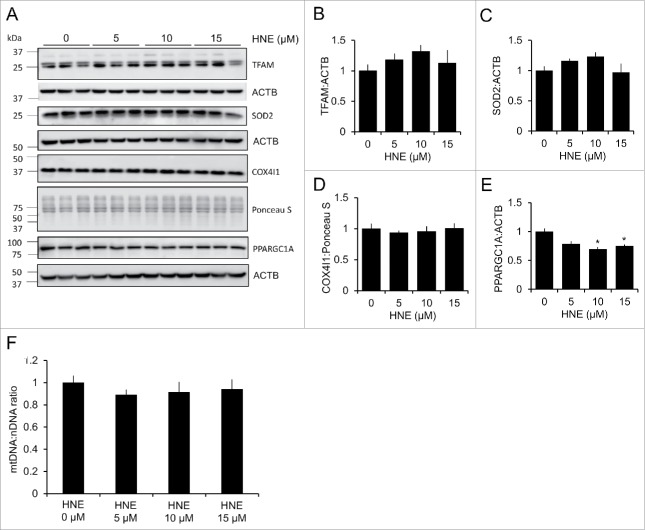
We next determined if 4-HNE-induced changes to the mitochondrial network were altering the overall mitochondrial content in the cell. To test this, we measured the mitochondrial to nuclear DNA ratio, as well as the protein levels of TFAM (transcription factor A, mitochondrial), SOD2 (superoxide dismutase 2, mitochondrial), and COX4I1 (cytochrome c oxidase subunit 4I1), and found no change across the 4-HNE treatment groups (Fig. 5A–F). Interestingly, the protein levels of PPARGC1A (peroxisome proliferative activated receptor, gamma, coactivator 1 α) were significantly decreased following treatment with 10 and 15 μM 4-HNE, indicating that mitochondrial biogenesis may be inhibited at these concentrations (Fig. 5A and E). These data indicate that 4-HNE causes significant changes to the mitochondrial network independent of changes to overall mitochondrial number/content, and may inhibit the biogenesis of new mitochondria via decreased levels of PPARGC1A.
Figure 5.
4-HNE does not alter mitochondrial mass, but decreases PPARGC1A levels. Rat E18 primary cortical neurons were treated on DIV 7–14 in phenol-free DMEM supplemented with 1 mM pyruvate (XF medium) and 0.5 mM glutamax, containing either 0, 5, 10 or 15 μM 4-HNE for 4 h. (A) Western blot analysis of mitochondrial proteins: TFAM, SOD2, ATP5J, and PPARGC1A. ACTB was used as an internal loading control for TFAM, VDAC1, and PPARGC1A. Ponceau S staining was used as a loading control for ATP5J. (B) Quantification of TFAM from panel (A). (C) Quantification of SOD2 from panel (A). (D) Quantification of COX4I1 from panel (A). (E) Quantification of PPARGC1A from panel (A). Data = mean ± SEM, n = 3; normalized to control. *p < 0.05 compared with control. Student t test. (F) Mitochondrial DNA (mtDNA) to nuclear DNA (nDNA) ratio to determine mitochondrial number following treatment with 4-HNE.
4-HNE concentration-dependently decreases mitochondrial function and complex I and V activity
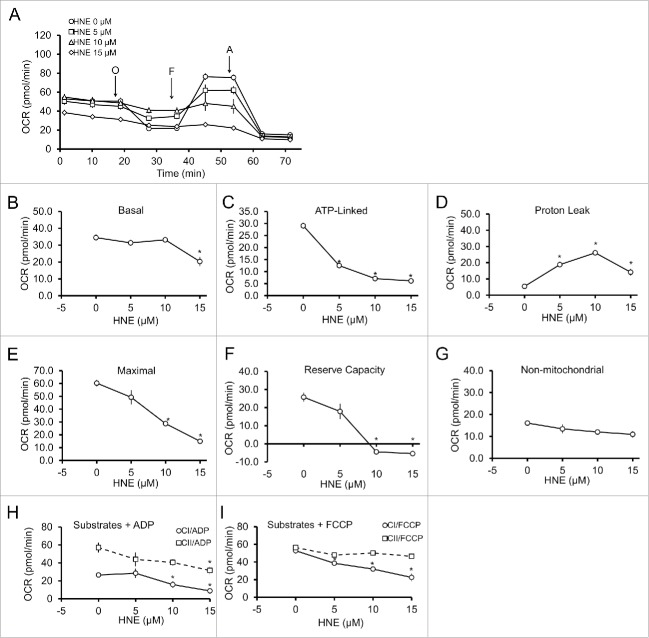
Based on our findings that 4-HNE can modify proteins in the autophagy pathway, coupled with the ability of 4-HNE to alter the mitochondrial network, we next examined whether 4-HNE can modify cellular and mitochondrial bioenergetics using the Seahorse XF analyzer. Following exposure to 0–15 μM 4-HNE for 4 h, oxygen consumption rates (OCR) were assessed using the mitochondrial stress test.20,44,45 Basal OCR is first measured for 20 min, followed by the addition of 1 μg/mL oligomycin to measure ATP-linked OCR, 1 μM carbonyl cyanide 4-(trifluoromethoxy)phenylhdrazone (FCCP) to measure maximal OCR, and 1 μM antimycin A to measure nonmitochondrial OCR (Fig. 6A). Interestingly, a decrease in basal OCR was only observed at a concentration of 4-HNE (15 μM) associated with decreased average mitochondrial length and increased DNM1L (Fig. 6B). However, 4-HNE-dependent effects on bioenergetics were also evident below this threshold concentration. Specifically, ATP-linked OCR was decreased at 5, 10 and 15 μM 4-HNE (Fig. 6C), coupled with increased proton leak (Fig. 6D). Both the maximal OCR and reserve capacity were decreased following treatment with 10 and 15 μM 4-HNE (Fig. 6E and F). Nonmitochondrial OCR was similar among all treatment groups (Fig. 6G). Since 4-HNE targets specific mitochondrial complexes in the heart and liver,19,22 we next examined whether 4-HNE-induced mitochondrial dysfunction was associated with effects on specific mitochondrial complexes in primary neurons. Using the detergent saponin to permeabilize the plasma membrane, with either adenosine diphosphate (ADP) or FCCP and specific complex I and II substrates (pyruvate-malate and succinate, respectively), complex-dependent OCR can then be measured. We found that 4-HNE caused a concentration-dependent decrease in complex I-dependent OCR in the presence of both ADP and FCCP. In the case of complex II-dependent OCR, 4-HNE inhibited function only at a concentration of 15 µM in the presence of ADP, which would be consistent with 4-HNE-dependent inhibition of complex V (Fig. 6H and I).
Figure 6.
4-HNE causes a concentration-dependent decrease in mitochondrial function by targeting complexes I and V. Rat E18 primary cortical neurons were treated on DIV 7–14 in phenol-free DMEM supplemented with 1 mM pyruvate (XF medium) and 0.5 mM glutamax, containing either 0, 5, 10 or 15 μM 4-HNE for 4 h. (A) Mitochondrial oxygen consumption rate (OCR; pmol/min) was measured following 4-h treatment with 4-HNE. O = 1 μg/mL oligomycin to determine OCR linked to ATP production, F = 1 μM FCCP to determine the maximal OCR, and A = 10 μM antimycin A to determine non-mitochondrial OCR. Three measurements are taken before addition of oligomycin to determine the basal OCR. Proton leak is determined as the difference between the final measurements following antimycin treatment subtracted from the final measurement following oligomycin treatment. The reserve capacity is determined by subtracting the basal OCR from the maximal OCR. (B-G) show the summary of (B) basal OCR, (C) ATP-linked OCR, (D) proton leak, (E) maximal OCR, (F) reserve capacity, and (G) non-mitochondrial OCR. Data = mean ± SEM, n = 4 or 5. The effects of 4-HNE treatment on mitochondrial complex I (CI), II (CII) and V was determined by permeabilizing the mitochondria using 20 μg/mL saponin, then providing either (H) ADP + pyruvate-succinate to determine complex I and II function, or (I) FCCP + pyruvate-succinate to determine complex V function. Data = mean ± SEM, n = 4 or 5. *p < 0.05 compared with control. Student t test.
3-methyladenine decreases complex I activity, induces mitochondrial fragmentation, and exacerbates 4-HNE-induced mitochondrial dysfunction
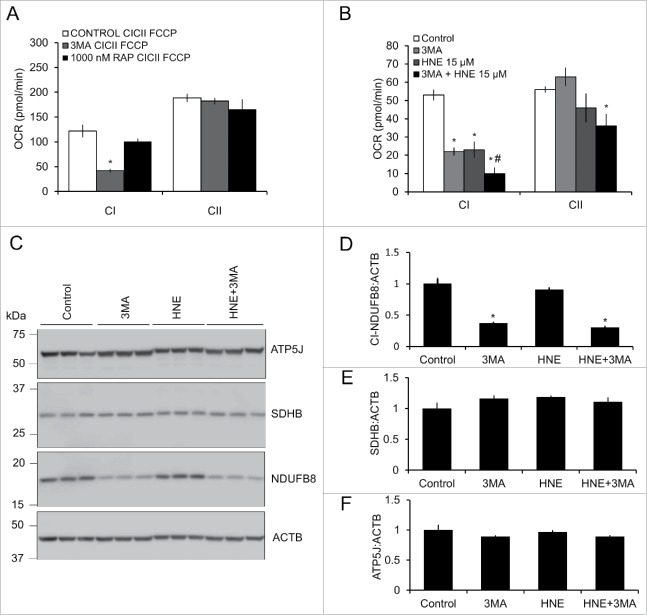
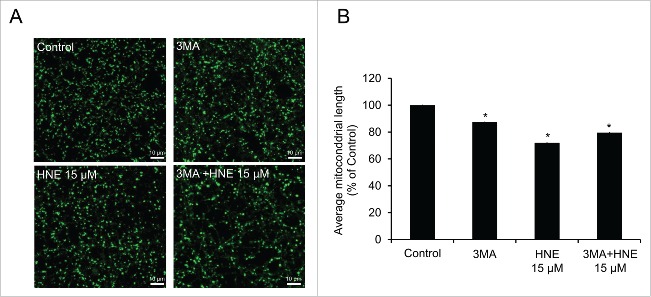
The preceding data suggest that activation or inhibition of autophagy using rapamycin or 3MA, respectively, could modify the loss of complex I activity in response to 4-HNE. We found that 3MA alone decreased complex I activity without any effect on complex II, whereas rapamycin had no effect on either complex (Fig. 7A). Treatment of neurons with 3MA or 15 μM 4-HNE in the presence of FCCP resulted in similar inhibition of mitochondrial complex I and II function compared with control, and the combination showed a further depression in activity (Fig. 7B). 3MA treatment also resulted in a decrease in protein levels of mitochondrial complex I subunit NDUFB8 (NADH dehydrogenase [ubiquinone] 1 β subcomplex 8), but not SDHB (succinate dehydrogenase complex, subunit B, iron sulfur [Ip]) or ATP5J (Fig. 7C–F). Furthermore, overall mitochondrial length was decreased, similar to treatment with 15 μM 4-HNE; however, combined treatment of 3MA and 15 μM 4-HNE did not further decrease mitochondrial length (Fig. 8A and B). These data support the hypothesis that autophagy protects against the accumulation of 4-HNE-dependent mitochondrial damage, and that the inhibition of autophagy can directly affect mitochondrial function and dynamics.
Figure 7.
3-methyladenine (3MA) decreases complex I (CI), but not complex II (CII), activity and exacerbates 4-HNE-induced mitochondrial dysfunction. E18 primary cortical neurons were treated on DIV 7–14 in XF medium containing 10 mM 3MA or 1000 nM rapamycin in the presence or absence of 0, 5, 10 or 15 μM 4-HNE for 4 h. (A) The effects of 3MA and rapamycin on mitochondrial complex I, II and V was determined using the saponin-based permeabilization assay. Data = mean ± SEM, n = 4 or 5. (B) The effects of 3MA on 4-HNE-induced mitochondrial dysfunction were determined using the saponin-based permeabilization assay using complex I or II substrates in the presence of FCCP. Data = mean ± SEM, n = 4 or 5. *p < 0.05 compared with control. #p < 0.05 compared with 3MA. Student t test. (C) Western blot analysis of NDUFB8, SDHB, and ATP5J. (D) Quantification of NDUFB8 from panel (C). (E) Quantification of SDHB from panel (C). (F) Quantification of ATP5J from panel (C). ACTB was used as an internal loading control. Data = mean ± SEM, n = 3. *p < 0.05 compared with control. Student t test.
Figure 8.
3MA decreases mitochondrial length but does not exacerbate HNE's effect on mitochondrial fragmentation. (A) Primary neurons treated with 10 mM 3MA, 15 μM 4-HNE, or 10 mM 3MA + 15 μM 4-HNE for 4 h, then incubated with 25 nM MitoTracker Green for 15 min and imaged using laser scanning confocal microscopy. (B) Quantification of average mitochondrial length following treatment. Data = mean ± SEM (n = 3 images per group (x3 experimental replicates). *p<0.05 compared with control. Student t test.
Discussion
Metabolic decline, and particularly mitochondrial dysfunction associated with increased oxidative stress, occurs in the brain during normal aging, but proceeds at an accelerated rate in neurodegenerative disease.46-48 Associated with the bioenergetic stress that occurs during neurodegeneration is decreased autophagic function, which prevents stressed neurons from recycling damaged cellular constituents, resulting in increased cellular stress and neuronal cell death.49-51 If a toxin, directly or indirectly, modifies both bioenergetics and autophagy, this combined effect would likely lead to an accelerated pathological outcome. To test this, we used the lipid peroxidation product 4-HNE, which modifies proteins through covalent modification of nucleophilic amino acid residues.7 4-HNE-protein adducts have been detected as a common feature in the brains from Alzheimer and Parkinson disease patients. It has previously been shown that 4-HNE can modify mitochondrial proteins, and can stimulate autophagy and thus promote the removal of damaged proteins.19,52,53 However, if 4-HNE also modifies autophagy proteins, then removal of dysfunctional proteins and mitochondria would be attenuated, further contributing to 4-HNE-dependent bioenergetic dysfunction.
To test this hypothesis we determined the effects of 4-HNE on cellular bioenergetics and the autophagy-lysosomal pathway in rat cortical neurons. While autophagosomal number was increased by the lowest concentration of HNE (5 µM) it reached a maximum at 10 µM. An increase in autophagy initiation was detected at 10 μM 4-HNE and then decreased to the basal level at 15 µM (Fig. 2). The increased MAP1LC3A/B-II puncta detected by immunocytochemistry at 15 µM in the absence of increased MAP1LC3A/B-II and MAP1LC3-I by western blot could be due to differences in the sensitivity of these methods, or could indicate inhibition of the autophagy pathway, as SQSTM1 levels were increased at this concentration (Fig. S1). To determine the mechanism by which autophagy might be suppressed at high concentrations of 4-HNE, we used click chemistry in combination with aHNE to determine if direct modification of autophagy proteins had occurred. We found evidence for direct 4-HNE-dependent modification of BECN1, SQSTM1, MAP1LC3A/B-I and MAP1LC3A/B-II, MTOR, ATG5, and ATG7, as well as several mitochondrial proteins, including SDHA, VDAC1 and ATP5J (Fig. 1). Whereas the modification of mitochondrial proteins by 4-HNE has been demonstrated, to our knowledge, this is the first evidence that 4-HNE can specifically target proteins involved in autophagy initiation under conditions associated with a change in autophagic activity. Interestingly, there was a concentration-dependent effect on both mitochondrial and autophagy protein modification by aHNE. Modification of MTOR may be important for decreasing its activity and thus activating autophagy initiation. Modification of MAP1LC3A/B-II may also play a role in bringing MAP1LC3A/B-II to the membrane and thus promoting autophagosome expansion. However, the modification of other autophagy proteins, such as BECN1, ATG5 and ATG7 may attenuate their function and thus suppress the neuron's overall autophagic activity. This may be the reason why autophagy initiation is increased and autophagic flux is unchanged in response to 4-HNE.
Consistent with the idea that 4-HNE did not overtly change autophagy flux at the concentration and duration of 4-HNE exposure used in this study, 4-HNE did not change mitochondrial mass (Fig. 5). However, a significant decrease in mitochondrial size occurred in response to 4-HNE (Fig. 3). Furthermore, 4-HNE-induced changes to the mitochondrial network, as assessed by the decrease of peak mitochondrial length, were associated with a concentration-dependent decrease in the mitochondrial fusion proteins OPA1 and MFN2, while MFN1 levels remained unchanged (Fig. 4). 4-HNE also increased the levels of DNM1L at the 10 and 15 μM concentrations, where the average mitochondrial length was also decreased.
4-HNE-induced changes in mitochondrial fusion machinery were associated with increased mitochondrial proton leak or uncoupling, and decreased ATP-linked mitochondrial respiration. At the 10 μM concentration, when OPA1 was decreased and when autophagy initiation was increased without changing autophagic flux, maximal respiration and reserve capacity were significantly decreased. At the 15 μM concentration, when the fission protein DNM1L was increased, basal respiration was decreased (Fig. 6). It has previously been reported that increased mitochondrial uncoupling can promote fission and mitophagy.31,54,55 Interestingly, 4-HNE decreased complex I function in the presence of both ADP and FCCP, while complex II function remained unchanged during 4-HNE treatment following provision of substrates and FCCP (Fig. 6). Although other effects associated with decreased mitochondrial quality or direct modification by 4-HNE of other mitochondrial proteins are also possible,56 our observation suggests that complex I and complex V function are the most severely affected by 4-HNE.
Finally, to determine the interaction between the autophagy pathway and mitochondrial dysfunction we tested how activation of autophagy using rapamycin, and inhibition of autophagy using 3MA, affected mitochondrial oxygen consumption in primary neurons. We showed that inhibition of autophagy with 3MA significantly decreased complex I substrate-linked oxygen consumption, while leaving complex II function intact (Fig. 7). In contrast, rapamycin had no effect on complex I, or complex II substrate-linked respiration. These observations indicate that autophagy under basal conditions was necessary and sufficient for optimal mitochondrial function, especially complex I substrate-linked respiration. In the presence of 4-HNE, 3MA also significantly decreased complex II-dependent mitochondrial oxygen consumption, and further exacerbated complex I substrate-dependent mitochondrial respiration (Fig. 7), indicating a higher requirement of autophagy in response to 4-HNE exposure to maintain mitochondrial function.
These findings indicate that highly reactive lipid species, such as 4-HNE, have specific targets in the both the mitochondria and autophagy pathway, with modification possibly affecting autophagy initiation, mitochondrial dynamics, and bioenergetics in a concentration-dependent manner, and that their combined effects are responsible for neuronal metabolic dysfunction and decreased cell survival, contributing to neurodegenerative disease progression (Fig. 9).
Figure 9.
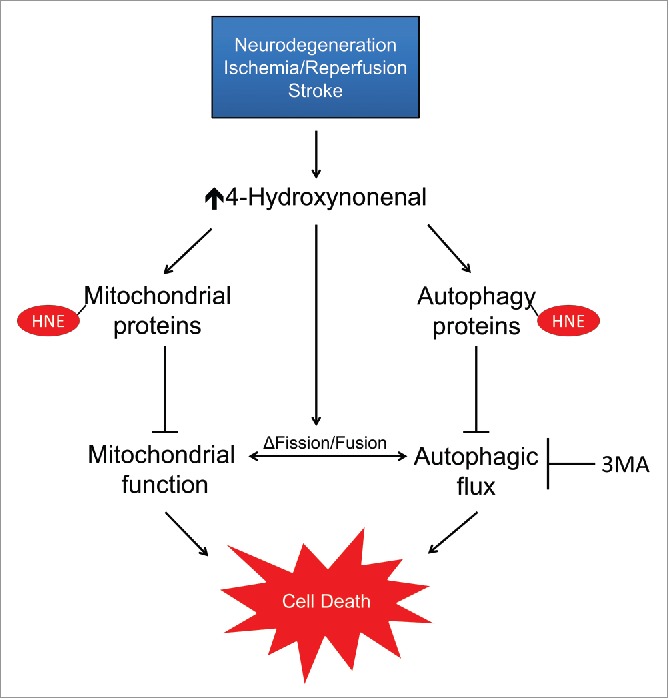
Working model of the impact of 4-HNE on neuronal autophagy, mitochondrial dynamics and bioenergetics. 4-HNE can modify both mitochondrial and autophagy pathway proteins, resulting in mitochondrial and autophagic dysfunction. 4-HNE also causes significant changes to the mitochondrial network due, in part, to altered protein levels of key mitochondrial fission and fusion proteins. The concentration-dependent effects of 4-HNE on mitochondrial and autophagic function contribute to bioenergetic crisis and eventual neuronal cell death.
Materials and methods
Materials
4-hydroxynonenal (393204) was obtained from Calbiochem. Click Tag™ 4-HNE alkyne (13265) was obtained from Cayman Chemicals. Chloroquine (C6628), 3-methyladenine (M9281), and FCCP (C2920) were obtained from Sigma. Neurobasal medium (21103–049), B-27 supplement (17504044–044), L-glutamine (25030–081) and penicillin-streptomycin (15140–122) were obtained from Life Technologies. MitoTracker Green FM (M7514) was obtained from Thermo Fisher. Trypan Blue Solution (25–900-CI) was obtained from CellGro.
Cell culture
Primary E18 rat cortical neurons were isolated, and cultured in Neurobasal medium containing 2% B27 supplement, 1% penicillin-streptomycin and 0.5 mM glutamax (Gibco, 35050061). All experiments used 7–14 d in vitro (DIV) cultures. DIV 7–14 neurons were treated in XF medium (DMEM [ThermoFisher, 12800017] supplemented with 1 mM pyruvate [ThermoFisher, 11360070, 5 mM D-glucose, and 4 mM L-glutamine [ThermoFisher, 25030081]) with or without 10 mM 3MA, 40 μM chloroquine or 1000 nM rapamycin (ThermoFisher, PHZ1235) for 4 h in the presence or absence of 0, 5, 10 or 15 μM HNE. All animal procedures were approved by UAB institutional IACUC.
Assessment of cell viability
Primary cortical neurons were plated at 80,000 cells per well in 96-well plates, and following treatment, trypsinized and resuspended in neurobasal medium. Trypan blue was added, and the cells nonpermeable to trypan blue were counted as viable.
Seahorse extracellular flux assays
Primary cortical neurons were plated at 40,000 cells per well in Seahorse XF-96 plates. Mitochondrial function was measured using the Seahorse XF-96 analyzer. Basal OCR was determined, followed by injection of: 1 μg/ml oligomycin (Sigma, 75351) to determine the OCR linked to ATP production; 1 μM FCCP (Sigma, C2920) to determine the maximal OCR; and 10 μM antimycin A (Sigma, A8674) to determine nonmitochondrial OCR. All OCR measurements are represented as pmol oxygen consumed per min.20,44,45
Mitochondrial electron transport chain activity assay
The standard assay for mitochondrial function can be further optimized to indicate changes in the function of specific mitochondrial complexes. This is accomplished by permeabilizing the cell membrane using 20 μg/ml of the detergent saponin (Sigma, 47036), then providing specific complex I and II substrates (ADP + pyruvate-malate [Sigma, A2754; P5280; M6413] and ADP + succinate [Sigma, S2378], respectively) back to the cell in MAS buffer (70 mM sucrose [MP Biomedical, 04821721], 220 mM mannitol [Sigma, M8429], 10 mM KH2PO4, 5 mM MgCl2, 2 mM HEPES, 1 mM EGTA, pH 7.2). Substrate provision is followed by permeabilization, coupled with the complex I inhibitor rotenone (1 μM; Sigma, R8875), and complex II inhibitor antimycin A (10 μM). This assay, coupled with a similar assay that includes saponin permeabilization, followed by addition of buffer containing FCCP and the same substrates, provides a detailed assessment of mitochondrial respiratory chain function and health in adhered cells.57
Western blot analysis
Primary cortical neurons were plated at 80,000 cells per well in 96-well plates, and following treatment, were lysed in RIPA buffer (50 mM Tris-Cl pH 7.8, 150 mM NaCl, 2 mM EDTA, 1% Triton X-100, and 0.1% SDS). Protein lysates were separated by SDS-PAGE and probed with the following antibodies: MAP1LC3A/B (Sigma, L8918), SQSTM1 (Abnova, H00008878), BECN1 (Santa Cruz Biotechnology, sc-11427), MTOR (Cell Signaling Technology, 2983S), ATG5 (Cell Signaling Technology, 8540S), ATG7 (Abcam, ab133528), MFN1 (Santa Cruz Biotechnology, sc-50330), MFN2 (Santa Cruz Biotechnology, sc-100560), OPA1 (Santa Cruz Biotechnology, sc-30573), DNM1L (Abcam, ab-56788), phospho-DNM1L (616; Cell Signaling Technology, D9A1), SOD2 (BD Transduction Laboratories TM, 611580), COX4I1 (Abcam, ab-14744), ATP5J (Invitrogen, PA5–439800), TFAM (Abcam, ab-138351), PPARGC1A (Santa Cruz Biotechnology, sc-13076), and total OXPHOS Rodent WB Antibody Cocktail (Abcam, ab110413). Relative levels of protein to ACTB (Sigma, A5441) loading control or Ponceau S for total protein were quantified by densitometry using ImageJ, and normalized to the lane with the highest signal.
Immunocytochemistry for MAP1LC3A/B
Autoclaved glass coverslips were placed in 24-well culture plates and seeded with primary cortical rat neurons at a density of 240,000 cells per well. Cells were exposed to 0, 5, 10, or 15 µM HNE for 4 h. After exposure cells were fixed using a mixture of 4% paraformaldehyde and 4% sucrose. After fixation, cells were blocked with 5% BSA (Fisher Scientific, BP1600) and 10% horse serum (ThermoFisher, 16050) and then probed for MAP1LC3A/B. Alexa Fluor 488 (ThermoFisher, A-21208) and Hoechst were added before slides were mounted and visualized with a Leica TCS SP5 V confocal laser-scanning microscope. Hoechst-positive cells with MAP1LC3A/B puncta were then counted and presented as a percentage of cells containing MAP1LC3A/B puncta.
Mitochondrial fragmentation
To assess changes to the mitochondrial network, E18 rat primary cortical neurons were seeded on 4-well Nunc™ Lab-Tek™ chambered coverglass plates (ThermoFisher, 155361) at a density of 200,000 per well. After a 4-h exposure to 4-HNE, 25 nM MitoTracker Green FM in pre-equilibrated XF medium was added to the cells for approximately 20 min before being washed once with fresh medium. Images were taken with a Zeiss700 laser-scanning microscope. Mitochondrial length was measured using proprietary ZEN Blue software. Approximately 300–500 total mitochondria were counted from 3 images for each treatment group on each experimental replicate. Only in-focus mitochondria with defined borders were used for measurements.
Mitochondrial copy number
The mitochondrial (mt) and nuclear Rn18s/18S DNA was amplified using RT Real-Time SYBR Green PCR master mix (ThermoFisher, 4309155) in an ABI 7500 PCR machine. The primer sequences used for mtDNA were mtF (5′-CCCCAGCCATAACACAGTATCAAAC-3′) and mtR (5′-GCCCAAAGAATCAGAACAGATGC-3′). The primer sequences for the nuclear Rn18s DNA were 18SF (5′-AAACGGCTACCACATCCAAG - 3′) and 18SR (5′-CAATTACAGGGCCTCGAAAG-3′). PCR conditions were as follows: 94°C for 2 min, followed by 40 cycles of denaturation at 94°C for 15 sec, annealing and extension at 60°C for 1 min. mtDNA copy number was normalized to amplification of an Rn18s nuclear amplicon.
Quantitative real-time PCR
RNA was isolated from cells using TRIzol (Invitrogen, 15596–026) according to the manufacturer's protocol. RNA (2 µg) was used to convert to cDNA using the iScript™ cDNA Synthesis Kit (Bio-Rad, 170–8891) according to the manufacturer's protocol. Quantitative real-time PCR was performed with SYBR Green Mastermix (ThermoFisher, 4309155) with the following conditions: 50°C 2 min, 95°C 10 min, 95 °C 15 s -> 60 °C 1 min for 40 cycles. Results were normalized against an internal control (Actb/β-actin). The following RT-PCR primers were used: Dnm1l, F – atccagctgcctcagattgt; Dnm1l, R – gtgaccacaccagtccctct; Mfn1, F – tgagggctcacattttgttg; Mfn1, R – gcgagcttgtttctgtagcc; Mfn2, F – ggcacagaggagacctcaag; Mfn2, R – cgagaaaagagcagggacat.
Statistical analysis
Data are reported as mean ± SEM. Comparisons between 2 groups were performed with unpaired Student t tests. Comparisons among multiple groups or between 2 groups at multiple time-points were performed by either one-way or 2-way analysis of variance, as appropriate, followed by post hoc Tukey's HSD test. Analyses were performed using JMP v.10 Pro (Cary, NC). A p-value of < 0.05 was considered statistically significant.
Supplementary Material
Funding Statement
This work was partially supported by UAB Blue Sky program, UAB AMC21 reload multi-investigator grant, Nathan Shock Center P30 G050886, and NIHR01-NS064090.
Abbreviations
- 4-HNE
4-hydroxynonenal
- 3MA
3-methyladenine
- ADP
adenosine diphosphate
- aHNE
alkyne-4-hydroxynonenal
- ATG5
autophagy-related 5
- ATG7
autophagy-related 7
- ATP5J
ATP synthase, H+ transporting, mitochondrial F0 complex, subunit F
- BECN1
Beclin 1, autophagy related
- COX4I1
cytochrome c oxidase subunit 4I1
- CQ
chloroquine
- DIV
day in vitro
- DNM1L
dynamin 1-like
- FCCP
carbonyl cyanide 4-(trifluoromethoxy)phenylhdrazone
- MAP1LC3A/B
microtubule-associated protein 1 light chain 3 α/β
- MFN1
mitofusin 1
- MFN2
mitofusin 2
- mtDNA
mitochondrial DNA
- MTOR
mechanistic target of rapamycin (serine/threonine kinase)
- NDUFB8
NADH dehydrogenase (ubiquinone) 1 β subcomplex 8
- OCR
oxygen consumption rate
- OPA1
mitochondrial dynamin like GTPase
- PPARGC1A
peroxisome proliferative activated receptor, gamma, coactivator 1 α
- SDHA
succinate dehydrogenase complex, subunit A, flavoprotein (Fp)
- SOD2
superoxide dismutase 2, mitochondrial
- SQSTM1
sequestosome 1
- TFAM
transcription factor A, mitochondrial
- VDAC1
voltage-dependent anion channel 1
Disclosure of potential conflicts of interest
No potential conflicts of interest were disclosed.
References
- [1].Malkus KA, Tsika E, Ischiropoulos H. Oxidative modifications, mitochondrial dysfunction, and impaired protein degradation in Parkinson's disease: how neurons are lost in the Bermuda triangle. Mol Neurodegener. 2009;4:24. doi: 10.1186/1750-1326-4-24. PMID:19500376 [DOI] [PMC free article] [PubMed] [Google Scholar]
- [2].Butterfield DA, Lauderback CM. Lipid peroxidation and protein oxidation in Alzheimer's disease brain: potential causes and consequences involving amyloid beta-peptide-associated free radical oxidative stress. Free Radic Biol Med. 2002;32:1050-60. doi: 10.1016/S0891-5849(02)00794-3. PMID:12031889 [DOI] [PubMed] [Google Scholar]
- [3].Butterfield DA, Bader Lange ML, Sultana R. Involvements of the lipid peroxidation product, HNE, in the pathogenesis and progression of Alzheimer's disease. Biochim Biophys Acta. 2010;1801:924-9. doi: 10.1016/j.bbalip.2010.02.005. PMID:20176130 [DOI] [PMC free article] [PubMed] [Google Scholar]
- [4].Ferretti G, Bacchetti T, Masciangelo S, Nanetti L, Mazzanti L, Silvestrini M, Bartolini M, Provinciali L. Lipid peroxidation in stroke patients. Clin Chem Lab Med. 2008;46:113-7. doi: 10.1515/CCLM.2008.011. PMID:18034641 [DOI] [PubMed] [Google Scholar]
- [5].Muralikrishna Adibhatla R, Hatcher JF. Phospholipase A2, reactive oxygen species, and lipid peroxidation in cerebral ischemia. Free Radic Biol Med. 2006;40:376-87. doi: 10.1016/j.freeradbiomed.2005.08.044. PMID:16443152 [DOI] [PubMed] [Google Scholar]
- [6].Sultana R, Perluigi M, Butterfield DA. Protein oxidation and lipid peroxidation in brain of subjects with Alzheimer's disease: insights into mechanism of neurodegeneration from redox proteomics. Antioxid Redox Signal. 2006;8:2021-37. doi: 10.1089/ars.2006.8.2021. PMID:17034347 [DOI] [PubMed] [Google Scholar]
- [7].Dubinina EE, Dadali VA. Role of 4-hydroxy-trans-2-nonenal in cell functions. Biochemistry (Mosc). 2010;75:1069-87. doi: 10.1134/S0006297910090014. PMID:21077827 [DOI] [PubMed] [Google Scholar]
- [8].Perluigi M, Coccia R, Butterfield DA. 4-Hydroxy-2-nonenal, a reactive product of lipid peroxidation, and neurodegenerative diseases: a toxic combination illuminated by redox proteomics studies. Antioxid Redox Signal. 2012;17:1590-609. doi: 10.1089/ars.2011.4406. PMID:22114878 [DOI] [PMC free article] [PubMed] [Google Scholar]
- [9].Reed TT, Pierce WM, Markesbery WR, Butterfield DA. Proteomic identification of HNE-bound proteins in early Alzheimer disease: Insights into the role of lipid peroxidation in the progression of AD. Brain Res. 2009;1274:66-76. doi: 10.1016/j.brainres.2009.04.009. PMID:19374891 [DOI] [PubMed] [Google Scholar]
- [10].Yoritaka A, Hattori N, Uchida K, Tanaka M, Stadtman ER, Mizuno Y. Immunohistochemical detection of 4-hydroxynonenal protein adducts in Parkinson disease. Proc Natl Acad Sci U S A. 1996;93:2696-701. PMID:8610103 [DOI] [PMC free article] [PubMed] [Google Scholar]
- [11].Berg MJ, Durrie R, Sapirstein VS, Marks N. Composition of white matter bovine brain coated vesicles: evidence that several components influence beta-amyloid peptide to form oligomers and aggregates in vitro. Brain Res. 1997;752:72-80. PMID:9106442 [DOI] [PubMed] [Google Scholar]
- [12].Lee WC, Wong HY, Chai YY, Shi CW, Amino N, Kikuchi S, Huang SH. Lipid peroxidation dysregulation in ischemic stroke: plasma 4-HNE as a potential biomarker? Biochem Biophys Res Commun. 2012;425:842-7. PMID:22898049 [DOI] [PubMed] [Google Scholar]
- [13].Urabe T, Yamasaki Y, Hattori N, Yoshikawa M, Uchida K, Mizuno Y. Accumulation of 4-hydroxynonenal-modified proteins in hippocampal CA1 pyramidal neurons precedes delayed neuronal damage in the gerbil brain. Neuroscience. 2000;100:241-50. PMID:11008164 [DOI] [PubMed] [Google Scholar]
- [14].Lovell MA, Ehmann WD, Mattson MP, Markesbery WR. Elevated 4-hydroxynonenal in ventricular fluid in Alzheimer's disease. Neurobiol Aging. 1997;18:457-61. PMID:9390770 [DOI] [PubMed] [Google Scholar]
- [15].Markesbery WR, Lovell MA. Four-hydroxynonenal, a product of lipid peroxidation, is increased in the brain in Alzheimer's disease. Neurobiol Aging. 1998;19:33-6. PMID:9562500 [DOI] [PubMed] [Google Scholar]
- [16].Butterfield DA, Reed T, Perluigi M, De Marco C Coccia R, Cini C, Sultana R. Elevated protein-bound levels of the lipid peroxidation product, 4-hydroxy-2-nonenal, in brain from persons with mild cognitive impairment. Neurosci Lett. 2006;397:170-3. PMID:16413966 [DOI] [PubMed] [Google Scholar]
- [17].Sultana R, Perluigi M, Allan Butterfield D. Lipid peroxidation triggers neurodegeneration: a redox proteomics view into the Alzheimer disease brain. Free Radic Biol Med. 2013;62:157-69. PMID:23044265 [DOI] [PMC free article] [PubMed] [Google Scholar]
- [18].Dianzani MU. 4-hydroxynonenal from pathology to physiology. Mol Aspects Med. 2003;24:263-72. PMID:12893004 [DOI] [PubMed] [Google Scholar]
- [19].Chen J, Schenker S, Frosto TA, Henderson GI. Inhibition of cytochrome c oxidase activity by 4-hydroxynonenal (HNE). Role of HNE adduct formation with the enzyme subunits. Biochim Biophys Acta. 1998;1380:336-44. [DOI] [PubMed] [Google Scholar]
- [20].Dranka BP, Benavides GA, Diers AR, Giordano S, Zelickson BR, Reily C, Zou L, Chatham JC, Hill BG, Zhang J, et al.. Assessing bioenergetic function in response to oxidative stress by metabolic profiling. Free Radic Biol Med. 2011;51:1621-35. PMID:21872656 [DOI] [PMC free article] [PubMed] [Google Scholar]
- [21].Schneider L, Giordano S, Zelickson BR, M SJ, G AB, Ouyang X, Fineberg N, Darley-Usmar VM, Zhang J. Differentiation of SH-SY5Y cells to a neuronal phenotype changes cellular bioenergetics and the response to oxidative stress. Free Radic Biol Med. 2011;51:2007-17. PMID:21945098 [DOI] [PMC free article] [PubMed] [Google Scholar]
- [22].Choksi KB, Boylston WH, Rabek JP, Widger WR, Papaconstantinou J. Oxidatively damaged proteins of heart mitochondrial electron transport complexes. Biochim Biophys Acta. 2004;1688:95-101. PMID:14990339 [DOI] [PubMed] [Google Scholar]
- [23].Hill BG, Benavides GA, Lancaster JR Jr., Ballinger S, Dell'Italia L, Jianhua Z, Darley-Usmar VM. Integration of cellular bioenergetics with mitochondrial quality control and autophagy. Biol Chem. 2012;393:1485-512. PMID:23092819 [DOI] [PMC free article] [PubMed] [Google Scholar]
- [24].Lee J, Giordano S, Zhang J. Autophagy, mitochondria and oxidative stress: cross-talk and redox signalling. Biochem J. 2012;441:523-40. PMID:22187934 [DOI] [PMC free article] [PubMed] [Google Scholar]
- [25].Redmann M, Dodson M, Boyer-Guittaut M, Darley-Usmar V, Zhang J. Mitophagy mechanisms and role in human diseases. Int J Biochem Cell Biol. 2014;53:127-33. PMID:24842106 [DOI] [PMC free article] [PubMed] [Google Scholar]
- [26].Giordano S, Darley-Usmar V, Zhang J. Autophagy as an essential cellular antioxidant pathway in neurodegenerative disease. Redox biology. 2014;2:82-90. PMID:24494187 [DOI] [PMC free article] [PubMed] [Google Scholar]
- [27].Pan T, Kondo S, Zhu W, Xie W, Jankovic J, Le W. Neuroprotection of rapamycin in lactacystin-induced neurodegeneration via autophagy enhancement. Neurobiol Dis. 2008;32:16-25. PMID:18640276 [DOI] [PubMed] [Google Scholar]
- [28].Sarkar S, Ravikumar B, Floto RA, Rubinsztein DC. Rapamycin and mTOR-independent autophagy inducers ameliorate toxicity of polyglutamine-expanded huntingtin and related proteinopathies. Cell Death Differ. 2009;16:46-56. PMID:18636076 [DOI] [PubMed] [Google Scholar]
- [29].Dodson M, Darley-Usmar V, Zhang J. Cellular metabolic and autophagic pathways: traffic control by redox signaling. Free Radic Biol Med. 2013;63:207-21. PMID:23702245 [DOI] [PMC free article] [PubMed] [Google Scholar]
- [30].Lemasters JJ. Selective mitochondrial autophagy, or mitophagy, as a targeted defense against oxidative stress, mitochondrial dysfunction, and aging. Rejuvenation Res. 2005;8:3-5. PMID:15798367 [DOI] [PubMed] [Google Scholar]
- [31].Twig G, Elorza A, Molina AJ, Mohamed H, Wikstrom JD, Walzer G, Stiles L, Haigh SE, Katz S, Las G, et al.. Fission and selective fusion govern mitochondrial segregation and elimination by autophagy. EMBO J. 2008;27:433-46. PMID:18200046 [DOI] [PMC free article] [PubMed] [Google Scholar]
- [32].Twig G, Hyde B, Shirihai OS. Mitochondrial fusion, fission and autophagy as a quality control axis: the bioenergetic view. Biochim Biophys Acta. 2008;1777:1092-7. PMID:18519024 [DOI] [PMC free article] [PubMed] [Google Scholar]
- [33].Youle RJ, van der Bliek AM. Mitochondrial fission, fusion, and stress. Science. 2012;337:1062-5. PMID:22936770 [DOI] [PMC free article] [PubMed] [Google Scholar]
- [34].Chen H, Chan DC. Mitochondrial dynamics–fusion, fission, movement, and mitophagy–in neurodegenerative diseases. Hum Mol Genet. 2009;18:R169−76. PMID:19808793 [DOI] [PMC free article] [PubMed] [Google Scholar]
- [35].Lin MT, Beal MF. Mitochondrial dysfunction and oxidative stress in neurodegenerative diseases. Nature. 2006;443:787-95. PMID:17051205 [DOI] [PubMed] [Google Scholar]
- [36].Wong E, Cuervo AM. Autophagy gone awry in neurodegenerative diseases. Nat Neurosci. 2010;13:805-11. PMID:20581817 [DOI] [PMC free article] [PubMed] [Google Scholar]
- [37].Andringa KK, Udoh US, Landar A, Bailey SM. Proteomic analysis of 4-hydroxynonenal (4-HNE) modified proteins in liver mitochondria from chronic ethanol-fed rats. Redox Biol. 2014;2:1038-47. PMID:25454745 [DOI] [PMC free article] [PubMed] [Google Scholar]
- [38].Lashin OM, Szweda PA, Szweda LI, Romani AM. Decreased complex II respiration and HNE-modified SDH subunit in diabetic heart. Free Radic Biol Med. 2006;40:886-96. PMID:16520240 [DOI] [PubMed] [Google Scholar]
- [39].Perluigi M, Sultana R, Cenini G, Di Domenico F, Memo M, Pierce WM, Coccia R, Butterfield DA. Redox proteomics identification of 4-hydroxynonenal-modified brain proteins in Alzheimer's disease: Role of lipid peroxidation in Alzheimer's disease pathogenesis. Proteomics Clin Appl. 2009;3:682-93. PMID:20333275 [DOI] [PMC free article] [PubMed] [Google Scholar]
- [40].Di Domenico F, Sultana R, Ferree A, Smith K, Barone E, Perluigi M, Coccia R, Pierce W, Cai J, Mancuso C, et al.. Redox proteomics analyses of the influence of co-expression of wild-type or mutated LRRK2 and Tau on C. elegans protein expression and oxidative modification: relevance to Parkinson disease. Antioxid Redox Signal. 2012;17:1490-506. PMID:22315971 [DOI] [PMC free article] [PubMed] [Google Scholar]
- [41].Bonet-Ponce L, Saez-Atienzar S, da Casa C, Sancho-Pelluz J, Barcia JM, Martinez-Gil N, Nava E, Jordan J, Romero FJ, Galindo MF. Rotenone Induces the Formation of 4-Hydroxynonenal Aggresomes. Role of ROS-Mediated Tubulin Hyperacetylation and Autophagic Flux Disruption. Mol Neurobiol. 2016;53:6194-208. PMID:26558631 [DOI] [PubMed] [Google Scholar]
- [42].Williams TI, Lynn BC, Markesbery WR, Lovell MA. Increased levels of 4-hydroxynonenal and acrolein, neurotoxic markers of lipid peroxidation, in the brain in Mild Cognitive Impairment and early Alzheimer's disease. Neurobiol Aging. 2006;27:1094-9. PMID:15993986 [DOI] [PubMed] [Google Scholar]
- [43].Sayre LM, Zelasko DA, Harris PL, Perry G, Salomon RG, Smith MA. 4-Hydroxynonenal-derived advanced lipid peroxidation end products are increased in Alzheimer's disease. J Neurochem 1997;68:2092-7. PMID:9109537 [DOI] [PubMed] [Google Scholar]
- [44].Benavides GA, Liang Q, Dodson M, Darley-Usmar V, Zhang J. Inhibition of autophagy and glycolysis by nitric oxide during hypoxia-reoxygenation impairs cellular bioenergetics and promotes cell death in primary neurons. Free Radic Biol Med. 2013;65:1215-28. PMID:24056030 [DOI] [PMC free article] [PubMed] [Google Scholar]
- [45].Giordano S, Dodson M, Ravi S, Redmann M, Ouyang X, Darley Usmar VM, Zhang J. Bioenergetic adaptation in response to autophagy regulators during rotenone exposure. J Neurochem. 2014;131:625-33. PMID:25081478 [DOI] [PMC free article] [PubMed] [Google Scholar]
- [46].Albers DS, Beal MF. Mitochondrial dysfunction and oxidative stress in aging and neurodegenerative disease. J Neural Transm Suppl. 2000;59:133-54. PMID:10961426 [DOI] [PubMed] [Google Scholar]
- [47].Cai H, Cong WN, Ji S, Rothman S, Maudsley S, Martin B. Metabolic dysfunction in Alzheimer's disease and related neurodegenerative disorders. Curr Alzheimer Res. 2012;9:5-17. PMID:22329649 [DOI] [PMC free article] [PubMed] [Google Scholar]
- [48].Beal MF. Mitochondrial dysfunction in neurodegenerative diseases. Biochim Biophys Acta 1998;1366:211-23. PMID:9714810 [DOI] [PubMed] [Google Scholar]
- [49].Ghavami S, Shojaei S, Yeganeh B, Ande SR, Jangamreddy JR, Mehrpour M, Christoffersson J, Chaabane W, Moghadam AR, Kashani HH, et al.. Autophagy and apoptosis dysfunction in neurodegenerative disorders. Prog Neurobiol. 2014;112:24-49. PMID:24211851 [DOI] [PubMed] [Google Scholar]
- [50].Harris H, Rubinsztein DC. Control of autophagy as a therapy for neurodegenerative disease. Nat Rev Neurol. 2012;8:108-17. [DOI] [PubMed] [Google Scholar]
- [51].Nixon RA. The role of autophagy in neurodegenerative disease. Nat Med. 2013;19:983-97. PMID:23921753 [DOI] [PubMed] [Google Scholar]
- [52].Dodson M, Liang Q, Johnson MS, Redmann M, Fineberg N, Darley-Usmar VM, Zhang J. Inhibition of glycolysis attenuates 4-hydroxynonenal-dependent autophagy and exacerbates apoptosis in differentiated SH-SY5Y neuroblastoma cells. Autophagy. 2013;9:1996-2008. PMID:24145463 [DOI] [PMC free article] [PubMed] [Google Scholar]
- [53].Hill BG, Haberzettl P, Ahmed Y, Srivastava S, Bhatnagar A. Unsaturated lipid peroxidation-derived aldehydes activate autophagy in vascular smooth-muscle cells. Biochem J. 2008;410:525-34. PMID:18052926 [DOI] [PubMed] [Google Scholar]
- [54].Elmore SP, Qian T, Grissom SF, Lemasters JJ. The mitochondrial permeability transition initiates autophagy in rat hepatocytes. FASEB J. 2001;15:2286-7. PMID:11511528 [DOI] [PubMed] [Google Scholar]
- [55].Narendra D, Tanaka A, Suen DF, Youle RJ. Parkin is recruited selectively to impaired mitochondria and promotes their autophagy. J Cell Biol. 2008;183:795-803. PMID:19029340 [DOI] [PMC free article] [PubMed] [Google Scholar]
- [56].Echtay KS, Esteves TC, Pakay JL, Jekabsons MB, Lambert AJ, Portero-Otin M, Pamplona R, Vidal-Puig AJ, Wang S, Roebuck SJ, et al.. A signalling role for 4-hydroxy-2-nonenal in regulation of mitochondrial uncoupling. Embo j. 2003;22:4103-10. PMID:12912909 [DOI] [PMC free article] [PubMed] [Google Scholar]
- [57].Salabei JK, Gibb AA, Hill BG. Comprehensive measurement of respiratory activity in permeabilized cells using extracellular flux analysis. Nat Protoc. 2014;9:421-38. PMID:24457333 [DOI] [PMC free article] [PubMed] [Google Scholar]
Associated Data
This section collects any data citations, data availability statements, or supplementary materials included in this article.


