Figure 3.
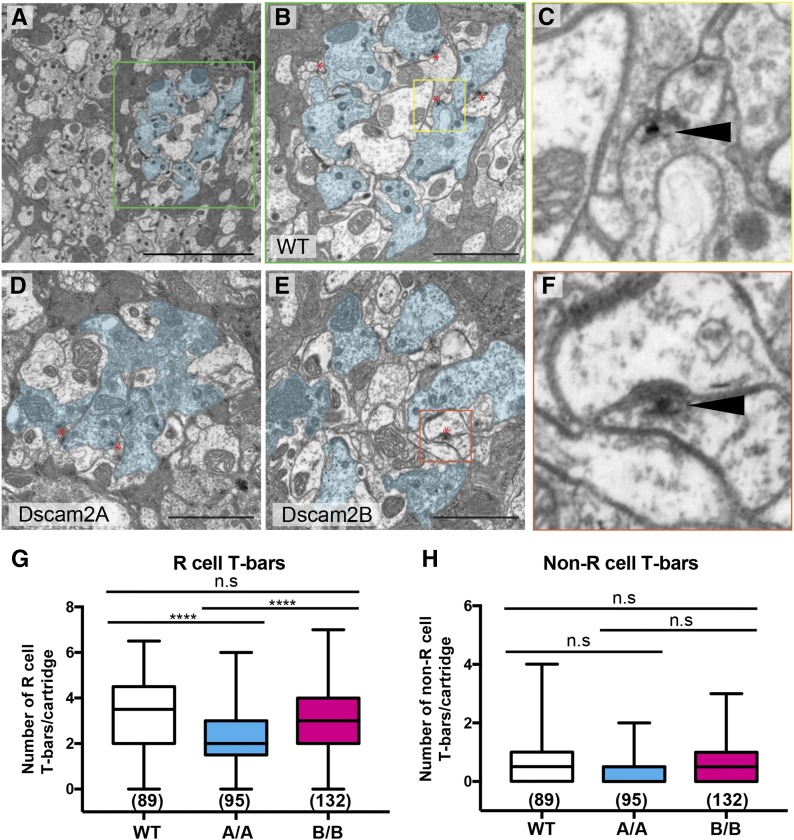
Reduced R cell T-bars in Dscam2A single-isoform lines. (A–F) Electron micrographs of representative lamina sections from wild-type (WT), Dscam2A, and Dscam2B animals imaged using transmission electron microscopy. (A) A WT section at low magnification. The R cells of a single cartridge are outlined in cyan. The green box outlines a single-lamina cartridge. (B) A single WT lamina cartridge with R cells lining the perimeter and presumptive lamina neurons L1 and L2 in the center. The yellow box outlines an example of a T-bar. (C) An example of a T-bar (black solid arrow head) in WT animals. The T-shaped platform is closely associated with a dense region of presynaptic vesicles opposing the postsynaptic density. (D) A Dscam2A single-isoform (A/A) lamina cartridge. (E) A Dscam2B single-isoform (B/B) lamina cartridge. The orange box outlines an example of a non-R cell-associated T-bar. Bar, 5 μM (A) or 2 μM (B, D, and E). Red asterisks denote T-bars (B, D, and E). (F) Non-R cell-associated T-bar (black solid arrow head) in B/B animals. (G and H) Quantification of T-bars associated and not associated with R cells. Shown is the average of two counters (see Materials and Methods). Boxplot format: middle line = median, error bars = min and max, box = 25–75% quartiles, and each data point = T-bar. Cartridge number for each genotype is shown in parentheses. Kruskal–Wallis test with Dunn’s multiple comparison test. n.s (not significant) P > 0.05 and **** P < 0.0001.

