

ABSTRACT
Macroautophagy (hereafter autophagy) is a cellular “self-eating” process that is implicated in many human cancers, where it can act to either promote or suppress tumorigenesis. However, the role of autophagy in regulation of inflammation during tumorigenesis remains unclear. Here we show that autophagy is induced in the epidermis by ultraviolet (UV) irradiation and autophagy gene Atg7 promoted UV-induced inflammation and skin tumorigenesis. Atg7 regulated UV-induced cytokine expression and secretion, and promoted Ptgs2/Cox-2 expression through both a CREB1/CREB-dependent cell autonomous mechanism and an IL1B/IL1β-dependent non-cell autonomous mechanism. Adding PGE2 increased UV-induced skin inflammation and tumorigenesis, reversing the epidermal phenotype in mice with Atg7 deletion in keratinocytes. Similar to ATG7 knockdown in human keratinocytes, ATG5 knockdown inhibited UVB-induced expression of PTGS2 and cytokines. Furthermore, ATG7 loss increased the activation of the AMPK pathway and the phosphorylation of CRTC1, and led to endoplasmic reticulum (ER) accumulation and reduction of ER stress. Inducing ER stress and inhibiting calcium influx into the ER by thapsigargin reverses the inflammation and tumorigenesis phenotype in mice with epidermal Atg7 deletion. Taken together, these findings demonstrate that deleting autophagy gene Atg7 leads to a suppression of carcinogen-induced protumorigenic inflammatory microenvironment and tumorigenesis of the epithelium.
KEYWORDS: autophagy, cytokines, inflammation, PGE2, PTGS2-COX-2, tumorigenesis, UV radiation
Introduction
Autophagy is an evolutionarily conserved, “self-eating” process in which organelles or proteins are engulfed by autophagosomes and delivered to lysosomes for degradation.1,2 More than 30 autophagy-related (ATG) genes have been identified in yeast and the majority of these ATG genes are highly conserved in mammals.3 Selective autophagy pathways mediate the degradation of proteins and organelles, including mitochondria, plasma membrane, recycling endosomes, Golgi, and endoplasmic reticulum (ER).4 Autophagy dysfunction is associated with multiple human diseases, including cancer.2, 5–7 In cancer, the role of autophagy can be either oncogenic or tumor suppressive, depending on the cell type, stage of progression, carcinogenic context, etc.6–9
Skin cancer is the most common malignancy in the US and worldwide with a continually increasing incidence.10,11 Exposure to ultraviolet B radiation (UVB, 280 to 315 nm) from the sun is the major environmental risk factor causing skin cancer with UVB radiation causing DNA damage and increased mutation burden. In addition, UV also damages self-noncoding RNA to mediate the inflammatory response through TLR3.12 In humans, sunburn sensitivity is positively associated with increased risk of skin cancer, including both nonmelanoma skin cancer and melanoma, with fair-skinned individuals having the highest risk of sunburn and skin cancer. Recent advances increasingly recognize that tumorigenesis requires not only the accumulation of genetic and epigenetic changes in epithelial cells, but also the evolution of a protumorigenic inflammatory microenvironment.13 However, the cellular mechanism connecting UV-induced inflammation and skin tumorigenesis is not well understood.
In response to UV damage, epidermal keratinocytes activate a series of signal transduction pathways including the TLR3 pathway,12 MAP kinases,14 transcription factors AP-1 and CREB1, proinflammatory protein PTGS2/COX-2 (prostaglandin-endoperoxide synthase 2),15 and the expression of numerous proinflammatory cytokines,16 including IL1B.17 These molecular events not only mediate UV-induced inflammation, but also possibly regulate tumorigenesis. In particular, PTGS2 is a UV-inducible enzyme catalyzing the first step in the synthesis of prostaglandin E2 (PGE2),15 a principal inflammation mediator. PTGS2 has been identified as an oncogene in skin cancer and is upregulated in human skin cancer.18 In mice, genetic or pharmacological inhibition of PTGS2 inhibits chemical or UV-induced skin tumorigenesis.19–22 Recent studies have demonstrated that keratinocyte PTGS2 pathway plays a major role in skin tumorigenesis.23
Here, using mice with an epidermis-specific deletion of Atg7, we demonstrate an unexpected consequence of Atg7 gene deletion in the suppression of UVB-induced inflammation and tumorigenesis through the PTGS2-PGE2 pathway. Our results provide a mechanistic link between ATG7, inflammation, and tumorigenesis following UVB radiation.
Results
Epidermis-specific deletion of Atg7 protects against UVB-induced sunburn, vascular permeability, and skin tumorigenesis
We have previously demonstrated that UVB induces autophagy in keratinocytes in vitro.24 In mice, we have now shown that UVB induces autophagy in the epidermis of wild-type (WT) mice in vivo, as indicated by the formation of MAP1LC3B/LC3B (microtubule-associated protein 1 light chain 3 beta) puncta and decreased SQSTM1/p62 (sequestome 1) levels in control mice (Fig. S1A to D) but not in mice with epidermis-specific deletion of the essential autophagy gene Atg7 (K14Cre+; Atg7flox/flox; conditional homozygous knockout, cKO). Consistent with the role of autophagy in cell survival in vitro,24 we found that epidermis-specific Atg7 deletion sensitized mouse skin to UVB-induced apoptosis (Fig. S1D and E). To determine the role of autophagy in UVB-induced damage in vivo, we first compared UVB-induced tumor formation in WT mice to that in Atg7 heterozygous mice (K14Cre+;Atg7flox/+; conditional heterozygous knockout, cHet), and in cKO mice (Fig. 1A and B). At 14 wk following UVB radiation, WT mice started to develop skin tumors. In comparison, Atg7 cHet mice started to develop skin tumors at 19 wk of UVB radiation; Atg7 cKO mice did not develop tumors until 26 wk (Fig. 1A). As compared with WT mice, Atg7 cHet and cKO mice showed statistically significant decreases in the average tumor number at 27 wk of UVB irradiation (Fig. 1B). These results demonstrate that epidermis-specific inhibition of Atg7 in mice protects against UVB-induced skin tumorigenesis. Consistent with our findings in mice that autophagy promoted skin cancer, we observed increased MAP1LC3B puncta in skin squamous cell carcinoma (SCC) compared to sun-protected normal human skin (Fig. 1C and D).
Figure 1.
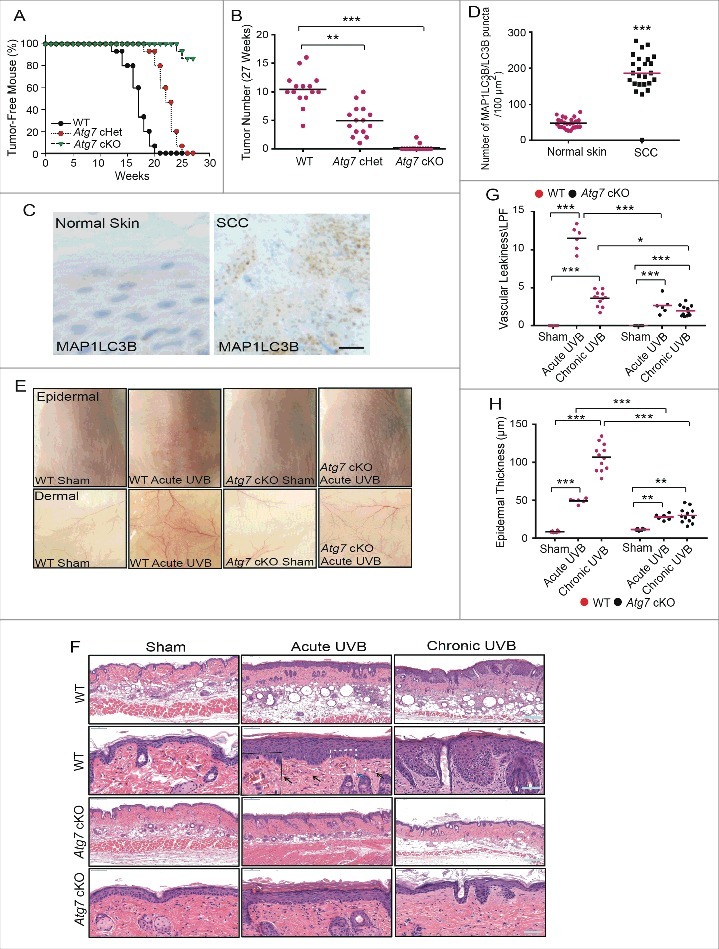
Epidermis-specific deletion of Atg7 protects against UVB-induced sunburn, vascular permeability, and skin tumorigenesis. WT and Atg7 cKO mice (n = 15) were exposed to sham, acute UVB irradiation (UVB irradiation 3 times every other day), or chronic UVB irradiation (3 times per wk every other day for 27 wk). Skin samples were collected at 24 h post-final UVB for the indicated analysis. (A) Percentage of tumor-free mice with WT, Atg7 cHet and Atg7 cKO after chronic UVB irradiation. (B) Tumor number per mouse with WT, Atg7 cHet and Atg7 cKO mice after chronic UVB irradiation as in (A). (C) Representative immunohistochemical analysis of MAP1LC3B in normal skin (n = 14) and SCC (n = 25). Scale bar: 20 μm. (D) MAP1LC3B puncta density per 100 μm2. n = 25; *** P≤ 0.001 compared with the normal skin group (Student t test). (E) Representative photograph showing sunburn induced by acute UVB irradiation. n/epidermis = 25; n/dermis = 10. (F) Representative photomicrographs of HE staining of skin sections with sham, acute UVB irradiation, or chronic UVB irradiation. Vascular leakage is indicated by black arrows. N = 6 to 12 mice per group; n = 16 to 25 microscopy fields of skin sections per mouse. Scale bar: 200 μm and 50 μm. (G) Quantification of dermal vascular leakage (incidence) per high-power field (HPF; × 400 magnification) in mice treated with sham, acute UVB, or chronic UVB irradiation. (H) Quantification of epidermal thickness in sham, acute UVB, or chronic UVB irradiation samples. N = 6 to 12 mice per group; n = 16 to 25 microscopy fields of skin sections per mouse; * P≤ 0.05, * * P≤ 0.01, *** P≤ 0.001.
In WT mice, UVB irradiation induced sunburn (Fig. 1E to G), an inflammatory response characterized by cutaneous vascular dilatation followed by vascular permeability (indicated by the presence of red blood cells in the upper dermis outside the blood vessel). However, Atg7 cKO mice were resistant to UVB-induced sunburn. Histological analysis showed that, as compared with WT mice, Atg7 cKO mice were resistant to UVB-induced vascular leakage (Fig. 1E to G). Furthermore, epidermal Atg7 ablation inhibited UVB-induced epidermal hyperplasia (Fig. 1H). Taken together, these results demonstrate that epidermal Atg7 is required for UVB-induced inflammation, epidermal hyperplasia and skin tumorigenesis.
Epidermal Atg7 deletion decreases UVB-induced vessel dilatation, angiogenesis, and lymphangiogenesis
To determine the role of autophagy in the effect of UVB on blood and lymphatic vessels, we performed immunofluorescence labeling for both PECAM1 (a blood vessel marker) and LYVE1 (a lymphatic vessel marker), and analyzed the relative vessel area and density. Epidermal Atg7 ablation inhibited UVB-induced vasodilatation, angiogenesis, and lymphangiogenesis (Fig. 2A to E). In parallel, we found that UVB irradiation increased the levels of secreted angiogenesis factors including CYR61/CCN1, SPP1/osteopontin, SERPINE1, AREG, CXCL1, HGF, CCL2, PTX3, EDN1, and MMP8 (Fig. 2F and G). Epidermal Atg7 deletion blocked UVB-induced upregulation of SPP1, AREG, CXCL1, CCL2, PTX3, and MMP8, and reduced UVB-induced upregulation of CYR61/CCN1, SERPINE1 and HGF, while it had no effect on UVB-induced EDN1 (endothelin 1; Fig. 2F and G). These data demonstrate that epidermal Atg7 deletion inhibits UVB-induced vasodilatation, angiogenesis, and lymphangiogenesis.
Figure 2.
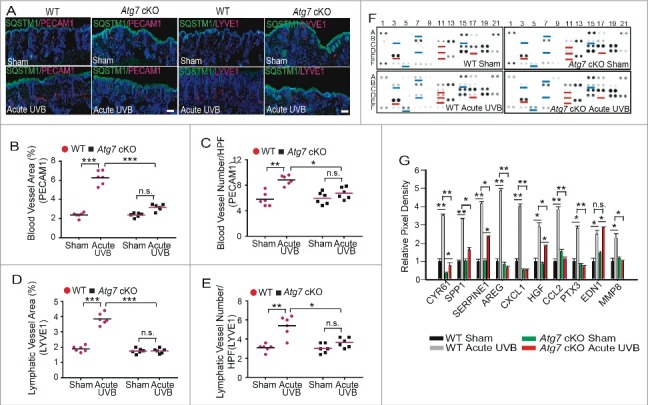
Epidermal Atg7 deletion decreases UVB-induced vessel dilation, angiogenesis, and lymphangiogenesis. WT and Atg7 cKO mice were exposed to sham or acute UVB irradiation. Skin samples were collected at 24 h post-final UVB for the indicated analysis. (A) Immunofluorescence staining of PECAM1/CD31, LYVE1 (red), and SQSTM1 (green). Nuclei are counterstained with DAPI in blue. Scale bar: 200 μm. N = 6 mice per group; n = 12 to 16 microscopy fields (LPF; × 50 magnification) of skin sections per mouse. (B) Quantification of vascular area of blood vessel (PECAM1). (C) Quantification of vascular density of blood vessel (PECAM1; HPF; × 400 magnification). (D) Quantification of vascular area of lymphatic vessel (LYVE1). (E) Quantification of vascular density of lymphatic vessel (LYVE1; HPF; × 400 magnification). N = 6 mice per group; n = 28 to 36 microscopy fields of skin sections per mouse; * P≤ 0.05, * * P≤ 0.01, *** P≤ 0.001. (F) Mouse angiogenesis factor array analysis of skin tissues (epidermis and dermis). Differentially detected dots were indicated by blue and red lines. (G) The relative mean pixel density (% WT sham) of secreted factors was quantified; * P≤ 0.05, ** P≤ 0.01, *** P≤ 0.001.
Epidermal Atg7 deletion protects against UVB-induced inflammatory microenvironment remodeling
Next we investigated the role of epidermal autophagy in UVB-induced inflammatory microenvironment remodeling in the dermis. UVB irradiation was found to induce inflammatory immune cell infiltration, as indicated by increased presence of the following immune cells: ADGRE1/F4/80− or ITGAM/CD11b-positive macrophages, CD4+ T cells (Fig. 3A), MPO-positive neutrophil granulocytes (Fig. 3B and C), mast cells (Fig. 3D and E), and degranulated (activated) mast cells (Fig. 3D and F). Epidermal Atg7 ablation attenuated this UVB-induced immune cell infiltration (Fig. 3A to F). In addition, epidermal Atg7 ablation protected against UVB-induced immunosuppression as indicated by contact hypersensitivity analysis (Fig. 3G). Moreover, UVB radiation increased collagen deposition and the number of activated myofibroblasts positive for α-smooth muscle actin (ACTA1/α-SMA) in the dermis (Fig. 3H to J). To determine the mechanism involved in this process, we also compared the level of secreted cytokines that drive inflammation, between sham- and UVB-irradiated WT and Atg7 cKO mouse skin using a mouse cytokine array. Acute UVB irradiation increased the secreted levels of CSF3/G-CSF, CXCL1, IL6, TREM1, CCL2, CCL3/MIP-1α, IL1B and CXCL2, while epidermal Atg7 deletion completely blocked UVB-induced increase in those cytokines (Fig. 3K and Fig. S2A). Chronic UVB irradiation increased the levels of secreted CSF3, CXCL1, TREM1, CCL3, IL1B and CXCL2, similar to the effect of acute UVB irradiation (Fig. 3L and S2B). Different from acute UVB irradiation, chronic UVB irradiation had no effect on the secreted levels of IL6 and CCL2, while it increased the levels of secreted C5, CSF3, CCL1 and CXCL9 (Fig. 3K and L). Epidermal Atg7 ablation also completely blocked the UVB-induced increase in secreted cytokines following chronic UVB irradiation, except CXCL9 (Fig. 3L and S2B). Taken together, our results demonstrate that UVB irradiation remodels the skin microenvironment to become proinflammatory prior to tumorigenesis and this remodeling in response to either acute or chronic UVB exposure is dependent on Atg7 and functional autophagy in the epidermis.
Figure 3.
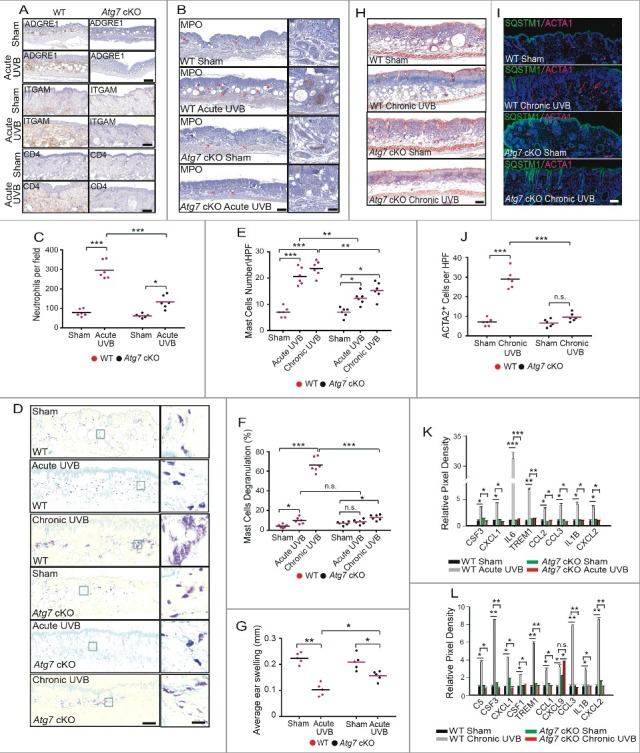
Epidermal Atg7 deletion protects against UVB-induced inflammatory microenvironment remodeling. WT and Atg7 cKO mice were exposed to sham, acute UVB, or chronic UVB irradiation. Skin samples were collected at 24 h post-final UVB for the indicated analysis. (A) Immunohistochemical staining of ADGRE1, ITGAM, and CD4. Scale bars: 400 μm (ADGRE1) and 200 μm (ITGAM and CD4). N = 6 mice per group; n = 10 to 15 microscopy fields (LPF; × 100 and × 50 magnification) of skin sections per mouse. (B) Immunohistochemical staining of MPO. Scale bar: 400 μm. N = 6 mice per group; n = 10 to 12 microscopy fields (LPF; × 50 magnification) of skin sections per mouse. (C) Number of MPO-positive neutrophils per high-power field (HPF; × 400 magnification). (D) Toluidine blue staining of mast cells. Scale bars: 400 μm (left) and 50 μm (right). (E) Number of mast cells per high-power field (HPF; × 400 magnification). (F) Percentage of master cells with degranulation. N = 6 mice per group; n = 22 to 35 microscopy fields (HPF; × 400 magnification) of skin sections per mouse; * P≤ 0.05, ** P≤ 0.01, *** P≤ 0.001. (G) Contact hypersensitivity (CHS) assay using 2,4-dinitro-1-fluorobenzene (DNFB), measured as average ear swelling. * P≤ 0.05, ** P≤ 0.01 (Student t test). (H) Masson trichrome staining of collagen. Scale bar: 400 µm. (I) Immunofluorescence staining of ACTA1 and SQSTM1. Nuclei are counterstained with DAPI in blue. Scale bar: 400 μm. (J) Number of ACTA1+ cells per high-power field (HPF; × 400 magnification). N = 6 mice per group; n = 25 to 35 microscopy fields (HPF; × 400 magnification) of skin sections per mouse; *** P≤ 0.001. (K) Cytokine array analysis of skin (epidermis and dermis) from sham-irradiated and acute UVB-irradiated WT and Atg7 cKO mice. The relative mean pixel density (% WT sham) of differentially regulated cytokines by either UVB or Atg7 deletion was listed; * P≤ 0.05, ** P≤ 0.01, *** P≤ 0.001. (L) Cytokine array analysis of skin (epidermis and dermis) from sham-irradiated and chronic UVB irradiated WT and Atg7 cKO mice. The relative mean pixel density (% WT sham) of differentially regulated cytokines was listed; * P≤ 0.05, ** P≤ 0.01, *** P≤ 0.001.
Epidermal specific deletion of Atg7 protects against UVB-induced tumorigenesis through inhibiting PTGS2-PGE2
To determine the mechanism by which ATG7 regulates UVB-induced tumorigenesis, we assessed the role of PTGS2, a proinflammatory enzyme that catalyzes the production of prostaglandin E2 (PGE2) and promotes UVB-induced sunburn and skin tumorigenesis through a cell-intrinsic mechanism.20,23 First, we found that both acute and chronic UVB radiation increased PTGS2 protein levels in the epidermis (Fig. 4A) while epidermal Atg7 ablation prevented UVB-induced PTGS2 induction (Fig. 4A). In parallel, both acute and chronic UVB irradiation increased the PGE2 levels, while epidermal Atg7 deletion prevented UVB-induced PGE2 generation (Fig. 4B). To determine the role of PGE2 in sunburn regulated by ATG7, we treated WT and Atg7 cKO mice with PGE2 via intradermal injection. At 30 min post injection, PGE2 caused similar erythema and vasodilatation as indicated by increased vessel area in both WT and Atg7 cKO mice (Fig. S3A to D), indicating that the effect of Atg7 inhibition on sunburn is due to a defect in PGE2 generation rather than a defect in signaling downstream of PGE2. In normal human epidermal keratinocytes (NHEK), ATG7 knockdown inhibited both basal and UVB-induced PTGS2 expression at the protein, mRNA, and promoter transcriptional levels (Fig. 4C to E). In Atg7 cKO mice, topical PGE2 treatment of mice after each UVB irradiation increased UVB-induced epidermal hyperplasia, vascular dilation, permeability, and tumorigenesis, and reversed the phenotype in mice with epidermal Atg7 deletion (Fig. 4F and G). These data indicate that epidermal Atg7 inhibition protects against UVB-induced inflammation and skin tumorigenesis through suppression of the PTGS2-PGE2 axis.
Figure 4.
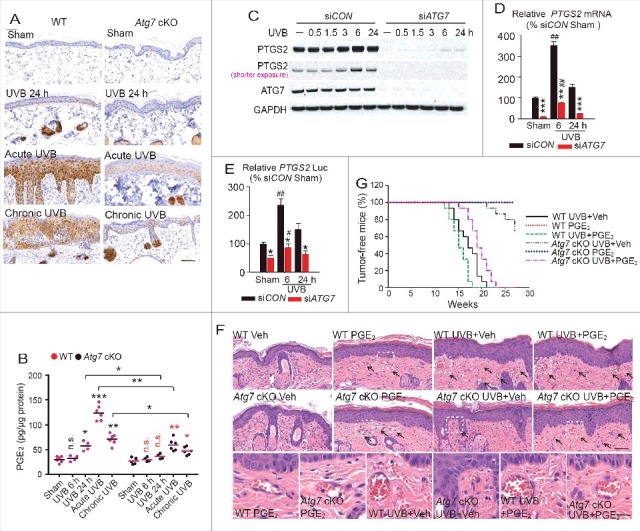
Epidermis-specific deletion of Atg7 protects against UVB-induced tumorigenesis through inhibiting PTGS2 and PGE2. WT and Atg7 cKO mice were exposed to sham, acute UVB, or chronic UVB irradiation. Skin samples were collected at 24 h post-final UVB unless otherwise indicated. (A) Immunohistochemical staining of PTGS2 in skin irradiated with sham, one UVB irradiation (24 h), acute UVB irradiation or chronic UVB irradiation. Scale bar: 50 μm. N = 6 mice per group; n = 16 to 22 microscopy fields of skin sections per mouse. (B) PTGS2 cyclooxygenase activity was determined by ELISA for PGE2 in skin irradiated with sham, one UVB irradiation (at 6 h or 24 h post-UVB), acute UVB irradiation, or chronic UVB irradiation. N = 4 to 6 mice per group; n = 3 samples per mouse. (C) Immunoblot analysis of PTGS2, ATG7, and GAPDH in NHEK cells transfected with siCON or siATG7, irradiated with sham or UVB irradiation, and then collected over a time course post-UVB. Results were obtained from 3 independent experiments. (D) Real-time PCR analysis for the PTGS2 mRNA levels in NHEK cells transfected with siCON or siATG7 and then irradiated with sham or UVB (at 6 or 24 h post-UVB). (E) Luciferase report assay of the PTGS2 promoter in NHEK cells transfected with siCON or siATG7 for 24 h and then transfected with the PTGS2 promoter for 24 h followed by sham-irradiation or UVB irradiation (at 6 or 24 h post-UVB). Results are mean±S.D. from 3 independent experiments; * P≤ 0.05, ** P≤ 0.01, *** P≤ 0.001 compared with siCON group; # P≤ 0.05, ## P≤ 0.01 compared with the sham group. (F) Representative photomicrographs of HE-stained skin sections following sham or acute UVB irradiation without or with topical PGE2 treatment (after each UVB irradiation). Vasodilatation and vascular leakage are indicated by black arrows. Scale bars: 200 μm and 50 μm. (G) Percentage of tumor-free mice in vehicle or PGE2-treated Atg7 WT and cKO mice irradiated with sham or chronic UVB (n = 15).
ATG7 promotes PTGS2 transcription through the CRE element in the PTGS2 promoter
To determine how ATG7 regulates PTGS2 expression, we assessed the role of regulatory elements in the human and mouse PTGS2 promoters for the response to UVB and deletion of Atg7. There are 5 regulatory elements, NFKB-5′, NFKB-3′, CEBPB/NFIL6, AP-1, and CRE (Fig. S4A), all of which except NFKB-3′ are conserved between the human and mouse promoter (Fig. S4A). We found that ATG7 knockdown decreased the protein abundance of FOS and JUN, and phosphorylation of JUN and CREB1 (Fig. S4B), which are important for AP-1 activation or CRE element-mediated PTGS2 transcription.15 Using the MAPK/JNK pathway inhibitor SP600125 that inhibits AP-1 activity (Fig. S4F), and the MAPK/p38 (MAPK11/12/13/14) pathway inhibitor SB202190 that inhibits CREB1 activity (Fig. S4G), we found that SP600125 inhibits both basal and UVB-induced AP-1 activity in NHEK cells (Fig. S4F), while it had no effect on either basal or UVB-induced PTGS2 upregulation at the protein, mRNA, and transcription levels (Fig. S4C to E). By contrast, SB202190 increased AP-1 activity while it inhibited both basal and UVB-induced CREB1 activity, and PTGS2 mRNA and protein expression (Fig. S4C to G). It is noteworthy that SB202190 also inhibited NFKB activity (Fig. S4H). SB202190 can inhibit more than one isoform of the MAPK11/12/13/14 proteins, and it remains to be determined its specificity toward each isoform.
Besides CREB1, it is possible that JUN and FOS also coordinately bind to the CRE element of the PTGS2 promoter to induce PTGS2 transcription in keratinocytes. In NHEK cells knockdown of either FOS or JUN reduced both basal PTGS2 protein level and UVB-induced PTGS2 upregulation (Fig. S4I and J). In addition, knockdown of the NFKB subfamily member RELA decreased both the basal PTGS2 level and UVB-induced PTGS2 upregulation (Fig. S4K and L). Furthermore, we found that SP600125 had no effect on the regulation of cytokines and angiogenesis factors that are affected by ATG7 knockdown (Fig. S5A). In contrast, the MAPK11/12/13/14 inhibitor SB202190, which inhibited both CREB1 and NFKB activity (Fig. S4G and H), resembled ATG7 knockdown and decreased expression of those cytokines regulated by ATG7 (Fig. S5A). Knockdown of both FOS and JUN or RELA alone partially decreased UVB-induced expression of those cytokines regulated by ATG7 (Fig. S5B). These data suggest that ATG7 regulates PTGS2 transcription through both the CRE and NFKB elements.
To determine the role of these regulatory elements in PTGS2 transcription regulation by ATG7, we mutated the NFKB-5′, NFKB-3′, NFIL6, or CRE element (Fig. 5A), and compared the response with wild-type PTGS2 promoter in NHEK cells after feeding the cells with fresh medium or conditioned medium. Only the NFIL6 and CRE sites were required for PTGS2 transcription in cells treated with fresh medium, while all 4 elements were required for PTGS2 transcription in NHEK cells with conditioned medium (Fig. 5B to E). Mutation of the CRE element blocked fresh medium-mediated and conditioned medium-regulated PTGS2 transcription in both siCON and siATG7 NHEK cells (Fig. 5D and E), indicating the critical role of the CRE element in PTGS2 transcription. ATG7 knockdown decreased PTGS2 transcription in wild-type (WT) promoter or promoters with mutations in NFKB-5′, NFKB-3′ or NFIL6, except for the CRE mutation in cells with fresh, but not conditioned, medium (Fig. 5D and E). ATG7 knockdown only inhibited reporter (RE) activity for CREB1-RE in cells with fresh medium, while it inhibited the activity of the NFKB-RE, CEBPB-RE, CREB1-RE and (AP-1)-RE reporters in cells with conditioned medium (Fig. 5F and G). PTGS2 expression was maintained until 60 h after feeding with fresh medium (Fig. S4I). These data indicate that ATG7 regulates PTGS2 expression through 2 mechanisms: (1) the cell autonomous mechanism through CREB1 and CRE, and (2) a non-cell autonomous mechanism.
Figure 5.
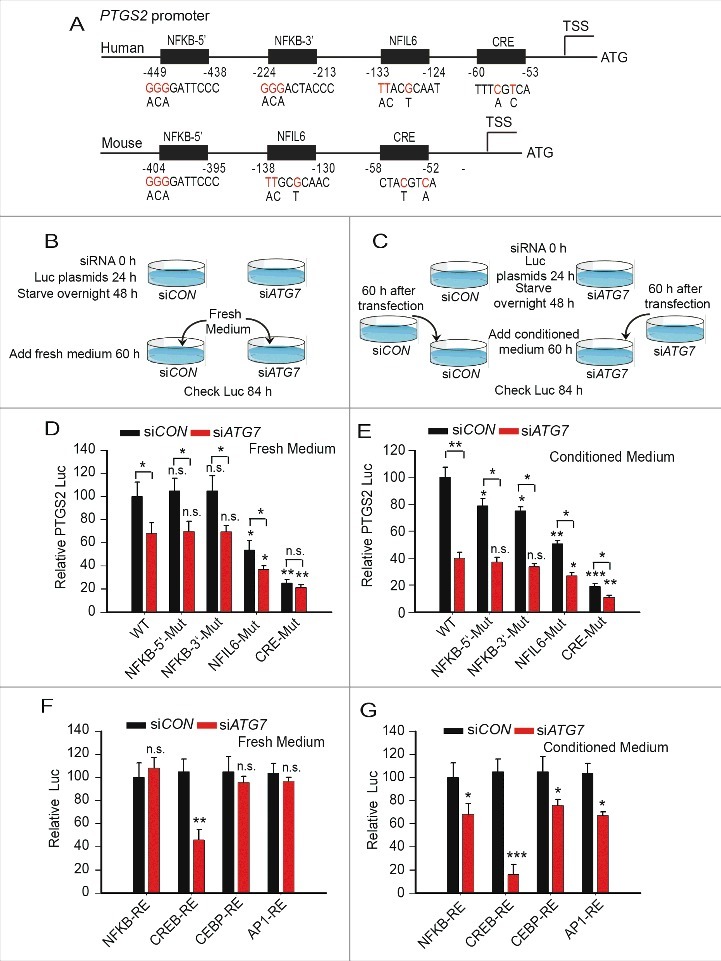
ATG7 promotes PTGS2 transcription through the CRE element in the PTGS2 promoter. (A) Schematic representation of the NFKB, NFIL6, and CRE sites of the human and mouse Ptgs2 promoters. Red nucleotides indicate mutations made in the human and mouse Ptgs2 promoters. (B and C) A schematic for experimental procedures used in D to G for fresh medium treatment (B, for D and F) and conditioned medium treatment (C, for E and G). (D and E) NHEK cells were transfected with siCON or siATG7, followed by transfection with the human PTGS2 promoter with a wild-type sequence or mutation of the NFKB-5′, NFKB-3′, NFIL6, or CRE element, the next day. Cells were cultured in growth-factor-free medium overnight, and then cultured in fresh medium (D) or conditioned medium from parallel NHEK cell cultures at 60 h post-transfection with siCON or siATG7 (E). A luciferase reporter assay of the PTGS2 promoter was performed at 24 h after the medium change. Results are mean±S.D. from 3 independent experiments; * P≤ 0.05 ** P≤ 0.001 compared with the siCON group. (F and G) NHEK cells were transfected with siCON or siATG7 followed by transfection with luciferase reporter plasmids with a repeat sequence of NFKB response element (NFKB-RE), a CEBPB response element (CEBPB-RE), a CREB1 response element (CREB1-RE), or an AP-1 response element ([AP-1]-RE) the next d. At 6 h after transfection the cells were cultured in growth factor-free medium. Cells were then cultured in fresh complete medium (F) or conditioned medium (G) and a luciferase reporter assay was performed as in D and E. Results are mean±S.D. from 3 independent experiments; * P≤ 0.05 ** P≤ 0.001 compared with the siCON group.
ATG7 is required for UVB-induced binding of EP300/p300 to CREB1 and CRTC1 localization in the nucleus
To determine the mechanism by which ATG7 regulates CREB1 activity, we compared the UVB response of the human keratinocyte cell line HaCaT stably transfected with shCON and shATG7 after serum starvation. UVB induced PTGS2 upregulation at 6 h; this effect was blocked by ATG7 knockdown (Fig. 6A). A similar inhibitory effect of Atg7 knockdown was observed in the mouse squamous cell carcinoma (SCC) cell line PAM212 (Fig. S6A). In addition, ATG7 knockdown inhibited UV-induced FOS upregulation while it had no effect on UVB-induced phosphorylation of MAPK11/12/13/14 or CREB1 (Fig. 6A). Both the CRE and NFIL6 elements were involved in UV-induced PTGS2 transcription, while only the CRE element was required for ATG7 regulated PTGS2 transcription (Fig. 6B and S6B). In addition to the UVB response, we also analyzed the role of ATG7 in PTGS2 regulation by EGF and TNF/TNF-α, the known growth factor and cytokine that activate the NFKB pathway. We found that the NFKB, CRE, and NFIL6 elements were all critical for EGF- and TNF-induced PTGS2 transcription, while the only CRE element that mediated PTGS2 transcription was ATG7-dependent (Fig. S6C to H). Although UVB did not activate the NFKB pathway directly (Fig. S6I), the NFKB pathway has an important role in UVB-induced PTGS2 expression, possibly through a non-cell autonomous mechanism(s) depending on the secretion of cytokines.
Figure 6.
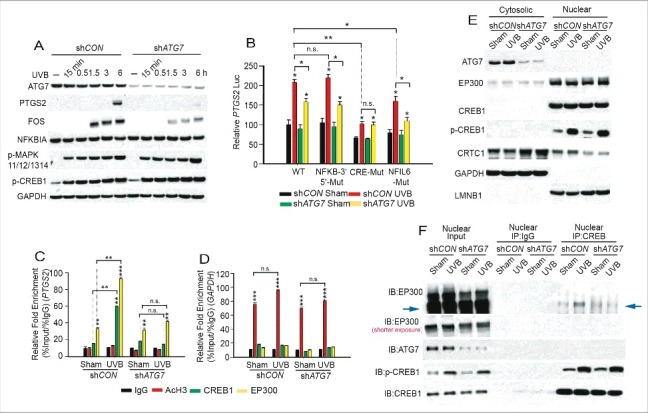
ATG7 is required for UVB-induced binding of EP300 to CREB1 and CRTC1 localization in the nucleus. (A) Immunoblot analysis of PTGS2, ATG7, FOS, p-CREB1, p-MAPK11/12/13/14, NFKBIA, and GAPDH in HaCaT cells stably transfected with shCON or shATG7, starved overnight and then treated with sham or UVB irradiation. Cells were collected at different time points post-UVB. Results were obtained from 3 independent experiments. (B) HaCaT cells stably transfected with shCON or shATG7 were then transfected with the human PTGS2 promoter with wild-type sequence or mutations of the NFKB-5′, NFKB-3′, NFIL6, or CRE elements. Cells were serum starved and then a luciferase reporter assay was performed at 8 h post-sham or UVB irradiation. Results are mean±S.D. from 3 independent experiments; * P≤ 0.05 ** P≤ 0.01 compared with the sham group. (C and D) Chromatin immunoprecipitation (ChIP) was performed in HaCaT cells stably transfected with shCON or shATG7 and starved for 24 h, and then collected at 3 h post-sham or -UVB irradiation using the indicated antibodies. Real-time PCR was performed with primers specific for the PTGS2 promoter region harboring the CRE site (upper panel) and for the human GAPDH promoter region as negative and positive controls (D; AcH3, acetylated histone H3). (E) Immunoblot analysis of EP300, ATG7, CRTC1, CREB1, p-CREB1, LMNB1, and GAPDH in cytosolic and nuclear fractions of HaCaT cells stably transfected with shCON or shATG7 and then collected at 3 h post-sham or UVB irradiation. (F) Coimmunoprecipitation was performed using the nuclear fraction of HaCaT cells stably transfected with shCON or shATG7 at 3 h post-sham or -UVB irradiation. CREB1 antibody was used for immunoprecipitation and IgG antibody was used as the negative control, followed by immunoblot analysis of EP300, ATG7, CREB1, and p-CREB1. The results were obtained from 3 independent experiments.
Although ATG7 regulated PTGS2 transcription through the CRE element, it had no effect on MAPK11/12/13/14/p38 and CREB1 pathway activation (Fig. 6A, S6C and E). EP300 and CRTC1 is an important transcription coactivators of CREB1,25 which can also be important for PTGS2 transcription. ATG7 deletion had no effect on EP300 protein levels (Fig. S6J). Overexpression of EP300 was found to upregulate PTGS2 in NHEK cells transfected with siCON but not in those transfected with siATG7, suggesting that PTGS2 regulation by EP300 is ATG7-dependent (Fig. S6K). Chromatin immunoprecipitation analysis showed that UVB irradiation increased the binding of CREB1 and EP300 to the PTGS2 promoter, and this was inhibited by ATG7 knockdown (Fig. 6C and D). We found that EP300 and CREB1 were localized mainly in the nucleus, whereas ATG7 was mainly cytosolic (Fig. 6E). Although ATG7 knockdown had no effect on EP300 and CREB1 subcellular localization, it decreased the nuclear localization of CRTC1 (Fig. 6E), the CREB1 transcription coactivator.25 Coimmunoprecipitation with nuclear CREB1 demonstrated that ATG7 knockdown inhibited UVB-induced binding of EP300 with CREB1 (Fig. 6F). These results demonstrate that ATG7 regulates PTGS2 transcription by controlling binding of EP300 to CREB1, possibly through modulation of nuclear CRTC1 levels.
ATG7 regulates PTGS2 expression through IL1B
Given that PTGS2 expression is known to be modulated in a paracrine fashion by some of the cytokines shown here to be deregulated by Atg7 deletion (Fig. 3K and L), we examined this link as a means to explain why Ptgs2 expression is reduced in Atg7-deleted keratinocytes in response to UVB. In the supernatant from NHEK cells, UVB irradiation increased the levels of secreted cytokines including IL1A/IL1α, IL1B, CXCL8, CCL1, CSF2 and PIGF, while ATG7 knockdown decreased the basal and UVB-induced secretion of those cytokines (Fig. 7A and B, S7A and B). ATG7 knockdown decreased the secreted basal level of CXCL1, IL1A, CXCL8, CXCL2, CSF3, IL1B, CSF2, ANG/angiogenin, MMP9, PTX3, F3, and VEGFA (Fig. 7A and B, S7A and B). Furthermore we found that regulation of these cytokines by ATG7, except for ANG and SERPINE1, occurred at the mRNA level (Fig. 7C). Since secreted IL1A and IL1B can activate the NFKB pathway to induce PTGS2 transcription through paracrine signaling,26,27 we assessed the role of IL1A and IL1B on PTGS2 regulation by ATG7. In NHEK cells, neutralizing antibodies against IL1A and especially IL1B inhibited both basal and UVB-induced PTGS2 expression (Fig. S7C). Conditioned medium from control NHEK cells increased both basal and UVB-induced PTGS2 expression in NHEK cells with ATG7 knockdown (Fig. 7D). Neutralizing antibodies against IL1A and IL1B blocked this effect of conditioned medium from control cells on ATG7 knockdown cells (Fig. 7E). ATG7 knockdown had no effect on PTGS2 protein levels induced by addition of exogenous IL1B (Fig. S7D) indicating that the likely defect explaining reduced PTGS2 expression in ATG7 knockdown cells is the failure to produce IL1B as opposed to a defect in signaling downstream of the IL1B receptor.
Figure 7.
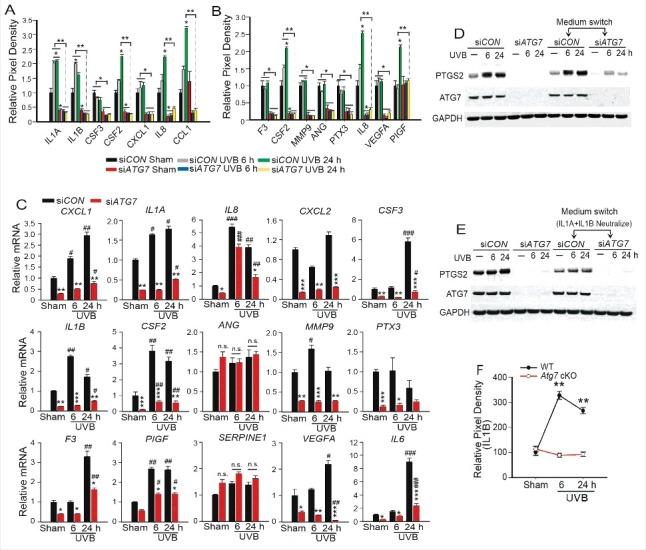
ATG7 regulates PTGS2 expression partly through IL1B. (A and B) Human cytokine array analysis (A) and human angiogenesis array analysis (B) of cell culture supernatants from NHEK cells transfected with siCON or siATG7 followed by sham- or UVB irradiation (20 mJ/cm2, collected at 6 or 24 h). The relative mean pixel density (% siCON sham) of differentially regulated factors is shown; * P≤ 0.05, ** P≤ 0.01, *** P≤ 0.001. (C) Real-time PCR analysis of CXCL1, IL1A, CXCL8, CXCL2, CSF1/M-CSF, IL1B, CSF2/GM-CSF, ANG, MMP9, PTX3, F3/Tissue factor, PIGF, SERPINE1, VEGFA/VEGF, and IL6 mRNA levels in NHEK cells transfected with siCON or siATG7 followed by sham or UVB irradiation as in B. Results are mean±S.D. from 3 independent experiments; * P≤ 0.05, ** P≤ 0.01, *** P≤ 0.001 compared with siCON group; # P≤ 0.05, ## P≤ 0.01, ### P≤ 0.001 compared with the sham group. (D) Immunoblot analysis of PTGS2, ATG7, and GAPDH in NHEK cells transfected with siCON or siATG7 and then exposed to sham or UVB irradiation. The recipient cells were cultured for 12 h in conditioned medium collected from donor cells at 48 h of culture, exposed to sham or UVB irradiation, and then collected at 6 or 24 h postirradiation. (E) Same as D, except that neutralizing antibodies against both IL1A and IL1B were added to the conditioned medium. Results were obtained from 3 independent experiments. (F) Cytokine array analysis of skin (Epidermis and Dermis) from WT and Atg7 cKO mice irradiated with sham and UVB once and collected at 6 or 24 h post irradiation. The relative mean pixel density (% WT sham) of differentially regulated cytokines was quantified; ** P≤ 0.01.
Among the cytokines upregulated by acute or chronic UVB radiation (Fig. 3K and L), only the levels of IL1B were increased at the 6-h time point (Fig. 7F and S7E) indicating that IL1B is at least in part an early cytokine response to UVB damage in the mouse skin. ATG7 knockdown blocked UVB-induced IL1B production (Fig. 7F and S7E). To determine whether PTGS2 contributes to ATG7 regulation of IL1A and IL1B expression, we overexpressed PTGS2 in siCON and siATG7 NHEK cells. Adding PTGS2 did not affect ATG7 regulation of IL1A and IL1B at the mRNA level (Fig. S7F to H). In NEHK cells the selective PTGS2 inhibitor celecoxib only inhibited MMP9 expression, while it had no effect on basal and UVB-induced IL1B (Fig. S7I and J). These data indicate that ATG7 regulates basal and UVB-induced PTGS2 expression through promoting IL1B secretion.
ATG5 knockdown inhibits UVB-induced expression of PTGS2 and cytokines
To determine whether the effect of ATG7 on UVB-induced inflammatory response in vitro is ATG7-specific or is through autophagy, we assessed the difference of UVB-induced expression of PTGS2 and cytokines in control and ATG5-knockdown keratinocytes. In NHEK cells, ATG5 knockdown reduced both basal and UVB-induced PTGS2 protein levels (Fig. 8A), mRNA levels (Fig. 8B), and promoter transcriptional activity (Fig. 8C). In HaCaT cells, similar to the effect of ATG7 knockdown, ATG5 knockdown reduced UVB-induced upregulation of PTGS2 protein (Fig. 8D), the expression of PTGS2 at 6 h post-UVB, and the expression of multiple cytokines at 24 h post-UVB (Fig. 8E). These findings indicate that ATG5 knockdown mimics ATG7 knockdown in regulating UVB-induced expression of inflammatory genes and suggest that ATG7 regulates UVB-induced inflammation and tumorigenesis through autophagy. Future studies using mouse models are required to determine the precise mechanism and the autophagy-dependency of ATG7 in UVB damage response.
Figure 8.
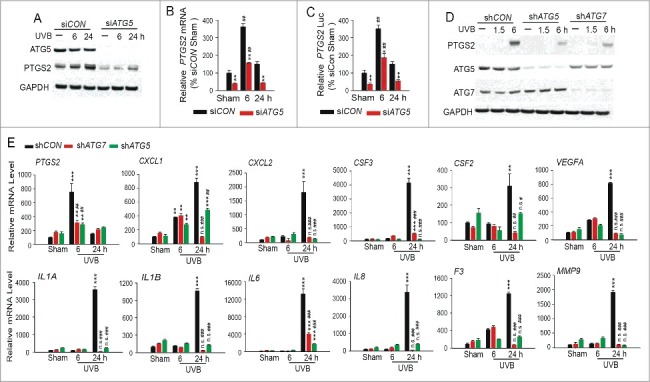
ATG5 knockdown inhibits UVB-induced expression of PTGS2 and cytokines. (A) Immunoblot analysis of PTGS2, ATG5, and GAPDH in NHEK cells transfected with siCON or siATG5, irradiated with sham or UVB irradiation, and then collected over a time course post-UVB. Results were obtained from 3 independent experiments. (B) Real-time PCR analysis for the PTGS2 mRNA levels in NHEK cells transfected with siCON or siATG5 and then irradiated with sham or UVB (at 6 or 24 h post-UVB). (C) Luciferase report assay of the PTGS2 promoter in NHEK cells transfected with siCON or siATG5 for 24 h and then transfected with the PTGS2 promoter for 24 h followed by sham-irradiation or UVB irradiation (at 6 or 24 h post-UVB). Results are mean±S.D. from 3 independent experiments; * P≤ 0.05, ** P≤ 0.01, *** P≤ 0.001 compared with siCON group; # P≤ 0.05, ## P≤ 0.01 compared with the sham group. (D) Immunoblot analysis of PTGS2, ATG5, ATG7 and GAPDH in HaCaT cells stably transfected with shCON, shATG5 or shATG7, starved overnight and then treated with sham or UVB irradiation. Cells were collected at different time points post-UVB. Results were obtained from 3 independent experiments. (E) Real-time PCR analysis of PTGS2, CXCL1, CXCL2, CSF3, CSF2, VEGFA, IL1A, IL1B, IL6, CXCL8, F3 and MMP9 mRNA levels in HaCaT cells stably transfected with shCON, shATG5 or shATG7, starved overnight and then treated with sham or UVB irradiation. Cells were collected at different time points post-UVB. Results were obtained from 3 independent experiments. Results are mean±S.D. from 3 independent experiments; * P≤ 0.05, ** P≤ 0.01, *** P≤ 0.001 compared with siCon group; # P≤ 0.05, ## P≤ 0.01, ### P≤ 0.001 compared with the sham group.
ATG7 regulates PTGS2 expression and UVB-induced skin tumorigenesis through regulating the AMPK and ER pathways
To determine the mechanism by which ATG7 regulates CRTC1 nuclear localization, we assessed the difference in CRTC1 phosphorylation, a known modification through the energy sensing kinase AMPK to regulate CRTC1 activity and nuclear localization.28 ATG7 knockdown increases the activation of the energy-sensing enzyme AMPK pathway, as shown by the increased phosphorylation of AMPK and the AMPK substrate ACACA/ACC, and the phosphorylation of CRTC1 (Fig. 9A). AMPK activation by ATG7 knockdown can be due to the decrease in nutrient supply due to autophagy deficiency. Pharmacological AMPK inhibition reduced CRTC1 phosphorylation in ATG7 knockdown cells (Fig. 9B), consistent with the role of AMPK in regulating CRTC1 phosphorylation and activation.28 These findings indicate that ATG7 knockdown activates the AMPK pathway and thus increases CRTC1 phosphorylation and inactivation.
Figure 9.
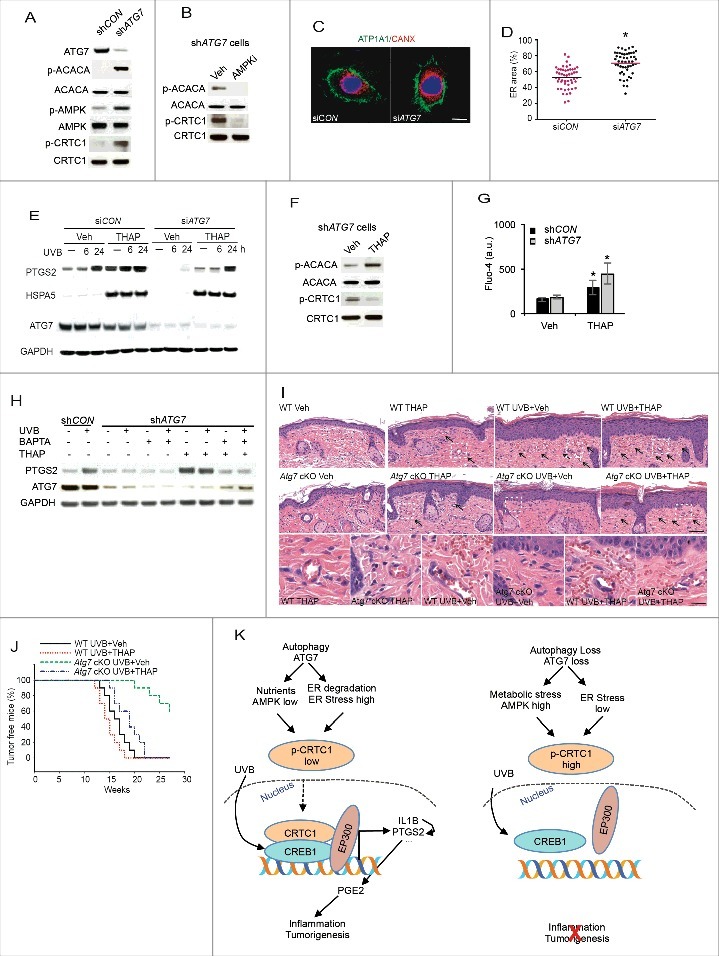
ATG7 regulates PTGS2 expression and UVB-induced skin tumorigenesis through regulating the AMPK and ER pathways. (A) Immunoblot analysis of ATG7, p-ACACA, ACACA, p-AMPK, AMPK, p-CRTC1 and CRTC1 in serum-starved shCON and shATG7 HaCaT cells. (B) Immunoblot analysis of p-ACACA, ACACA, p-CRTC1 and CRTC1 in serum-starved shATG7 HaCaT cells, treated with vehicle or the AMPK inhibitor compound C (AMPKi; 1 μM) for 6 h. (C) Immunofluorescence staining of ATP1A1/ATPase Na+/K+ transporting subunit alpha 1 and CANX/Calnexin in NHEK cells transfected with siCON or siATG7. Nuclei are counterstained with DAPI in blue. Scale bar: 5 μm. (D) Quantification of relative size of CANX-positive ER (n = 50). * P≤ 0.05 compared with the siCON group (Student t test). (E) Immunoblot analysis of PTGS2, HSPA5, and GAPDH in NHEK cells transfected with siCON or siATG7, treated with vehicle or thapsigargin (THAPS; 100 nM) at 1 h prior to and post-sham or -UVB, and then collected at 6 or 24 h post-UVB irradiation. (F) Immunoblot analysis of p-ACACA, ACACA, p-CRTC1 and CRTC1 in shATG7 HaCaT cells, treated with vehicle or thapsigargin (THAPS; 100 nM) for 6 h. (G) Fluo-4 flow cytometric analysis of cytosolic calcium level in shCON and shATG7 HaCaT cells, treated with vehicle or thapsigargin (THAPS; 100 nM) for 3 h. (H) Immunoblot analysis of PTGS2, ATG7, and GAPDH in serum-starved shCON and shATG7 HaCaT cells, treated with vehicle, or thapsigargin (THAPS; 100 nM), or BAPTA (10 μM) at 1 h prior to and post-sham or -UVB, and then collected at 6 h post-UVB irradiation. (I) Representative photomicrographs of HE skin sections from Atg7 WT and cKO mice with sham or acute UVB irradiation and topical THAPS treatment (25 ng in 0.2 ml of acetone, 1 h prior to and post-UVB irradiation). Vasodilatation and vascular leakage are indicated by black arrows. (J) Percentage of tumor-free mice in chronic UVB-irradiated WT and Atg7 cKO mice with or without topical THAPS treatment (n = 10). (K) A schematic summarizing the role of autophagy and ATG7 in UVB-induced inflammation and tumorigenesis through PTGS2.
Recent studies have demonstrated that selective autophagy can degrade the endoplasmic reticulum,29,30 an essential organelle for calcium storage and regulated release and protein folding.31 Thus we tested the role of the ER in autophagy-regulated PTGS2 expression and skin tumorigenesis following UVB irradiation. In NHEK cells, ATG7 knockdown significantly increased ER content (Fig. 9C and D). The ER stress inducer thapsigargin (THAPS) prevented the inhibitory effect of ATG7 knockdown on both basal and UVB-induced PTGS2, and the ER stress marker HSPA5/GRP78/Bip (Fig. 9E). Inducing ER stress and calcium mobilization by THAPS decreased CRTC1 phosphorylation (Fig. 9F) and increased cytosolic calcium level in both shCON and shATG7 cells (Fig. 9G). However, ATG7 loss alone did not affect calcium level at the basal level. Chelating calcium prevented THAPS-induced PTGS2 upregulation in ATG7 knockdown cells (Fig. 9H). These results suggest that ATG7 knockdown increases CRTC1 phosphorylation via activating AMPK, and inducing ER stress and calcium mobilization decreases CRTC1 phosphorylation and thus PTGS2 upregulation. In mice with epidermal Atg7 deletion, topical THAPS treatment increased UVB-induced epidermal hyperplasia, vasodilatation, vascular permeability (Fig. 9I), and skin tumorigenesis (Fig. 9J), and reversed the phenotype in mice with epidermal Atg7 deletion (Fig. 9I and J). These data indicate that Atg7 deletion leads to suppression of UVB-induced inflammation and skin tumorigenesis through regulating the AMPK and ER pathways.
Discussion
Our tumorigenicity studies have demonstrated that UVB radiation induces autophagy in the skin, and that epidermis-specific inhibition of Atg7 protects against UVB-induced inflammation and skin tumorigenesis through release of inflammatory cytokines and regulation of PTGS2 expression (Fig. 9K). Previous studies have shown that Celecoxib, a specific PTGS2 inhibitor, prevents UVB-induced skin tumorigenesis in mice,21,22 and human skin cancer in a clinical trial.32 These findings underscore the importance of PTGS2 regulation by autophagy as a new mechanism to regulate skin tumorigenesis. Our findings also provide compelling evidence that deletion of epidermal autophagy gene Atg7 leads to a suppression of stromal microenvironment inflammation in response to UVB radiation and thus prevents skin tumorigenesis.
The role of autophagy in tumor initiation and progress is complex depending on tissue context and the autophagy gene. The first and one of the strongest indications for tumor suppressor functions of autophagy is spontaneous tumorigenesis by heterozygous disruption of BECN1/Beclin 1.33,34 However, recently BECN1 has been shown to have additional tumor-suppressor functions that are independent of its role in autophagy and thus may not be shared with other autophagy genes such as ATG5 and ATG7.35,36 Here we show that the loss of Atg7 in the epidermis inhibits skin tumorigenesis. Our data are consistent with previous reports that used genetically engineered mouse models (GEMM) to show that the loss of Atg7 overall reduces tumorigenesis in the intestine, epidermal melanocytes, lung, and the prostate. 37–42 However, our findings differ from previous work showing that loss of Atg5 or Atg7 increases lung tumorigenesis and premalignant pancreatic lesions.43,44 However, loss of either Atg5 or Atg7 reduces pancreatic tumor progression.43,44 These results underscore the context-dependent role of autophagy in tumorigenesis in different cell types and carcinogenic inducers. Future investigation is required to determine the role of skin BECN1 and other autophagy genes in skin damage response and tumorigenesis.
It remains poorly understood how autophagy regulates inflammation in epithelial cells during tumorigenesis. Previous studies have shown that in autophagy-deficient cells, the accumulation of the selective autophagy cargo receptor and substrate SQSTM1 is sufficient to promote inflammation and tumorigenesis.45,46 Our data demonstrate that loss of Atg7 protects against both UVB-induced inflammation and tumorigenesis. The induction of IL1B by UVB radiation at least in part serves as an early molecular mediator to trigger the inflammatory molecular cascade and network, since (1) IL1B neutralization antibody inhibited both basal and UVB-induced PTGS2 upregulation (Fig. S7C), and (2) among all the cytokines tested, only IL1B production and secretion is induced by UVB at 6 h post-UVB irradiation and its induction is prevented by Atg7 deficiency (Fig. 7F). IL1B in its secreted form can promote inflammation, carcinogenesis, tumor invasiveness, and immunosuppression.47 In addition to IL1B, PTGS2 and PGE2 are critical mediators for UVB inflammation, immunosuppression and cancer.16, 20, 23, 48, 49 We have also shown that UVB-induced PTGS2 expression is regulated by at least 2 pathways: (1) UVB-induced IL1B secretion, and (2) UV-induced CREB1 activation. Both processes are positively regulated by ATG7. However, the role of autophagy may have different roles in different cell types under different stresses. In the monocyte response to inflammatory signals, selective autophagy induction inhibits IL1B production by degrading the inflammasomes,50 while in the fibroblast response to ionizing radiation-induced DNA damage, selective autophagy degradation of GATA4 is inhibited to promote cytokine expression and inflammation.51 Autophagy inhibits inflammation in keratinocytes in response to the activation of Toll-like receptors.52 These results underscore the complex role of autophagy in inflammation, depending on the context, including cell type and signaling pathway involved.
Our findings (Fig. 2 to 3) suggested that in UVB-induced inflammation, multiple types of cells are involved, including the activation of fibroblasts, the expansion, activation, or recruitment of immune cells, and alteration of endothelial cells in angiogenesis. Deletion of autophagy regulatory gene Atg7 led to the prevention of these UVB-induced cellular alterations, inflammation, and tumorigenesis. It is possible that one or multiple of these cellular changes plays active roles in UVB-induced inflammation, while the others are the consequence and late response of UVB-induced inflammatory response. Future studies using mouse models with ablation of individual cell types will help determine the precise role of these cells in inflammation and tumorigenesis. In addition, it is possible that apoptosis and senescence also play important roles for the consequence of Atg7 deletion in UVB-induced skin tumorigenesis. Although UVB-induced inflammation or sunburn response is usually in parallel with the formation of apoptotic cells in vivo (often referred as sunburn cells), Atg7 deficiency in the epidermis leads to an inhibition of inflammation, while it increased apoptosis, suggesting that both inflammation and cell survival play a role in UVB-induced tumorigenesis. Future investigations will elucidate the specific contribution of these mechanisms to the consequence of Atg7 deletion in tumorigenesis.
Our findings suggest that ATG7 deletion regulates PTGS2 expression through the AMPK and ER pathways. It seems that Atg7 regulates PTGS2 transcription indirectly, since we did not detect ATG7 in the nucleus. ATG7 deletion led to increased AMPK activation, likely as an adaptive response to the metabolic stress caused by autophagy deficiency. AMPK activation has been shown to increase the phosphorylation and inactivation of CRTC1.28 In addition, the ER pathways also played a role. ER is essential for calcium homeostasis, and protein folding and secretion. Disruption of the protein-folding environment in the ER leads to ER stress. Recent studies have shown that the ER is degraded by selective autophagy through the selective receptor RETREG1/FAM134B in mammals or Atg40 in yeast.29,30 Here we show that ATG7 is critical for ER homeostasis in keratinocytes (Fig. 9). In particular, ATG7 loss leads to ER accumulation. Inducing ER stress by thapsigargin reverses the inflammation and tumorigenesis phenotype in mice with epidermal Atg7 deletion. Thapsigargin-increased cytosolic calcium levels can lead to the activation of PPP3/calcineurin, a phosphatase activating CRTC1.28 Consistently ER stress has been shown to activate CREB1,53 possibly through CRTC1 regulation, which requires further investigation. In addition, ER stress also induces production of cytokines including IL1B through activating ERN1/IRE1α.54 Therefore it is possible that Atg7 deletion leads to changing ER homeostasis and function, and thus modulates PTGS2 expression through both regulating CREB1 and IL1B, and suppressing UVB-induced protumorigenic inflammatory microenvironment and tumorigenesis.
Materials and methods
Human skin tumor samples
All human specimens were studied after approval by the University of Chicago Institutional Review Board. Formalin-fixed, paraffin-embedded tissue blocks were obtained from the archives in the tissue bank of the Section of Dermatology, Department of Medicine, University of Chicago. Non-sun-exposed nonlesional normal epidermis and SCC tissues were used for immunohistochemical analysis of MAP1LC3B protein levels.
Cell culture
Normal human epidermal keratinocytes (NHEK) cells were cultured according to the manufacturer's instructions (Lonza, 192906). HaCaT, PAM212, and HEK-293T cells were cultured as described previously.55 For TNF, EGF, IL1B, or UVB treatment, cells were washed with PBS (Thermo Fisher Scientific, 20012050) twice and incubated with serum free DMEM medium overnight and then replaced with serum free DMEM supplemented with TNF (50 ng/ml, R&D Systems, 210-TA), EGF (50 ng/ml, R&D Systems, 236-EG), or IL1B (50 ng/ml, R&D Systems, 201-LB) for the indicated time, or UVB irradiation (20 millijoule [mJ]/cm2). For some experiments, cells were treated with a pharmacological inhibitor of the MAPK11/12/13/14 pathway (SB202190, 20 µM; Sigma-Aldrich, S7067), an inhibitor of the MAPK/JNK pathway (SP600125, 20 µM; Sigma-Aldrich, S5567), an inhibitor of the AMPK pathway (compound C, 1 μM; Abcam, ab120843), an calcium chelator (BAPTA, 10 μM; Abcam, ab144924) or a PTGS2/cyclooxygenase 2 inhibitor (Celecoxib, 10 µM; R&D Systems, 3786) for the indicated time. For others, cells were treated with anti-IL1A neutralization antibody (200 ng/ml R&D Systems, AF-200-NA), anti-IL1B neutralization antibody (500 ng/ml, R&D Systems, AF-201-NA), which neutralize IL1A and IL1B respectively in the culture medium of the NHEK cells, or an isotype-matched IgG1 monoclonal control antibody (R&D Systems, AB-108-C).
Animals, UVB irradiation, and PGE2 topical treatment
All animal resources have been approved by the University of Chicago Institutional Animal Care and Use Committee. Atg7flox/ flox (Wild type, WT), K14Cre;Atg7flox/ +(heterozygous conditional knockout, cHet); K14Cre;Atg7flox/ flox (homozygous conditional knockout, cKO) mice in the SKH-1 background were used for UVB irradiation experiments. Mice were exposed to sham, one UVB, acute UVB, or chronic UVB irradiation as described in our recent studies.56,57 For chronic UVB irradiation and tumorigenesis studies, WT, Atg7 cHet, or Atg7 cKO mice (n = 15) were irradiated with UVB every other day 3 times a wk for 27 wk, and tumor formation was recorded as described in our recent studies.56,57 The initial dose of UVB was 80 mJ/cm2 for the first wk, followed by a weekly 10% increase until a dose of 100 mJ/cm2 was reached. Mice were housed 5 animals per cage, and there was no evidence of dorsal wounds caused by fighting or sunburn. For selected tumorigenesis experiments, mice were treated topically with PGE2 (100 µg in 0.2 ml acetone) or thapsigargin (THAPS, 25 ng in 0.2 ml of acetone; Sigma-Aldrich, T9033) immediately after each UVB exposure. Control animals were treated topically with acetone (0.2 ml). For acute UVB treatment, mice were irradiated with UVB irradiation (100 mJ/cm2) 3 times every other d and skin samples were collected 24 h after the final UVB irradiation. For some experiments, mice were irradiated once with UVB irradiation (100 mJ/cm2) and skin samples were collected at 6 h or 24 h post-UVB irradiation.
Intradermal injection of PGE2
A stock solution of PGE2 (R&D Systems, 2296, 45 mM,) was prepared in ethanol, and further dilutions were made in saline; the final concentration of ethanol was less than 1%. A 20 μl volume of a working solution of PGE2 (400 μM) was injected into the backs of the mice intradermally with a hypodermic 26 g needle. Thirty min after the injection, skin was collected for immunofluorescence analysis.
Contact hypersensitivity (CHS) assay post-UVB
A CHS response was analyzed as detailed previously.48 The dorsal skin of mice (n = 5) was exposed to UVB radiation (100 mJ/cm2) 3 times every other d. During the UV exposure, the ears of the mice were protected from the UV irradiation. Twenty-four h after the last UV exposure, mice were sensitized by painting with 25 µl of 0.5% 2,4-dinitrofluorobenzene (DNFB; Fisher Scientific, AC117030050) in acetone/olive oil (4:1, vol:vol) on the UVB-irradiated skin site. A contact hypersensitivity (CHS) response was elicited 6 days later by painting both surfaces of both ears of each mouse with 20 µl of 0.2% DNFB in acetone/olive oil (4:1, vol:/vol). The ear skin thickness was measured 24 h after the challenge using an engineer's micrometer (Mitutoyo, 323–350-30CAL, Tokyo, Japan) and was compared with the ear thickness prior to the challenge, as detailed previously.48
Measurement of transepidermal water loss (TEWL)
Transepidermal water loss (TEWL) was measured on the dorsal skin of mice with a DPM9003 device (Nova Technology, DPM 9003, East Hanover, NJ), as described previously.58,59
siRNA and plasmid transfection
NHEK cells were transfected with negative control (siNC) or siRNA (ON-TARGETplus SMARTpool, Dharmacon, Lafayette, CO) targeting ATG7 (L-020112-00), ATG5 (L-004374–00), FOS (L-020112–00), JUN (L-020112–00), or RELA (L-080033–02) using Amaxa Nucleofector according to the manufacturer's instructions as described previously.59,60 NHEK cells were transfected with pCMV vector (OriGene Technologies, PS100001), pCMV-EP300 (Addgene, 30489; deposited by Tso-Pang Yao), or pCMV-PTGS2 using X-tremeGENE HP (Roche, 6366244001) as described previously.55, 59, 60 Knockdown of ATG7 in HaCaT cells was performed using lentiviral vectors as described previously.55
Immunofluorescence and computer-assisted morphometric vessel analysis
Immunofluorescence was done as described previously.55 After removal of the blocking solution, cells were incubated at room temperature in primary guinea pig anti-SQSTM1 (1:500; Progen Biotechnik, GP62-C), rabbit anti-LYVE1 (1:200; Abcam, ab14917), rabbit anti-PTGS2 (1:100; Abcam, ab15191), rabbit anti-ACTA1 (1:100; Abcam, ab3280), anti-CANX (1:100; Cell Signaling, 2679), anti-ATP1A1/NA-K-ATPase (1:100; Abcam, ab7671), or rabbit anti-PECAM1 (1:50; Abcam, ab28364) for 30 min. After washing with PBS, cells were incubated at room temperature for 1 h with Alexa Fluor 488 F (ab’) 2 fragments of goat anti-guinea pig IgG antibodies (Fisher Scientific, A-11073) and Alexa Fluor 568 of goat anti-rabbit IgG antibodies (Fisher Scientific, A-11036). Cells were then fixed in Prolong Gold Antifade with DAPI (Fisher Scientific, P-36941) to visualize the cell nuclei, and observed under a fluorescence microscope (Olympus IX71, Tokyo, Japan) with a peak excitation wavelength of 340nm. Morphometric vessel analyses were performed using Adobe Photoshop as described. .61 The number of vessels per high-power field (HPF; × 400 magnification), the average vessel size, and the relative tissue area occupied by vessels were determined in the dermis in an area within 200 μm of the epidermal-dermal junction.
Western blotting
Western blotting was performed as described previously.24,55 Antibodies used were as follows: EP300 (Santa Cruz Biotechnology, SC48343), LMNB1/Lamin B1 (Santa Cruz Biotechnology, SC6216) and GAPDH (Santa Cruz Biotechnology, SC47724) from Santa Cruz Biotechnology; CREB1 (Cell Signaling Technology, 9197), p-CREB1 (Cell Signaling Technology, 9198), ATG7 (Cell Signaling Technology, 8558), ATG5 (Cell Signaling Technology, 8540), RELA (Cell Signaling Technology, 8242), AMPK (Cell Signaling Technology, 5832), p-AMPK (Cell Signaling Technology, 2535), ACACA (Cell Signaling Technology, 3676), p-ACACA (Cell Signaling Technology, 11818), p-MAPK11/12/13/14 (Cell Signaling Technology, 4511), HSPA5 (Cell Signaling Technology, 3177ACC), FOS (Cell Signaling Technology, 2250), JUN (Cell Signaling Technology, 9165), p-JUN (Cell Signaling Technology, 3270), NFKBIA/IκB-α (Cell Signaling Technology, 4814) and p-NFKBIA (Cell Signaling Technology, 3033) from Cell Signaling Technology; PTGS2 from Abcam (Abcam, ab15191), and SQSTM1 from Progen Biotechnik (Progen Biotechnik, GP62-C).
Luciferase reporter assays
The luciferase activity was measured as described previously.55 Human pGL3 PTGS2-Luc promoter was kindly provided by Dr. Giancarlo V. De Ferrari (Universidad Andres Bello, Santiago, Chile). pGL3 h-PTGS2 (NFκB-5′ mutation)-Luc, pGL3 h-PTGS2 (NFκB-3′ mutation)-Luc, pGL3 h-PTGS2 (NFIL6 mutation)-Luc, and pGL3 h-PTGS2 (CREB1 mutation)-Luc constructs were generated using a QuikChange XL site-directed mutagenesis kit following the manufacturer's instructions (Agilent Technologies, Santa Clara, CA) as described previously.55 Mouse pGL3 PTGS2-Luc constructs were kindly provided by Dr. Bethany B. Moore (University of Michigan, Ann Arbor, MI). pGL3 m-PTGS2 (NFκB mutation)-Luc, m-PTGS2 (NFIL6 mutation)-Luc, and m-PTGS2 (CREB1 mutation)-Luc constructs were generated using a QuikChange XL site-directed mutagenesis kit following the manufacturer's instructions (Agilent Technologies, Santa Clara, CA) as described previously.55 pGL4.32[luc2P/NFKB-RE/Hygro] (N111), pGL4.44[luc2P/AP1-RE/Hygro] (E4111), pGL4.29[luc2P/CRE/Hygro] (E8471), and pNL[NlucP/CEBPB-RE/Hygro] (CS185201) vectors were obtained from Promega. Cells were transfected with 2 μg luciferase plasmids and 0.025 μg of pRL-TK (Promega, E2241; used as a transfection efficiency control) using X-tremeGENE HP (Sigma-Aldrich, 06366236001) as described previously.55 The luciferase activity was measured as described previously.55, 62–63
Quantitative real-time PCR
Quantitative real-time PCR assays were performed using a CFX Connect real-time system (Bio-Rad, Hercules, CA, 1855201) with Bio-Rad iQ SYBR Green Supermix (Bio-Rad, 1708880) as described previously.55,64 Amplification primers are listed in Table S1.
Site directed mutagenesis
Mutations of human and mouse wild-type pGL3-PTGS2 plasmid were carried out using a QuikChange XL site-directed mutagenesis kit following the manufacturer's instructions (Agilent Technologies, 200517). The primers used for introducing the amino acid changes are listed in Table S2. All mutants were confirmed by sequencing.
Toluidine blue staining for mast cells
Toluidine blue staining for mast cells was performed according to the manufacturer's protocol (NovaUltra, IW-3013) as described previously.59 Mast cells will be stained blue, whereas degranulated mast cells will be stained reddish purple (metachromatic staining) due to its granules. The numbers of degranulated mast cells (with reddish purple granules) were calculated as the average from 22 or 35 different fields of each sample (HPF; × 400 magnification).
Masson trichrome staining
Masson trichrome staining for collagen fibers in the dermis was performed according to the manufacturer's protocol (Sigma-Aldrich, HT15–1KT).
Determination of PGE2 production
The PGE2 concentration in the mouse skin was quantified using a competitive enzyme immunoassay kit (R&D Systems, SKGE004B) according to the manufacturer's instructions.
Determination of calcium levels by Fluo-4
Cytosolic calcium levels were determined using Fluo-4 (Thermo Fisher, F14201) according to the manufacturer's instructions. Briefly, cells were loaded with Fluo-4 AM at a final concentration of 3 μM for 30 min at 37°C in serum-free, antibiotic-free medium. Next cells were washed 3 times with PBS and incubated with in serum-free, antibiotic-free medium for 15 min. Then cells were collected for flow cytometric analysis using BD FACSCalibur flow cytometer (Becton Dickinson, Franklin Lakes, NJ).
Histological and Immunohistochemical analysis
Hematoxylin and eosin (H&E) staining of tissues and immunohistochemical analysis of CD4 (Fisher Scientific, NC9038070), ITGAM (eBioscience, 14–0112-82), ADGRE1 (AbD Serotec, MCA497GA), MAP1LC3B (LC3B, NanoTools, 0231–100/LC3–5F10), SQSTM1 (Progen Biotechnik,GP62-C), PTGS2 (Abcam, ab15191) and MPO (Myeloperoxidase,Thermo Scientific, B-373-A0) were performed by the Immunohistochemistry core facility at the University of Chicago. Epidermal thickness was measured on H&E stained sections, using a 20 × objective.
Immunohistochemical analysis of CD4 (Fisher Scientific, NC9038070) and ITGAM (eBioscience, 14–0112-82) was performed using frozen sections. Briefly, the frozen tissues were sliced to a 5 μm thickness in a cryostat and treated with picric acid formalin for 10 min. Mouse anti-ITGAM (0.5 μg/ml, eBioscience, 14–0112-82, clone: M1/70) and mouse anti-CD4 (2 μg/ml, clone GK1.5, Fisher Scientific, NC9038070) antibodies were applied on tissue sections for a 1-h incubation at room temperature. Following a TBS wash, tissue sections were incubated with biotinylated anti-mouse IgG (10 μg/ml, Vector laboratories, BA-4001) for 30 min at room temperature. The antigen-antibody binding was detected with an Elite kit (Vector Laboratories, PK-6100,) and DAB (DAKO, K3468) system.
Immunohistochemical analysis of ADGRE1 (AbD Serotec, MCA497GA), MAP1LC3B (NanoTools, 0231–100/LC3–5F10), SQSTM1 (Progen Biotechnik,GP62-C), PTGS2 (Abcam, ab15191) and MPO (myeloperoxidase; ThermoScientific, B-373-A0) was performed with paraffin-embedded tissue. Briefly, tissue sections were deparaffinized and rehydrated with xylenes followed by serial dilutions of EtOH to deionized water. They were incubated in antigen retrieval buffer (DAKO, S1699) and heated in a steamer at over 97°C for 20 min. Primary mouse anti-ADGRE1 antibody (1:200; AbD Serotec, MCA497GA), rabbit anti-MPO antibody (1:100; ThermoScientific, B-373-A0), rabbit anti-SQSTM1 antibody (1:1000; Progen Biotechnik, GP62-C), rabbit anti-MAP1LC3B antibody (1:200; NanoTools, 0231–100/LC3–5F10), and rabbit anti-PTGS2 antibody (1:500; Abcam, ab15191) were applied on tissue sections for a 1-h incubation at room temperature. Following a TBS wash, tissue sections were incubated with biotinylated anti-rat IgG (10 μg/ml; Vector laboratories, BA-4001) for 30 min at room temperature. The antigen-antibody binding was detected with an Elite kit (Vector Laboratories, PK-6100) and a DAB (DAKO, K3468) system.
Chromatin immunoprecipitation assay
ChIP assays, using 1 × 10⁷ HaCaT cells, were performed as previously described,65 using a Magna Chip™ A kit (EMD Millipore, 17–10085). Precipitates were cross-linking reversed and DNA was purified according to the manufacturer's protocols. qPCR analyses were carried out with the following primers: 5′- CAGTCATTTCGTCACATGGG −3′ (forward), 5′- CTGACGCTCACTGCAAGT −3′ (reverse) for the human PTGS2 promoter; 5′- TACTAGCGGTTTTACGGGCG-3′ (forward) and 5′- TCGAACAGGAGGAGCAGAGAGCGA-3′ (reverse) for the human GAPDH promoter. For qPCR analysis, fold enrichment was determined using the ΔΔCt method: Fold enrichment = 2−(Δct1−ΔCt2), where ΔCt 1 is the ChIP of interest and ΔCt2 is the normal IgG ChIP.
Nuclear complex co-immunoprecipitation
Co-immunoprecipitation of the nuclear complex was performed using a Nuclear Complex CoIP Kit (Active Motif, 54001) according to the manufacturer's instructions.
Cytokine array analysis
Cytokine array analysis was performed using the mouse cytokine array panel A (R&D Systems, ARY006), a mouse angiogenesis array kit (R&D Systems, ARY015), a human cytokine array kit (R&D Systems, ARY005), and a human angiogenesis array kit (R&D Systems, ARY007) following the manufacturer's instructions. The intensity of the selected dots was analyzed using ImageJ (NIH) software. Duplicates were averaged and the background subtracted to calculate the mean pixel density for each factor.
Statistical analyses
Statistical analyses were carried out using Prism 6 (GraphPad software, San Diego, CA, USA) as described previously.55 Data are reported as mean ± S.D. Data were expressed as the mean of at least 3 independent experiments and analyzed by the Student t test. Log-rank tests were used to evaluate tumor onset (tumor-free mice %). A P value of <0.05 was considered statistically significant.
Abbreviations
- ACACA
acetyl-CoA carboxylase alpha
- ACTA2
actin, alpha 2, skeletal muscle, aorta
- ADGRE1
adhesion G protein-coupled receptor E1
- AMPK
AMP-activated protein kinase
- Atg/ATG
autophagy-related
- AREG
amphiregulin
- C5
complement C5
- CCL1 C-C
motif chemokine ligand 1
- CCL2 C-C
motif chemokine ligand 2
- CCL3 C-C
motif chemokine ligand 3
- CXCL1
C-X-C motif chemokine ligand 1
- CXCL2
C-X-C motif chemokine ligand 2
- CXCL9
C-X-C motif chemokine ligand 9
- cHet
conditional heterozygous knockout
- cKO
conditional homozygous knockout
- CREB1
cAMP responsive element binding protein 1
- CRTC1
CREB regulated transcription coactivator 1
- CSF1
colony stimulating factor 1
- CSF3
colony stimulating factor 3
- CYR61
cysteine rich angiogenic inducer 61
- EDN1
endothelin 1
- EP300
E1A binding protein p300
- ER
endoplasmic reticulum
- F3
coagulation factor III, tissue factor
- FOS
Fos proto-oncogene, AP1 transcription factor subunit
- HGF
hepatocyte growth factor
- HSPA5
heat shock protein family A (Hsp70) member 5
- IL1A
interleukin 1 alpha
- IL1B
interleukin 1 beta
- IL6
interleukin 6
- IP
immunoprecipitation
- ITGAM
integrin subunit alpha M
- JUN
Jun proto-oncogene, AP-1 transcription factor subunit
- LYVE1
lymphatic vessel endothelial hyaluronan receptor 1
- MAP1LC3B/LC3B
microtubule-associated protein 1 light chain 3 beta
- MAPK11/p38beta
mitogen-activated protein kinase 11
- MMP8
matrix metallopeptidase 8
- Mut
mutant
- PCR
polymerase chain reaction
- PECAM1
platelet/endothelial cell adhesion molecule 1
- PGE2
prostaglandin E2
- PTGS2
prostaglandin-endoperoxide synthase 2
- PTX3
pentraxin 3
- RELA
RELA proto-oncogene, NFKB subunit
- SCC
squamous cell carcinoma
- SERPINE1
serpin family E member 1
- siCON
siRNA, negative control
- siATG
siRNA targeting ATG genes
- shCON
shRNA, negative control
- shATG
shRNA targeting ATG genes
- SPP1
secreted phosphoprotein 1
- SQSTM1
sequestosome 1
- THAPS
thapsigargin
- TREM1
triggering receptor expressed on myeloid cells 1
- UV
ultraviolet radiation
- UVB
ultraviolet B radiation
- VEGFA
vascular endothelial growth factor A
- Veh
vehicle
- WT
wild type
Disclosure of Potential Conflicts of Interest
No potential conflicts of interest were disclosed.
Acknowledgments
We thank Dr. M. Komatsu for providing the Atg7fl/fl mice, Dr. Norbert Fusenig for providing the HaCaT cells, and Yuspa Stuart for providing the PAM212 cells, Dr. Giancarlo V. De Ferrari for providing the PTGS2-Luc plasmid, Dr. Bethany B. Moore for providing the mouse Ptgs2-Luc plasmid, Terri Li for immunohistochemistry, and Dr. Ann Motten for a critical reading of the manuscript. This work was supported by the NIH/NIEHS grant ES024373 and ES016936 (YYH), the American Cancer Society (ACS) grant RSG-13–078-01 (YYH), the University of Chicago Cancer Research Center (P30 CA014599), the CTSA (UL1 TR000430), and the University of Chicago Friends of Dermatology Endowment Fund.
References
- 1.Klionsky DJ. Autophagy: from phenomenology to molecular understanding in less than a decade. Nat Rev Mol Cell Biol. 2007;8:931–37. https://doi.org/ 10.1038/nrm2245. PMID:17712358 [DOI] [PubMed] [Google Scholar]
- 2.Mizushima N, Levine B, Cuervo AM, Klionsky DJ. Autophagy fights disease through cellular self-digestion. Nature. 2008;451:1069–75. https://doi.org/ 10.1038/nature06639. PMID:18305538 [DOI] [PMC free article] [PubMed] [Google Scholar]
- 3.Mizushima N, Yoshimori T, Ohsumi Y. The role of Atg proteins in autophagosome formation. Annu Rev Cell Dev Biol. 2011;27:107–32. https://doi.org/ 10.1146/annurev-cellbio-092910-154005. PMID:21801009 [DOI] [PubMed] [Google Scholar]
- 4.Khaminets A, Behl C, Dikic I. Ubiquitin-Dependent And Independent Signals In Selective Autophagy. Trends Cell Biol. 2016;26:6–16. https://doi.org/ 10.1016/j.tcb.2015.08.010. PMID:26437584 [DOI] [PubMed] [Google Scholar]
- 5.Choi AM, Ryter SW, Levine B. Autophagy in human health and disease. N Engl J Med. 2013;368:1845–46. https://doi.org/ 10.1056/NEJMra1205406. PMID:23656658 [DOI] [PubMed] [Google Scholar]
- 6.White E. Deconvoluting the context-dependent role for autophagy in cancer. Nat Rev Cancer. 2012;12:401–10. https://doi.org/ 10.1038/nrc3262. PMID:22534666 [DOI] [PMC free article] [PubMed] [Google Scholar]
- 7.Galluzzi L, Pietrocola F, Bravo-San Pedro JM, Amaravadi RK, Baehrecke EH, Cecconi F, Codogno P, Debnath J, Gewirtz DA, Karantza V, et al.. Autophagy in malignant transformation and cancer progression. EMBO J. 2015;34:856–80. https://doi.org/ 10.15252/embj.201490784. PMID:25712477 [DOI] [PMC free article] [PubMed] [Google Scholar]
- 8.Kimmelman AC. The dynamic nature of autophagy in cancer. Genes Dev. 2011;25:1999–2010. https://doi.org/ 10.1101/gad.17558811. PMID:21979913 [DOI] [PMC free article] [PubMed] [Google Scholar]
- 9.Zhi X, Zhong Q. Autophagy in cancer. F1000Prime Rep 2015;7:18. https://doi.org/ 10.12703/P7-18. PMID:25750736 [DOI] [PMC free article] [PubMed] [Google Scholar]
- 10.Rogers HW, Weinstock MA, Harris AR, Hinckley MR, Feldman SR, Fleischer AB, Coldiron BM. Incidence estimate of nonmelanoma skin cancer in the United States, 2006. Arch Dermatol. 2010;146:283–87. https://doi.org/ 10.1001/archdermatol.2010.19. PMID:20231499 [DOI] [PubMed] [Google Scholar]
- 11.D'Orazio J, Jarrett S, Amaro-Ortiz A, Scott T, UV Radiation and the Skin. Int J Mol Sci. 2013;14:12222–48. https://doi.org/ 10.3390/ijms140612222. PMID:23749111 [DOI] [PMC free article] [PubMed] [Google Scholar]
- 12.Bernard JJ, Cowing-Zitron C, Nakatsuji T, Muehleisen B, Muto J, Borkowski AW, Martinez L, Greidinger EL, Yu BD, Gallo RL. Ultraviolet radiation damages self noncoding RNA and is detected by TLR3. Nat Med. 2012;18:1286–90. https://doi.org/ 10.1038/nm.2861. PMID:22772463 [DOI] [PMC free article] [PubMed] [Google Scholar]
- 13.Hanahan D, Weinberg RA. Hallmarks of cancer: the next generation. Cell. 2011;144:646–74. https://doi.org/ 10.1016/j.cell.2011.02.013. PMID:21376230 [DOI] [PubMed] [Google Scholar]
- 14.Bode AM, Dong Z. Mitogen-activated protein kinase activation in UV-induced signal transduction. Sci STKE. 2003;2003:RE2. PMID:12554854 [DOI] [PubMed] [Google Scholar]
- 15.Bowden GT. Prevention of non-melanoma skin cancer by targeting ultraviolet-B-light signalling. Nat Rev Cancer. 2004;4:23–35. https://doi.org/ 10.1038/nrc1253. PMID:14681688 [DOI] [PubMed] [Google Scholar]
- 16.Kim Y, He YY. Ultraviolet radiation-induced non-melanoma skin cancer: Regulation of DNA damage repair and inflammation. Genes Dis. 2014;1:188–98. https://doi.org/ 10.1016/j.gendis.2014.08.005. PMID:25642450 [DOI] [PMC free article] [PubMed] [Google Scholar]
- 17.Nasti TH, Timares L. Inflammasome activation of IL-1 family mediators in response to cutaneous photodamage. Photochem Photobiol. 2012;88:1111–25. https://doi.org/ 10.1111/j.1751-1097.2012.01182.x. PMID:22631445 [DOI] [PMC free article] [PubMed] [Google Scholar]
- 18.Buckman SY, Gresham A, Hale P, Hruza G, Anast J, Masferrer J, Pentland AP. COX-2 expression is induced by UVB exposure in human skin: implications for the development of skin cancer. Carcinogenesis. 1998;19:723–29. https://doi.org/ 10.1093/carcin/19.5.723. PMID:9635856 [DOI] [PubMed] [Google Scholar]
- 19.Tiano HF, Loftin CD, Akunda J, Lee CA, Spalding J, Sessoms A, Dunson DB, Rogan EG, Morham SG, Smart RC, et al.. Deficiency of either cyclooxygenase (COX)-1 or COX-2 alters epidermal differentiation and reduces mouse skin tumorigenesis. Cancer Res. 2002;62:3395–3401. PMID:12067981 [PubMed] [Google Scholar]
- 20.Rundhaug JE, Mikulec C, Pavone A, Fischer SM. A role for cyclooxygenase-2 in ultraviolet light-induced skin carcinogenesis. Mol Carcinog. 2007;46:692–98. https://doi.org/ 10.1002/mc.20329. PMID:17443745 [DOI] [PubMed] [Google Scholar]
- 21.Pentland AP, Schoggins JW, Scott GA, Khan KN, Han R. Reduction of UV-induced skin tumors in hairless mice by selective COX-2 inhibition. Carcinogenesis. 1999;20:1939–44. https://doi.org/ 10.1093/carcin/20.10.1939. PMID:10506108 [DOI] [PubMed] [Google Scholar]
- 22.Wilgus TA, Koki AT, Zweifel BS, Kusewitt DF, Rubal PA, Oberyszyn TM. Inhibition of cutaneous ultraviolet light B-mediated inflammation and tumor formation with topical celecoxib treatment. Mol Carcinog. 2003;38:49–58. https://doi.org/ 10.1002/mc.10141. PMID:14502644 [DOI] [PubMed] [Google Scholar]
- 23.Jiao J, Mikulec C, Ishikawa TO, Magyar C, Dumlao DS, Dennis EA, Fischer SM, Herschman H. Cell-type-specific roles for COX-2 in UVB-induced skin cancer. Carcinogenesis. 2014;35:1310–9. https://doi.org/ 10.1093/carcin/bgu020. PMID:24469308 [DOI] [PMC free article] [PubMed] [Google Scholar]
- 24.Qiang L, Wu C, Ming M, Viollet B, He YY. Autophagy controls p38 activation to promote cell survival under genotoxic stress. J Biol Chem. 2013;288:1603–11. https://doi.org/ 10.1074/jbc.M112.415224. PMID:23212914 [DOI] [PMC free article] [PubMed] [Google Scholar]
- 25.Altarejos JY, Montminy M. CREB and the CRTC co-activators: sensors for hormonal and metabolic signals. Nat Rev Mol Cell Biol. 2011;12:141–51. https://doi.org/ 10.1038/nrm3072. PMID:21346730 [DOI] [PMC free article] [PubMed] [Google Scholar]
- 26.Napetschnig J, Wu H. Molecular basis of NF-kappaB signaling. Annu Rev Biophys. 2013;42:443–68. https://doi.org/ 10.1146/annurev-biophys-083012-130338. PMID:23495970 [DOI] [PMC free article] [PubMed] [Google Scholar]
- 27.Tak PP, Firestein GS. NF-kappaB: a key role in inflammatory diseases. J Clin Invest. 2001;107:7–11. https://doi.org/ 10.1172/JCI11830. PMID:11134171 [DOI] [PMC free article] [PubMed] [Google Scholar]
- 28.Mair W, Morantte I, Rodrigues AP, Manning G, Montminy M, Shaw RJ, Dillin A. Lifespan extension induced by AMPK and calcineurin is mediated by CRTC-1 and CREB. Nature. 2011;470:404–8. https://doi.org/ 10.1038/nature09706. PMID:21331044 [DOI] [PMC free article] [PubMed] [Google Scholar]
- 29.Khaminets A, Heinrich T, Mari M, Grumati P, Huebner AK, Akutsu M, Liebmann L, Stolz A, Nietzsche S, Koch N, et al.. Regulation of endoplasmic reticulum turnover by selective autophagy. Nature. 2015;522:354–8. https://doi.org/ 10.1038/nature14498. PMID:26040720 [DOI] [PubMed] [Google Scholar]
- 30.Mochida K, Oikawa Y, Kimura Y, Kirisako H, Hirano H, Ohsumi Y, Nakatogawa H. Receptor-mediated selective autophagy degrades the endoplasmic reticulum and the nucleus. Nature. 2015;522:359–62. https://doi.org/ 10.1038/nature14506. PMID:26040717 [DOI] [PubMed] [Google Scholar]
- 31.Wang M, Kaufman RJ. The impact of the endoplasmic reticulum protein-folding environment on cancer development. Nat Rev Cancer. 2014;14:581–97. https://doi.org/ 10.1038/nrc3800. PMID:25145482 [DOI] [PubMed] [Google Scholar]
- 32.Elmets CA, Viner JL, Pentland AP, Cantrell W, Lin HY, Bailey H, Kang S, Linden KG, Heffernan M, Duvic M, et al.. Chemoprevention of nonmelanoma skin cancer with celecoxib: a randomized, double-blind, placebo-controlled trial. J Natl Cancer Inst. 2010;102:1835–44. https://doi.org/ 10.1093/jnci/djq442. PMID:21115882 [DOI] [PMC free article] [PubMed] [Google Scholar]
- 33.Liang XH, Jackson S, Seaman M, Brown K, Kempkes B, Hibshoosh H, Levine B. Induction of autophagy and inhibition of tumorigenesis by beclin 1. Nature 1999; 402:672–76. https://doi.org/ 10.1038/45257. PMID:10604474 [DOI] [PubMed] [Google Scholar]
- 34.Qu X, Yu J, Bhagat G, Furuya N, Hibshoosh H, Troxel A, Rosen J, Eskelinen EL, Mizushima N, Ohsumi Y, et al.. Promotion of tumorigenesis by heterozygous disruption of the beclin 1 autophagy gene. J Clin Invest. 2003;112:1809–20. https://doi.org/ 10.1172/JCI20039. PMID:14638851 [DOI] [PMC free article] [PubMed] [Google Scholar]
- 35.Elgendy M, Ciro M, Abdel-Aziz AK, Belmonte G, Dal Zuffo R, Mercurio C, Miracco C, Lanfrancone L, Foiani M, Minucci S. Beclin 1 restrains tumorigenesis through Mcl-1 destabilization in an autophagy-independent reciprocal manner. Nat Commun. 2014;5:5637. https://doi.org/ 10.1038/ncomms6637. PMID:25472497 [DOI] [PubMed] [Google Scholar]
- 36.Elgendy M, Minucci S. A novel autophagy-independent, oncosuppressive function of BECN1: Degradation of MCL1. Autophagy. 2015;11:581–82. https://doi.org/ 10.1080/15548627.2015.1029836. PMID:25837021 [DOI] [PMC free article] [PubMed] [Google Scholar]
- 37.Levy J, Cacheux W, Bara MA, L'Hermitte A, Lepage P, Fraudeau M, Trentesaux C, Lemarchand J, Durand A, Crain AM, et al.. Intestinal inhibition of Atg7 prevents tumour initiation through a microbiome-influenced immune response and suppresses tumour growth. Nat Cell Biol. 2015;17:1062–73. https://doi.org/ 10.1038/ncb3206. PMID:26214133 [DOI] [PubMed] [Google Scholar]
- 38.Xie X, Koh JY, Price S, White E, Mehnert JM. Atg7 Overcomes Senescence and Promotes Growth of BrafV600E-Driven Melanoma. Cancer Discov. 2015;5:410–23. https://doi.org/ 10.1158/2159-8290.CD-14-1473. PMID:25673642 [DOI] [PMC free article] [PubMed] [Google Scholar]
- 39.Santanam U, Banach-Petrosky W, Abate-Shen C, Shen MM, White E, DiPaola RS. Atg7 cooperates with Pten loss to drive prostate cancer tumor growth. Genes Dev. 2016;30:399–407. https://doi.org/ 10.1101/gad.274134.115. PMID:26883359 [DOI] [PMC free article] [PubMed] [Google Scholar]
- 40.Guo JY, Karsli-Uzunbas G, Mathew R, Aisner SC, Kamphorst JJ, Strohecker AM, Chen G, Price S, Lu W, Teng X, et al.. Autophagy suppresses progression of K-ras-induced lung tumors to oncocytomas and maintains lipid homeostasis. Genes Dev. 2013;27:1447–61. https://doi.org/ 10.1101/gad.219642.113. PMID:23824538 [DOI] [PMC free article] [PubMed] [Google Scholar]
- 41.Rao S, Tortola L, Perlot T, Wirnsberger G, Novatchkova M, Nitsch R, Sykacek P, Frank L, Schramek D, Komnenovic V, et al.. A dual role for autophagy in a murine model of lung cancer. Nat Commun. 2014;5:3056. https://doi.org/ 10.1038/ncomms4056. PMID:24445999 [DOI] [PubMed] [Google Scholar]
- 42.Strohecker AM, Guo JY, Karsli-Uzunbas G, Price SM, Chen GJ, Mathew R, McMahon M, White E. Autophagy sustains mitochondrial glutamine metabolism and growth of BrafV600E-driven lung tumors. Cancer Discov. 2013;3:1272–85. https://doi.org/ 10.1158/2159-8290.CD-13-0397. PMID:23965987 [DOI] [PMC free article] [PubMed] [Google Scholar]
- 43.Rosenfeldt MT, O'Prey J, Morton JP, Nixon C, MacKay G, Mrowinska A, Au A, Rai TS, Zheng L, Ridgway R, et al.. p53 status determines the role of autophagy in pancreatic tumour development. Nature. 2013;504:296–300. https://doi.org/ 10.1038/nature12865. PMID:24305049 [DOI] [PubMed] [Google Scholar]
- 44.Yang A, Rajeshkumar NV, Wang X, Yabuuchi S, Alexander BM, Chu GC, Von Hoff DD, Maitra A, Kimmelman AC. Autophagy is critical for pancreatic tumor growth and progression in tumors with p53 alterations. Cancer Discov. 2014;4:905–13. https://doi.org/ 10.1158/2159-8290.CD-14-0362. PMID:24875860 [DOI] [PMC free article] [PubMed] [Google Scholar]
- 45.Mathew R, Karp CM, Beaudoin B, Vuong N, Chen G, Chen HY, Bray K, Reddy A, Bhanot G, Gelinas C, et al.. Autophagy suppresses tumorigenesis through elimination of p62. Cell. 2009;137:1062–75. https://doi.org/ 10.1016/j.cell.2009.03.048. PMID:19524509 [DOI] [PMC free article] [PubMed] [Google Scholar]
- 46.Inami Y, Waguri S, Sakamoto A, Kouno T, Nakada K, Hino O, Watanabe S, Ando J, Iwadate M, Yamamoto M, et al.. Persistent activation of Nrf2 through p62 in hepatocellular carcinoma cells. J Cell Biol. 2011;193:275–84. https://doi.org/ 10.1083/jcb.201102031. PMID:21482715 [DOI] [PMC free article] [PubMed] [Google Scholar]
- 47.Voronov E, Dotan S, Krelin Y, Song X, Elkabets M, Carmi Y, Rider P, Idan C, Romzova M, Kaplanov I, et al.. Unique Versus Redundant Functions of IL-1alpha and IL-1beta in the Tumor Microenvironment. Front Immunol. 2013;4:177. https://doi.org/ 10.3389/fimmu.2013.00177. PMID:23847618 [DOI] [PMC free article] [PubMed] [Google Scholar]
- 48.Soontrapa K, Honda T, Sakata D, Yao C, Hirata T, Hori S, Matsuoka T, Kita Y, Shimizu T, Kabashima K, et al.. Prostaglandin E2-prostaglandin E receptor subtype 4 (EP4) signaling mediates UV irradiation-induced systemic immunosuppression. Proc Natl Acad Sci U S A. 2011;108:6668–73. https://doi.org/ 10.1073/pnas.1018625108. PMID:21460251 [DOI] [PMC free article] [PubMed] [Google Scholar]
- 49.Muller-Decker K, Neufang G, Berger I, Neumann M, Marks F, Furstenberger G. Transgenic cyclooxygenase-2 overexpression sensitizes mouse skin for carcinogenesis. Proc Natl Acad Sci U S A. 2002;99:12483–88. https://doi.org/ 10.1073/pnas.192323799. PMID:12221288 [DOI] [PMC free article] [PubMed] [Google Scholar]
- 50.Shi CS, Shenderov K, Huang NN, Kabat J, Abu-Asab M, Fitzgerald KA, Sher A, Kehrl JH. Activation of autophagy by inflammatory signals limits IL-1beta production by targeting ubiquitinated inflammasomes for destruction. Nat Immunol. 2012;13:255–63. https://doi.org/ 10.1038/ni.2215. PMID:22286270 [DOI] [PMC free article] [PubMed] [Google Scholar]
- 51.Kang C, Xu Q, Martin TD, Li MZ, Demaria M, Aron L, Lu T, Yankner BA, Campisi J, Elledge SJ. The DNA damage response induces inflammation and senescence by inhibiting autophagy of GATA4. Science. 2015;349:aaa5612. https://doi.org/ 10.1126/science.aaa5612. PMID:26404840 [DOI] [PMC free article] [PubMed] [Google Scholar]
- 52.Lee HM, Shin DM, Yuk JM, Shi G, Choi DK, Lee SH, Huang SM, Kim JM, Kim CD, Lee JH, et al.. Autophagy negatively regulates keratinocyte inflammatory responses via scaffolding protein p62/SQSTM1. J Immunol. 2011;186:1248–58. https://doi.org/ 10.4049/jimmunol.1001954. PMID:21160040 [DOI] [PubMed] [Google Scholar]
- 53.Kikuchi D, Tanimoto K, Nakayama K. CREB is activated by ER stress and modulates the unfolded protein response by regulating the expression of IRE1alpha and PERK. Biochem Biophys Res Commun. 2016;469:243–50. https://doi.org/ 10.1016/j.bbrc.2015.11.113. PMID:26642955 [DOI] [PubMed] [Google Scholar]
- 54.Kim S, Joe Y, Kim HJ, Kim YS, Jeong SO, Pae HO, Ryter SW, Surh YJ, Chung HT. Endoplasmic reticulum stress-induced IRE1alpha activation mediates cross-talk of GSK-3beta and XBP-1 to regulate inflammatory cytokine production. J Immunol. 2015;194:4498–506. https://doi.org/ 10.4049/jimmunol.1401399. PMID:25821218 [DOI] [PMC free article] [PubMed] [Google Scholar]
- 55.Qiang L, Zhao BZ, Ming M, Wang N, He TC, Hwang S, Thorburn A, He YY. Regulation of cell proliferation and migration by p62 through stabilization of Twist1. Proc Natl Acad Sci U S A. 2014;111:9241–6. https://doi.org/ 10.1073/pnas.1322913111. PMID:24927592 [DOI] [PMC free article] [PubMed] [Google Scholar] [Retracted]
- 56.Wu CL, Qiang L, Han W, Ming M, Viollet B, He YY. Role of AMPK in UVB-induced DNA damage repair and growth control. Oncogene. 2013;32:2682–89. https://doi.org/ 10.1038/onc.2012.279. PMID:22751115 [DOI] [PMC free article] [PubMed] [Google Scholar]
- 57.Ming M, Soltani K, Shea CR, Li X, He YY. Dual role of SIRT1 in UVB-induced skin tumorigenesis. Oncogene. 2015;34:357–63. https://doi.org/ 10.1038/onc.2013.583. PMID:24441046 [DOI] [PMC free article] [PubMed] [Google Scholar]
- 58.Li C, Lasse S, Lee P, Nakasaki M, Chen SW, Yamasaki K, Gallo RL, Jamora C. Development of atopic dermatitis-like skin disease from the chronic loss of epidermal caspase-8. Proc Natl Acad Sci U S A. 2010;107:22249–54. https://doi.org/ 10.1073/pnas.1009751108. PMID:21135236 [DOI] [PMC free article] [PubMed] [Google Scholar]
- 59.Ming M, Zhao B, Shea CR, Shah P, Qiang L, White SR, Sims DM, He YY. Loss of sirtuin 1 (SIRT1) disrupts skin barrier integrity and sensitizes mice to epicutaneous allergen challenge. J Allergy Clin Immunol. 2015;135:936–945 e934. https://doi.org/ 10.1016/j.jaci.2014.09.035 [DOI] [PMC free article] [PubMed] [Google Scholar]
- 60.Ming M, Han W, Zhao B, Sundaresan NR, Deng CX, Gupta MP, He YY. SIRT6 promotes COX-2 expression and acts as an oncogene in skin cancer. Cancer Res. 2014;74:5925–33. https://doi.org/ 10.1158/0008-5472.CAN-14-1308. PMID:25320180 [DOI] [PMC free article] [PubMed] [Google Scholar]
- 61.Arnold PB, Campbell CA, Rodeheaver G, Merritt W, Morgan RF, Drake DB. Modification of blood vessel diameter following perivascular application of botulinum toxin-A. Hand (N Y). 2009;4:302–7. https://doi.org/ 10.1007/s11552-009-9169-8. PMID:19194764 [DOI] [PMC free article] [PubMed] [Google Scholar]
- 62.Ming M, Shea CR, Guo X, Li X, Soltani K, Han W, He YY. Regulation of global genome nucleotide excision repair by SIRT1 through xeroderma pigmentosum C. Proc Natl Acad Sci U S A. 2010;107:22623–28. https://doi.org/ 10.1073/pnas.1010377108. PMID:21149730 [DOI] [PMC free article] [PubMed] [Google Scholar]
- 63.Han W, Ming M, Zhao R, Pi J, Wu C, He YY. Nrf1 CNC-bZIP protein promotes cell survival and nucleotide excision repair through maintaining glutathione homeostasis. J Biol Chem. 2012;287:18788–95. https://doi.org/ 10.1074/jbc.M112.363614. PMID:22500024 [DOI] [PMC free article] [PubMed] [Google Scholar]
- 64.Han W, Ming M, He TC, He YY. Immunosuppressive cyclosporin A activates AKT in keratinocytes through PTEN suppression: implications in skin carcinogenesis. J Biol Chem. 2010;285:11369–77. https://doi.org/ 10.1074/jbc.M109.028142. PMID:20154081 [DOI] [PMC free article] [PubMed] [Google Scholar]
- 65.Qiang L, Shah P, Barcellos-Hoff MH, He YY. TGF-beta signaling links E-cadherin loss to suppression of nucleotide excision repair. Oncogene. 2016;35:3293–3302. https://doi.org/ 10.1038/onc.2015.390. PMID:26477308 [DOI] [PMC free article] [PubMed] [Google Scholar]