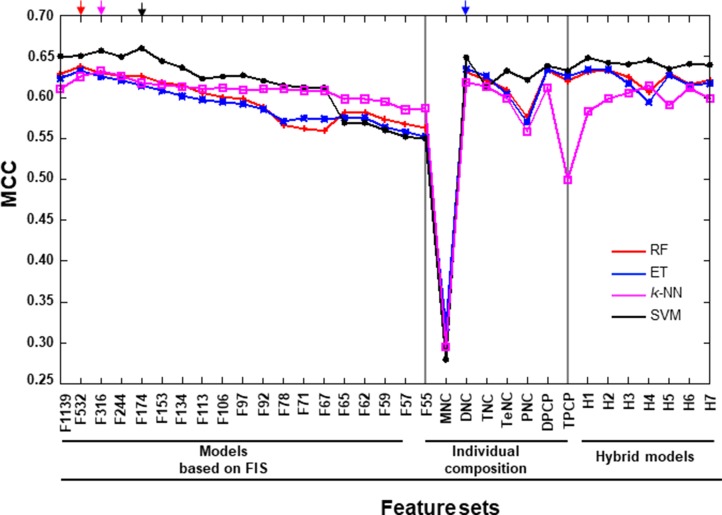
Figure 5. Performance of various prediction models on the benchmarking dataset.
X- and Y-axes represent various feature-based prediction models and their performances measured in terms of MCC, respectively. The final selected prediction model for each ML-based method is indicated by arrows in different colors. Each point represents the average of five independent 10-fold cross-validations. The first 19 features are FX, where X is the number of features based on the FIS cut-off. H1: MNC+DNC; H2: H1+TNC; H3: H1+TeNC; H4: H3+PNC+DPCP; H5: DPCP+TPCP; H6: H1+TeNC+PNC+TPCP; and H7: H1+TNC+TeNC+PNC+H5.

