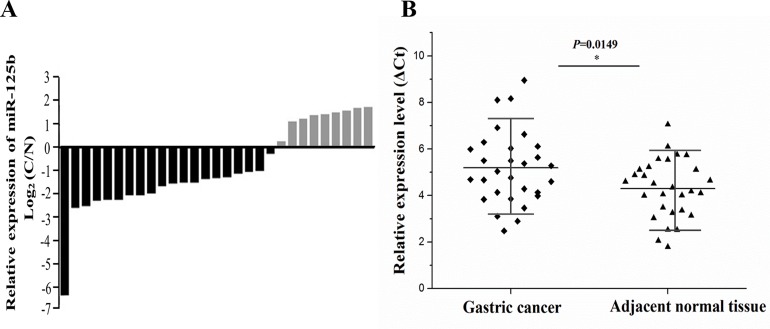
Figure 2. The expression of miR-125b was measured in 29 cases of gastric cancer and adjacent normal tissues.
(A) The miR-125b expression level was assessed in a panel paired specimen using RT-qPCR. (B) The statistical analysis of miR-125b relative expression level in tumor tissues and adjacent tissues using T-test. Horizontal line stands for the average value for each group. The ordinate represents ΔCt values of miR-125b expression. In general, higher ΔCt value stands for lower expression of miRNA. RT-qPCR, real-time quantitative polymerase chain reaction. Ct, cycle threshold; *, P < 0.05.

