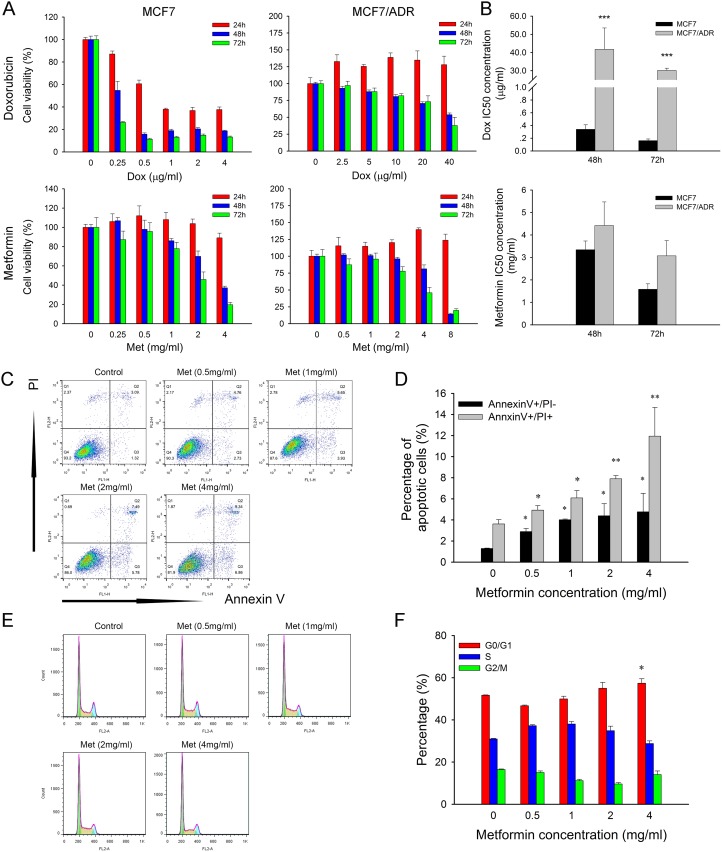
Figure 1. Cytotoxicity of metformin and doxorubicin.
(A) Effect of metformin and doxorubicin on cell proliferation of MCF7 and MCF7/ADR at 24, 48, 72 hours (n = 5). (B) IC50 concentration of doxorubicin and metformin. The data were obtained from three independent experiments. (C) Representative results of Annexin/PI staining after metformin treatment for 48 h in MCF7/ADR. (D) Statistical result showing the percentage of cells in early or late apoptosis (n = 3). (E) Representative results of cell cycle distribution after metformin treatment for 48 h in MCF7/ADR. (F) Statistical result showing the percentage of cells in G1, S or G2 phases (n = 3). Cells untreated were regarded as control (*P < 0.05, **P < 0.01, ***P < 0.001).

