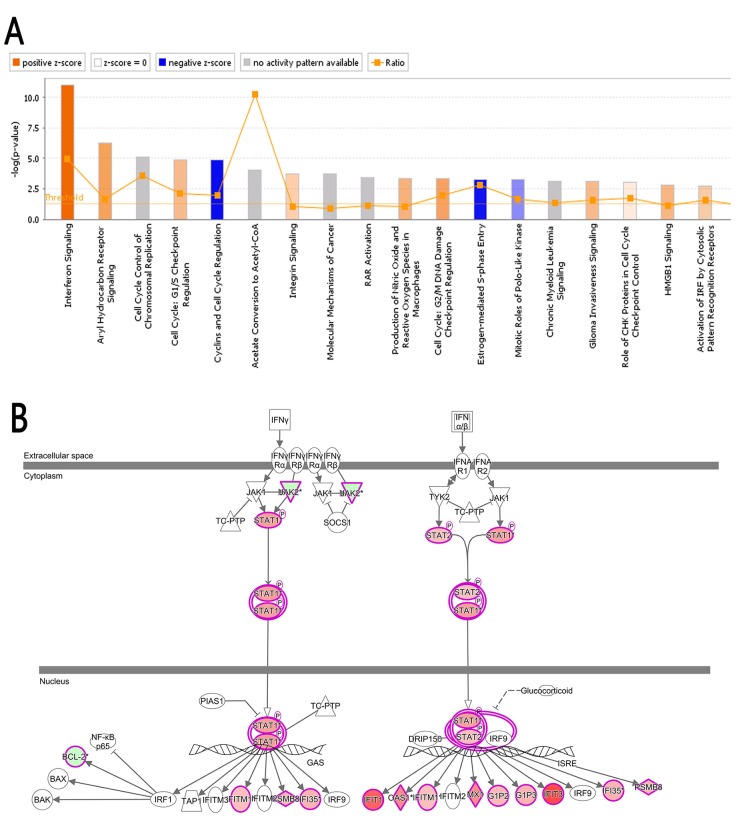
Figure 6. Classical pathway.
(A) The cluster status of the differentially expressed genes in classical signal transduction pathways. The classical signal transduction pathways regulated by the differentially expressed genes were summed up by 800 signal transduction and metabolism pathways gathered and summarized via IPA. All the signal pathways were ranked by using –log (P-value). (B) The interferon signal pathway; the canonical interferon signal pathway showed the signaling process of the associated molecule and differentially expressed genes. The highlighted molecules represent the differentially expressed genes, red in varying degrees corresponding to the different degree of up-regulation, green in varying degrees corresponding to the different degree of down-regulation.

