Abstract
Two NMR observables, NζH3+ peak in the HISQC spectrum and Nζ chemical shift difference between the free and heparin-bound forms, can identify binding-interface lysines in protein-heparin complexes. Unlike backbone chemical shifts, these direct probes are stringent and are less prone to either false positives or false negatives.
Graphical abstract
Identification of the lysine side chain NζH3+ peak in the HISQC spectrum and Nζ chemical shift difference between the free and heparin-bound forms are useful methods for identifying binding-interface lysines in protein-heparin complexes.
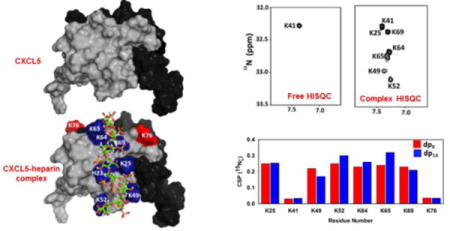
Glycosaminoglycans (GAGs), such as heparan sulfate and heparin, are highly sulfated linear polysaccharides, that bind diverse classes of proteins, including chemokines, growth factors and proteases, and are intimately involved in human pathophysiology from combating infection and propagating cancer to brain development and cognition1, 2. Though it is well established that ion pair interactions between protein lysines (Lys) and GAG sulfates and carboxylates mediate binding, unambiguous experimental evidence of which lysines and how they contribute to the binding interactions has been hard to come by. Determination of solution or crystal structures of protein-GAG complexes faces many experimental challenges, including precipitation of complexes at high concentrations used for structural studies, due to protein monomer-dimer equilibrium, and flexible nature of GAGs, lack of crystals, and poor quality NMR spectra.
NMR backbone chemical shifts as a spectroscopic probe has been quite useful and has been widely used for identifying GAG-binding residues3–6. This method though fairly straightforward, does have limitations, as backbone chemical shift changes are correlative and assigning whether a residue is involved in binding is often empirical. Previous studies have shown that lack of chemical shift change does not mean a particular lysine is not involved in binding and significant chemical shift change does not mean a particular lysine is involved in binding4, 5, 7, 8. The extent of chemical shift change is dependent on several factors including whether a given lysine is in a structured or unstructured region, proximity and nature of other residues, packing constraints, dynamical features, and that the backbone amide group is separated from the NζH3+ group by as many as six covalent bonds. Any change in backbone chemical shifts is a composite of both direct binding and indirect interactions such as due to binding-induced local and global structural changes9. Indirect structural changes can result in false positives, and cancellation of direct and indirect interactions can result in false negatives. Limitations of backbone chemical shifts generally come to light in mutational studies, when a particular lysine is identified as a binding or a non-binding residue whereas backbone chemical shift data had indicated otherwise. Therefore, methods that directly probe the binding interactions by detecting and characterizing the properties of NζH3+ are necessary10, 11 for identifying binding-interface lysines in protein-GAG interaction complexes.
Here we show that 1H detection of the NζH3+ group and chemical shift change in15Nζ can identify interface lysines in heparin-protein complexes. We characterized the binding of two related chemokines, CXCL1 and CXCL5, to heparin octasaccharide (dp8) and a 14mer (dp14). Humans express ~ 50 chemokines, which play a crucial role in directing immune and non-immune cells in health and disease. It is now well established that their function is intimately coupled to binding to GAGs12. A set of seven chemokines, including CXCL1 and CXCL5, characterized by the N-terminal ‘ELR’ motif, function as agonists for the CXCR2 receptor13(Fig. 1). These chemokines orchestrate neutrophil recruitment in response to bacterial and viral infections and injury. Previous studies have characterized heparin binding to both CXCL1 and CXCL5 from NMR backbone chemical shift changes, molecular dynamics, and mutational studies (Fig. 2)5, 6, 14. We show, unlike backbone chemical shifts, direct detection methods are more reliable in identifying binding-interface lysines, and further, are less prone to either false positives or false negatives.
Fig. 1.

Sequences of neutrophil activating chemokines. Amino acid sequence number for CXCL1 and CXCL5 are shown above and below the sequences, respectively. Basic residues implicated in CXCL1 and CXCL5 binding that are conserved in other members are shown in red. Residues that are unique to CXCL1 and CXCL5 are highlighted in blue.
Fig. 2.
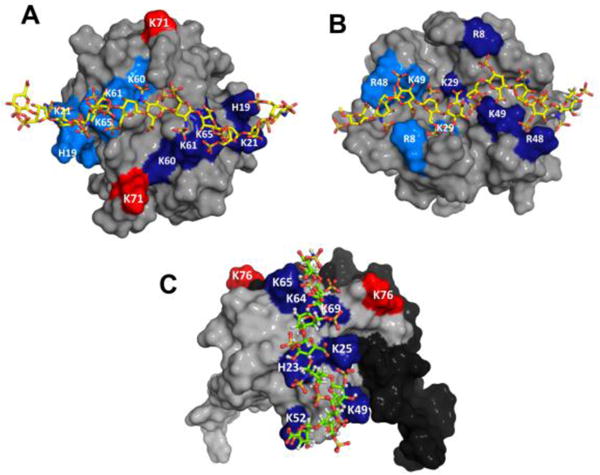
Models of heparin bound CXCL1 and CXCL5 complexes. Panels A and B shows the non-overlapping heparin-binding surfaces in CXCL1 (defined as α- and β-domains). Heparin-binding residues from both monomers are highlighted in light and dark blue and residue K71 from both monomers are labelled in red. Panel C show the heparin-binding surface in CXCL5. Heparin binding residues were highlighted in blue and residue K76 is shown in red. The second monomer of the dimer is shown in black for clarity.
For both proteins15, 16, sequences and structures reveal eight lysines that are well distributed on the protein surface (Fig. 3A and 1). We used HISQC experiment that measures the correlation between the15Nζ and its attached 1H nuclei for detecting NζH3+ groups in the heparin-bound complexes. HISQC spectra of the free chemokine and in the heparin-bound forms failed to show any signals from NζH3+ groups under physiological conditions (pH 7.2 and 37 °C), indicating rapid H-exchange with the bulk water. On reducing the pH to 5.8 and temperature to 10 °C, we observe one peak for the free protein (K21 in CXCL1 and K41 in CXCL5) but at least seven peaks in the heparin-bound complexes (Fig. 3). The observation of additional peaks can be directly attributed to significantly slower H-exchange with bulk water due to ion pair interactions with heparin acidic groups. H2CN spectrum provides correlation between non-exchangeable 1Hε and15Nζ resonances17. We used H2CN spectra to assign the chemical shifts of15Nζ in the free and heparin-bound forms. For assigning the Nζ chemical shifts in the HISQC spectra at 10 °C, we initially assigned the 1H resonances in the (H2C)N(CC)H-TOCSY spectrum at 40 °C, and then collected a series of H2CN spectra from 40 to 10 °C that allowed transferring the Nζ shifts to the HISQC spectra (Fig. 4).18 The Hε assignments at 40 °C were confirmed using HC(CO)NH and HCCH-TOCSY spectra recorded at 40°C.
Fig. 3.
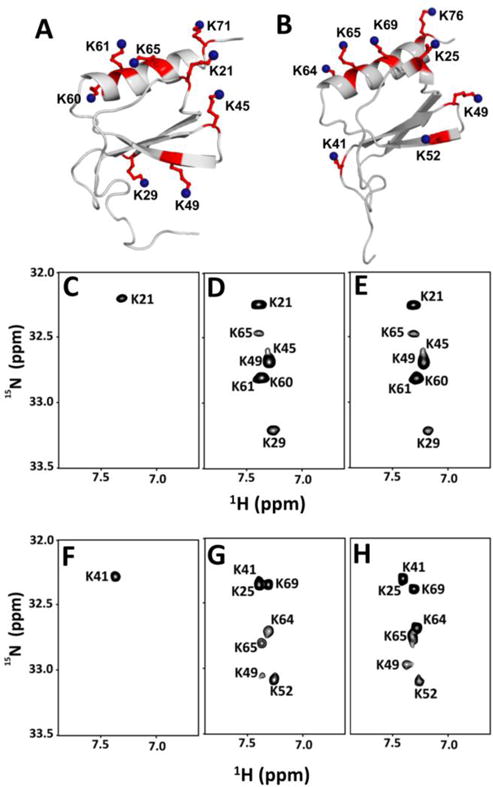
Structures of (A) CXCL1 and (B) CXCL5. Lysine residues are highlighted and labeled. HISQC spectra of CXCL1 and CXCL5 in the free (C and F), dp8-bound (D and G), dp14-bound (E and H) forms at pH 5.7 and 10 °C.
Fig. 4.
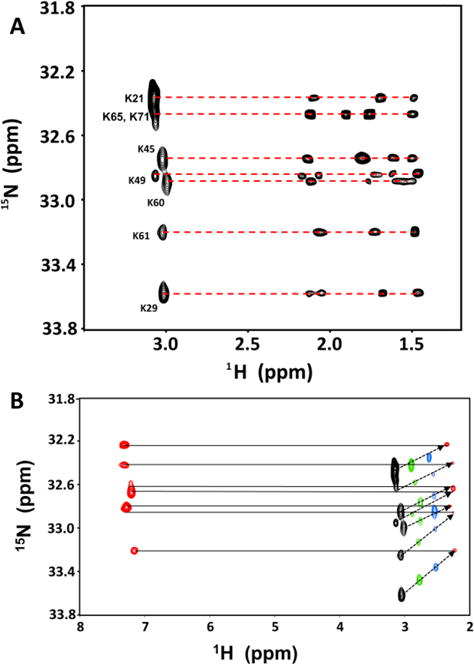
(A) 2D (H2C)N(CCH)-TOCSY spectrum of the CXCL1-dp8 complex showing the cross peaks for the lysine side chain protons. (B) Superimposition of the HISQC spectrum at 10 °C (in red) and H2CN spectra at 10 °C (red), 20 °C (blue), 30 °C (green), and 40 °C (black) of the CXCL1-dp8 complex. H2CN spectra show correlation between Nζ and Hε at different temperatures, allowing assigning the Nζ chemical shifts in the HISQC spectrum at 10°C.
CXCL1-heparin interactions
In dp8 and dp14-bound forms, HISQC spectra showed cross peaks for seven lysine residues — K21, K29, K45, K49, K60, K61 and K65 (Fig. 3). Significant increase in15Nζ chemical shifts upon complex formation is indicative of H-bonding between lysines and GAG acidic groups (Fig. 5, Table-I). Absence of a peak for K71 in the HISQC spectrum suggests that it is not involved in binding though it is in the proximity of other lysines. The peak corresponding to K71 in the H2CN spectrum was confirmed using the K71A mutant, and this peak also shows minimal chemical shift change on heparin binding. A peak for K21 in the free HISQC spectrum indicates that it is involved in intramolecular ionic interactions, and the extent of Nζ chemical shift change in the bound form is also lower compared to other lysines, suggesting that it is involved in both intramolecular and intermolecular interactions in the bound form. It is very likely that the role of intramolecular interaction of K21 in CXCL1 is unrelated to GAG binding, considering this lysine is highly conserved in all seven CXCR2-activating chemokines, is not involved in intramolecular interaction in CXCL5, and mutating this lysine in CXCL1 and CXCL8 results in reduced GAG binding and reduced in vivo function19. The stringency of probing NζH3+ side chain interactions is also quite evident if we consider K29, as this lysine did not show backbone chemical shift perturbation for both heparin oligosaccharides (Table-I). Independent validation also comes from mutational and modeling studies that have shown K29 is involved in GAG interactions. The overall quality of the spectra for dp8 and dp14 bound CXCL1 complexes are quite similar, and the extent of Nζ chemical shift change of all lysines for both oligosaccharides are also quite similar (Fig. 5, Table-I). These observations collectively indicate that the dimensions of an octasaccharide are sufficient to capture all of the binding interface lysine residues.
Fig. 5.
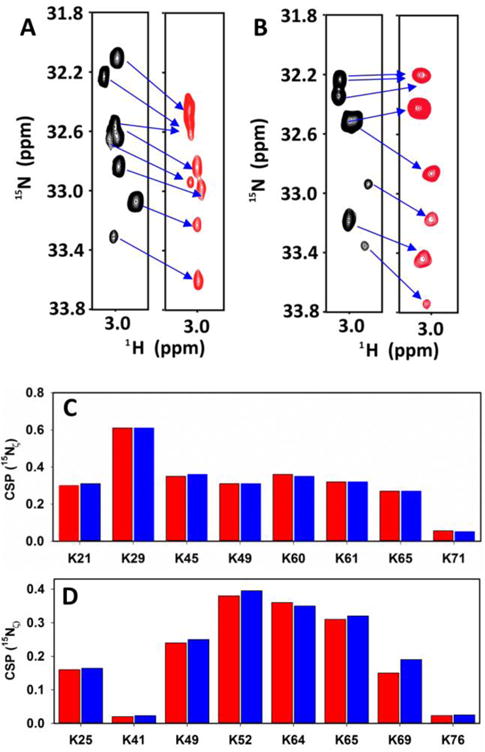
H2CN spectra of CXCL1 (A) and CXCL5 (B) in the free (black) and heparin dp8-bound (red) forms. The spectra were acquired in 50 mM sodium phosphate pH 5.7 at 40 °C. Summary of heparin binding-induced chemical shift changes of15Nζ from the lysine NH3+ group in CXCL1 (C) and CXCL5 (D). Data for dp8 and dp14 are shown in red and blue, respectively.
Table1.
Summary of CXCL1 and CXCL5 lysine interactions with heparin.
| CXCL1 | K21 | K29 | K45 | K49 | K60 | K61 | K65 | K71 |
|---|---|---|---|---|---|---|---|---|
| dp14 | ||||||||
| HISQC | Y | Y | Y | Y | Y | Y | Y | N |
| H2CN | Y | Y | Y | Y | Y | Y | Y | N |
| HSQC | Y | N | Y | Y | Y | Y | Y | N |
| dp8 | ||||||||
| HISQC | Y | Y | Y | Y | Y | Y | Y | N |
| H2CN | Y | Y | Y | Y | Y | Y | Y | N |
| HSQC | Y | N | Y | Y | Y | Y | Y | N |
|
| ||||||||
| CXCL5 | K25 | K41 | K49 | K52 | K64 | K65 | K69 | K76 |
|
| ||||||||
| dp14 | ||||||||
| HISQC | Y | Y | Y | Y | Y | Y | Y | N |
| H2CN | Y | N | Y | Y | Y | Y | Y | N |
| HSQC | Y | N | Y | Y | Y | Y | Y | Y |
| dp8 | ||||||||
| HISQC | Y | Y | Y | Y | Y | Y | Y | N |
| H2CN | Y | N | Y | Y | Y | Y | Y | N |
| HSQC | Y | N | Y | Y | Y | Y | Y | Y |
HISQC (“Y” and “N” correspond to the presence or absence of a peak)
H2CN (“Y” and “N” correspond to presence or absence of a chemical shift perturbation)
HSQC (“Y” and “N” correspond to presence or absence of chemical shift perturbation)
CXCL5-heparin interactions
For both oligosaccharides, HISQC spectra showed cross peaks for seven lysine residues in the bound form — K25, K41, K49, K52, K64, K65 and K69 (Fig. 3). Absence of a peak for K76 indicates that it is not involved in binding though it is in the proximity of other lysines. Of the lysines observed in the HISQC spectrum, all except K41 show significant chemical shift difference for Nζ between the free and bound forms. Considering K41 was observed in the free HISQC spectrum, we conclude that it is not involved in direct binding but in intramolecular interactions that render slower hydrogen exchange between this side chain and water. This is also validated from the observations that K41 showed no backbone CSP, and was not identified as a binding residue in the structural models. This residue is not conserved, and most CXCR2-activating chemokines have a polar residue at this location indicating that any role for this lysine is unrelated to GAG function. We observe that the intensities of the HISQC peaks are not uniform, and that K49 and K52 are weaker, suggesting these residues are more solvent exposed. These observations are consistent with the MD simulation studies that identified K25, K64, K65, and K69 as involved in contact ion pair and K49 and K52 as involved in solvent-separated ion-pair interactions5. K76 showed significant backbone CSP, but was not detected in the HISQC spectrum. The identity of K76 in the H2CN spectrum was confirmed using the K76A mutant, and Nζ chemical shift was observed to be essentially the same between the free and bound forms, indicating that the backbone chemical shift change must be due to indirect interactions such as structuring of the helix.
In conclusion, we show that two NMR properties, observing the NζH3+ peak in the HISQC spectrum and binding-induced Nζ chemical shift change, can serve as useful probes for identifying binding-interface lysines in protein-heparin complexes. We further show direct detection and characterization of side chain interactions, unlike backbone chemical shift changes, are less likely to suffer from false positives or false negatives, and also minimize the need for mutational and functional studies.
Acknowledgments
This work was supported by the National Institutes of Health grants P01 HL107152 and R21 AI124681. We thank Tianzi Wang for assistance with the NMR experiments.
Footnotes
Footnotes relating to the title and/or authors should appear here.
Notes
Expression and purification of 13C and15N labeled CXCL1 and CXCL5 were carried out as described previously16, 20. Heparin (dp8 and dp14) oligosaccharides were purchased from Iduron (U.K). According to the manufacturer, the oligosaccharides were purified using high-resolution gel filtration chromatography. The major disaccharide units in heparin is IdoA, 2S-GlcNS,6S (~75%). Titrations of heparin oligosaccharides to ~ 200 μM15N-CXCL1 and15N-CXCL5 in 50 mM sodium phosphate pH 5.7 were carried out using Bruker Avance III 600 and 800 MHz spectrometers equipped with QCI and TCI cryoprobes, respectively. The final protein: ligand molar ratio was 1:4. The HISQC, H2CN, and (H2C)N(CCH)-TOCSY, spectra in the free and bound forms were acquired using a Shigemi coaxial NMR tube with the capillary filled with D2O to avoid partial deuteration of NH3+ groups. All NMR experiments were performed in 50 mM sodium phosphate pH 5.7.
References
- 1.Meneghetti MC, Hughes AJ, Rudd TR, Nader HB, Powell AK, Yates EA, Lima MA. J R Soc Interface. 2015;12:0589. doi: 10.1098/rsif.2015.0589. [DOI] [PMC free article] [PubMed] [Google Scholar]
- 2.Xu D, Esko JD. Annu Rev Biochem. 2014;83:129–157. doi: 10.1146/annurev-biochem-060713-035314. [DOI] [PMC free article] [PubMed] [Google Scholar]
- 3.Joseph PR, Poluri KM, Sepuru KM, Rajarathnam K. Methods Mol Biol. 2015;1229:325–333. doi: 10.1007/978-1-4939-1714-3_26. [DOI] [PMC free article] [PubMed] [Google Scholar]
- 4.Joseph PR, Mosier PD, Desai UR, Rajarathnam K. Biochem J. 2015;472:121–133. doi: 10.1042/BJ20150059. [DOI] [PMC free article] [PubMed] [Google Scholar]
- 5.Sepuru KM, Nagarajan B, Desai UR, Rajarathnam K. J Biol Chem. 2016;291:20539–20550. doi: 10.1074/jbc.M116.745265. [DOI] [PMC free article] [PubMed] [Google Scholar]
- 6.Sepuru KM, Rajarathnam K. J Biol Chem. 2016;291:4247–4255. doi: 10.1074/jbc.M115.697888. [DOI] [PMC free article] [PubMed] [Google Scholar]
- 7.Blaum BS, Deakin JA, Johansson CM, Herbert AP, Barlow PN, Lyon M, Uhrin D. J Am Chem Soc. 2010;132:6374–6381. doi: 10.1021/ja1000517. [DOI] [PubMed] [Google Scholar]
- 8.Chiu LY, Hung KW, Tjong SC, Chiang YW, Sue SC. Biochim Biophys Acta. 2014;1844:1851–1859. doi: 10.1016/j.bbapap.2014.08.002. [DOI] [PubMed] [Google Scholar]
- 9.Williamson MP. Prog Nucl Magn Reson Spectrosc. 2013;73:1–16. doi: 10.1016/j.pnmrs.2013.02.001. [DOI] [PubMed] [Google Scholar]
- 10.Zandarashvili L, Esadze A, Iwahara J. Adv Protein Chem Struct Biol. 2013;93:37–80. doi: 10.1016/B978-0-12-416596-0.00002-6. [DOI] [PubMed] [Google Scholar]
- 11.Poon DK, Schubert M, Au J, Okon M, Withers SG, McIntosh LP. J Am Chem Soc. 2006;128:15388–15389. doi: 10.1021/ja065766z. [DOI] [PubMed] [Google Scholar]
- 12.Monneau Y, Arenzana-Seisdedos F, Lortat-Jacob H. J Leukoc Biol. 2016;99:935–953. doi: 10.1189/jlb.3MR0915-440R. [DOI] [PubMed] [Google Scholar]
- 13.Stadtmann A, Zarbock A. Front Immunol. 2012;3:263. doi: 10.3389/fimmu.2012.00263. [DOI] [PMC free article] [PubMed] [Google Scholar]
- 14.Sawant KV, Poluri KM, Dutta AK, Sepuru KM, Troshkina A, Garofalo RP, Rajarathnam K. Sci Rep. 2016;6:33123. doi: 10.1038/srep33123. [DOI] [PMC free article] [PubMed] [Google Scholar]
- 15.Fairbrother WJ, Reilly D, Colby TJ, Hesselgesser J, Horuk R. J Mol Biol. 1994;242:252–270. doi: 10.1006/jmbi.1994.1577. [DOI] [PubMed] [Google Scholar]
- 16.Sepuru KM, Poluri KM, Rajarathnam K. PLoS One. 2014;9:e93228. doi: 10.1371/journal.pone.0093228. [DOI] [PMC free article] [PubMed] [Google Scholar]
- 17.Andre I, Linse S, Mulder FA. J Am Chem Soc. 2007;129:15805–15813. doi: 10.1021/ja0721824. [DOI] [PubMed] [Google Scholar]
- 18.Esadze A, Zandarashvili L, Iwahara J. J Biomol NMR. 2014;60:23–27. doi: 10.1007/s10858-014-9854-y. [DOI] [PMC free article] [PubMed] [Google Scholar]
- 19.Gangavarapu P, Rajagopalan L, Kolli D, Guerrero-Plata A, Garofalo RP, Rajarathnam K. J Leukoc Biol. 2012;91:259–265. doi: 10.1189/jlb.0511239. [DOI] [PMC free article] [PubMed] [Google Scholar]
- 20.Fernando H, Nagle GT, Rajarathnam K. FEBS J. 2007;274:241–251. doi: 10.1111/j.1742-4658.2006.05579.x. [DOI] [PMC free article] [PubMed] [Google Scholar]


