Abstract
[Purpose] The efficacy of a stabilometer-based index of postural stability (IPS) as an indicator of dynamic balance ability was investigated. [Subjects and Methods] Using a stabilometer, we calculated the IPS in 583 healthy subjects (178 males, 405 females) under two conditions (open eyes/hard surface, OE/HS; closed eyes/soft surface, CE/SS). [Results] Results revealed a negative relation between IPS and age. IPS (OE/HS) began to decrease at middle-age (40–60 years old), and then decreased more rapidly during elderly ages (>60 years old). On the other hand, IPS (CE/SS) decreased linearly with increasing age. There was no gender difference between the two IPSs. [Conclusion] These results suggest that IPS can evaluate balance ability quantitatively and without a ceiling effect. It was concluded that IPS (OE/HS) indicates comprehensive balance ability, while IPS (CE/SS) reveals balance ability without compensation by visual acuity and plantar superficial sense.
Keywords: Index of postural stability (IPS), Dynamic balance ability, Stabilometer
INTRODUCTION
Approximately 32% of elderly people fall at least once over the period of one year, and, of those who fell, 24% suffer serious injury1). These fall-related injuries among the elderly often result in the patients being bedridden and are a major public-health concern2). In addition, fall-related injuries are associated with substantial economic costs for individuals, society, and the healthcare system3).
Numerous studies have investigated the most likely cause or causes of falls, with varying results4,5,6,7,8). Risk factors for falls have been classified as intrinsic (those related to the individual) and extrinsic (those associated with environmental features). Among the intrinsic factors, studies have identified balance impairment as a strong predictor for falls4,5,6,7,8).
In attempting to prevent falls, valid and reliable clinical assessment methods that identify relative risk for falls are necessary to identify individuals for referral into fall-prevention programs. The methods can also be used to evaluate outcomes following intervention. Current methods are insufficient for this purpose. For example, the Berg Balance Scale (BBS)9) is a gold standard for balance assessment and can assess moderate to severe balance disability. Most healthy people at 70 years of age usually achieve the maximum score in BBS10). Thus, BBS cannot distinguish a milder balance disability than that of a 70 year old. This limitation is called a ceiling effect.
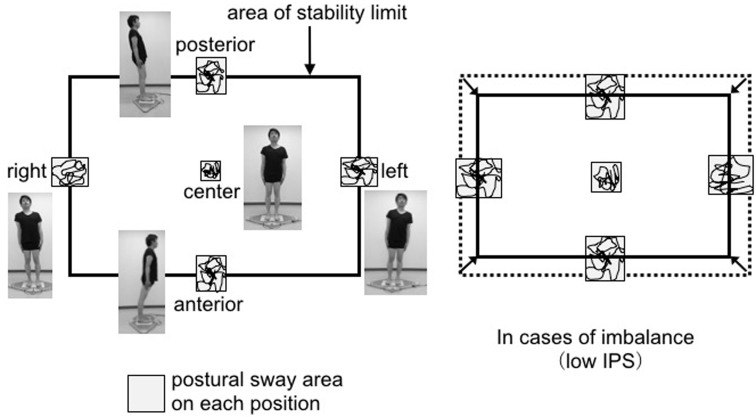
An improved method must assess mild to severe balance disability in all adults. We noted an index of postural stability (IPS) developed by Mochizuki et al11). Using a stabilometer, they measured body sway at 5 different positions and the area that examinees could maintain a stable standing position when they moved the center of gravity intentionally. Less body sway and a greater area is considered to be a better balance ability. Using IPS, they were able to distinguish mild balance disability in healthy people12). However, IPS was used only in a small number of patients with disability11) and in healthy subjects12).
In the present study, we used a stabilometer to determine IPS in a large number of healthy adults, and examined the results for age-specific reference values.
SUBJECTS AND METHODS
Healthy volunteers were recruited. Subjects with impaired balance ability due to any disorders or disabilities were excluded according to the following conditions: 1) spontaneous nystagmus, 2) visual impairment or limb movement disorders affecting daily living, 3) sensory disturbance, 4) inability to attain normal standing posture, 5) dizziness or vertigo, 6) a history of equilibrium sensory disorder, 7) experience of falling, and 8) a lack of independence in walking and daily living.
The purpose of the research and risk of the measurement were explained to each participant, and participants agreed independently. This study was approved by the University of Tsukuba Hospital ethics committee, was conducted according to the tenets of the Declaration of Helsinki, and informed consent was obtained from each participant (Protocol number: H26-29).
We used a Gravicorder GP-6000 (Anima Corp., Tokyo) with foam rubber (AIREX Instruments, Switzerland) to monitor lower limb load balance. For posturography, we used vertical force transducers to determine instantaneous fluctuations in the center of pressure (COP) at a sampling frequency of 20 Hz. A statokinesigram (the sway path of the COP) was obtained from these vertical forces as changes in electrical signals. The foam rubber material was made of polyvinyl chloride, with a tensile strength of 260 kPa, an elongation stretch percentage at 20 kPa of 25%, a density of 5 kg/cm3, and a thickness of 6 cm.
Two-legged stance tasks were performed under two conditions: eyes open without the foam rubber (hard surface), and eyes closed with the foam rubber (soft surface). The two tests were performed on the same day. The total recording time was 50 seconds or until the subject required assistance to prevent falling.
IPS measurement: The measurement procedure of IPS was carried out according to Mochizuki et al11). From the measurement results, IPS was calculated as “log[(area of stability limit + area of postural sway)/area of postural sway]”. Area of stability limit was calculated as the “front and rear center movement distance between anterior and posterior positions × the distance between right and left positions”. Area of postural sway was calculated as “average measurement value in 10 seconds under anterior, posterior, right, left, and center positions” (Fig. 1). The area of postural sway was calculated as the mean sway area of the 5 positions12). IPS has no unit. The results of the open eye/hard surface IPS was defined as IPS (OE/HS). The results of the closed eye/soft surface IPS was defined as IPS (CE/SS). The ratio of IPS (IPS (CE/SS)/IPS (OE/HS)) was calculated. One IPS measurement took approximately 1 minute.
Fig. 1.
Measurement of IPS. The area of postural sway was calculated as the mean sway area of 5 positions. Total recording time for one IPS measurement was 50 seconds because postural sway was measured for ten seconds at each position. IPS=log [(area of stability limit + area of postural sway)/area of postural sway] IPS: index of postural stability.
Each IPS was classified by gender and generation. Each item was monitored for normal distribution using the Shapiro-Wilk test. For univariate analysis, continuous variables were compared using a paired t test if it was parametric data and using Mann-Whitney U test if it was nonparametric data. Normative IPS reference values were then calculated as mean ± standard deviation. In addition, for each subject, IPS was examined whether each item follows normal distribution by using the Shapiro-Wilk test. For continuous variables, Pearson’s correlation coefficient was selected for parametric data, Spearman’s rank correlation coefficient was selected for nonparametric data, and the relation with age was examined. Regression analysis was used for analysis. Quadratic equation (y=ax2 + bx + c) was calculated as nonlinear with the horizontal axis (x) as the age and the vertical axis (y) as the numerical value of each item of IPS. In addition, the determination coefficient was determined and the suitability was judged. A p-value less than 0.05 denoted the presence of a statistically significant difference. Statistical analyses were conducted using SPSS version 24.0 J (SPSS Japan Inc., Tokyo).
RESULTS
The physical characteristics and results of IPS for each subject are shown in Table 1 for all subjects and for each gender. A total of 583 subjects (178 men and 405 women) participated in the study.
Table 1. Baseline characteristics of the participants.
| Unit | Total | Men | Women | |
|---|---|---|---|---|
| N | 583 | 178 | 405 | |
| Age | years | 47.3 ± 19.8 (19–85) | 44.7 ± 21.3 (19–85) | 48.5 ± 19.0 (19–84) |
| Height | m | 1.60 ± 0.09 (1.40–1.82) | 1.69 ± 0.07 (1.53–1.82) | 1.56 ± 0.06 (1.40–1.73) |
| Body weight | kg | 57.1 ± 10.4 (40.0–114) | 64.1 ± 11.2 (47.9–114) | 53.0 ± 7.9 (40.0–87.9) |
| BMI | kg/m2 | 22.3 ± 3.2 (16.4–40.0) | 22.4 ± 3.4 (17.6–40.0) | 21.8 ± 3.1 (16.4–32.8) |
| IPS (OE/HS) | 1.87 ± 0.34 (0.22–2.59) | 1.88 ± 0.33 (0.22–2.38) | 1.87 ± 0.35 (0.41–2.59) | |
| IPS (CE/SS) | 0.51 ± 0.28 (0.01–1.32) | 0.53 ± 0.28 (0.04–1.14) | 0.50 ± 0.28 (0.01–1.32) | |
| IPS (CE/SS)/IPS (OE/HS) | 0.26 ± 0.12 (0.01–0.61) | 0.27 ± 0.13 (0.02–0.55) | 0.26 ± 0.12 (0.01–0.61) | |
Data are means ± standard deviation. The minimums and the maximums are shown within parentheses. BMI: body mass index; IPS: index of postural stability (Refer to “IPS measurement” in SUBJECTS AND METHODS); OE/HS: open-eye/hard-surface; CE/SS: closed-eye/soft-surface.
The mean ± standard deviation of IPS (OE/HS) was 1.87 ± 0.34, while that of IPS (CE/SS) was 0.51 ± 0.28. The ratio of IPS (CE/SS)/IPS (OE/HS) was 0.26 ± 0.12. No significant difference was observed between men and women (Tables 2, 3, 4). These results suggest that gender was not a significant factor in balance capability. No gender difference was observed in all generations of IPS.
Table 2. Descriptive characteristics of participants stratified by age with IPS (OE/HS).
| Age group | Total N | Men/Women N | Total | Men | Women | p value |
|---|---|---|---|---|---|---|
| 19–25 | 138 | 55/83 | 2.08 ± 0.19 | 2.04 ± 0.16 | 2.10 ± 0.21 | 0.055 |
| 26–35 | 63 | 23/40 | 2.00 ± 0.23 | 2.00 ± 0.21 | 2.00 ± 0.24 | 0.914 |
| 36–45 | 84 | 29/55 | 2.03 ± 0.19 | 2.03 ± 0.17 | 2.03 ± 0.19 | 0.969 |
| 46–55 | 71 | 5/66 | 1.91 ± 0.27 | 1.77 ± 0.30 | 1.92 ± 0.27 | 0.240 |
| 56–65 | 74 | 21/53 | 1.81 ± 0.28 | 1.84 ± 0.25 | 1.79 ± 0.29 | 0.477 |
| 66–75 | 110 | 28/82 | 1.63 ± 0.36 | 1.69 ± 0.35 | 1.61 ± 0.36 | 0.317 |
| 76–85 | 43 | 17/26 | 1.38 ± 0.40 | 1.38 ± 0.42 | 1.39 ± 0.40 | 0.947 |
Data are means ± standard deviation. IPS: index of postural stability (Refer to “IPS measurement” in SUBJECTS AND METHODS); OE/HS: open-eye/hard-surface. p value was calculated between men and women.
Table 3. Descriptive characteristics of participants stratified by age group with IPS (CE/SS).
| Age group | Total | Men | Women | p value |
|---|---|---|---|---|
| 19–25 | 0.72 ± 0.22 | 0.69 ± 0.20 | 0.74 ± 0.24 | 0.257 |
| 26–35 | 0.66 ± 0.28 | 0.70 ± 0.25 | 0.63 ± 0.29 | 0.290 |
| 36–45 | 0.61 ± 0.20 | 0.65 ± 0.22 | 0.59 ± 0.20 | 0.255 |
| 46–55 | 0.50 ± 0.27 | 0.36 ± 0.26 | 0.51 ± 0.19 | 0.105 |
| 56–65 | 0.39 ± 0.19 | 0.35 ± 0.19 | 0.40 ± 0.20 | 0.310 |
| 66–75 | 0.29 ± 0.19 | 0.26 ± 0.15 | 0.30 ± 0.20 | 0.312 |
| 76–85 | 0.20 ± 0.16 | 0.25 ± 0.18 | 0.17 ± 0.13 | 0.095 |
Data are means ± standard deviation. IPS: index of postural stability (Refer to “IPS measurement” in SUBJECTS AND METHODS); CE/SS: closed-eye/soft-surface. p value was calculated between men and women.
Table 4. Descriptive characteristics of participants stratified by age group with IPS (CE/SS)/IPS (OE/HS).
| Age group | Total | Men | Women | p value |
|---|---|---|---|---|
| 19–25 | 0.34 ± 0.10 | 0.34 ± 0.09 | 0.35 ± 0.10 | 0.621 |
| 26–35 | 0.32 ± 0.14 | 0.35 ± 0.13 | 0.31 ± 0.13 | 0.163 |
| 36–45 | 0.29 ± 0.10 | 0.32 ± 0.11 | 0.29 ± 0.09 | 0.216 |
| 46–55 | 0.26 ± 0.10 | 0.19 ± 0.14 | 0.27 ± 0.10 | 0.112 |
| 56–65 | 0.22 ± 0.10 | 0.19 ± 0.09 | 0.22 ± 0.10 | 0.163 |
| 66–75 | 0.18 ± 0.11 | 0.16 ± 0.11 | 0.18 ± 0.11 | 0.424 |
| 76–85 | 0.14 ± 0.10 | 0.18 ± 0.12 | 0.12 ± 0.07 | 0.060 |
Data are means ± standard deviation. IPS: index of postural stability (Refer to “IPS measurement” in SUBJECTS AND METHODS); CE/SS: closed-eye/soft-surface; OE/HS: open-eye/hard-surface. p value was calculated between men and women.
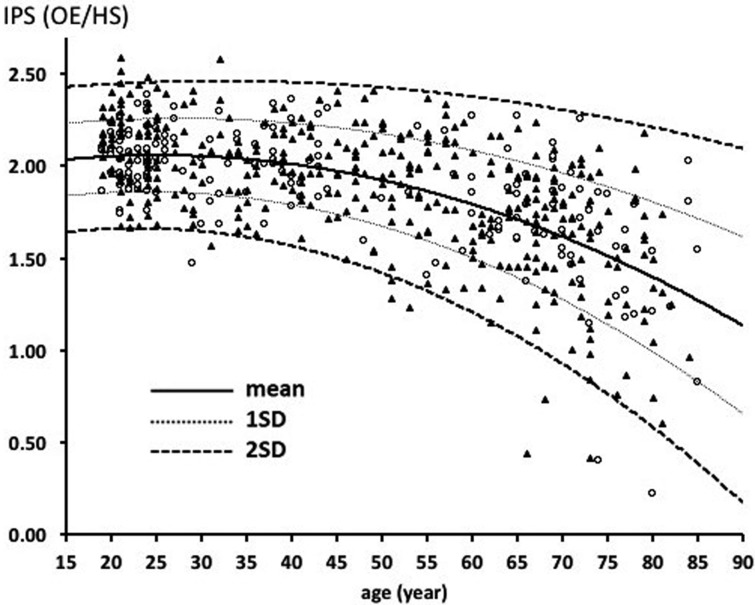
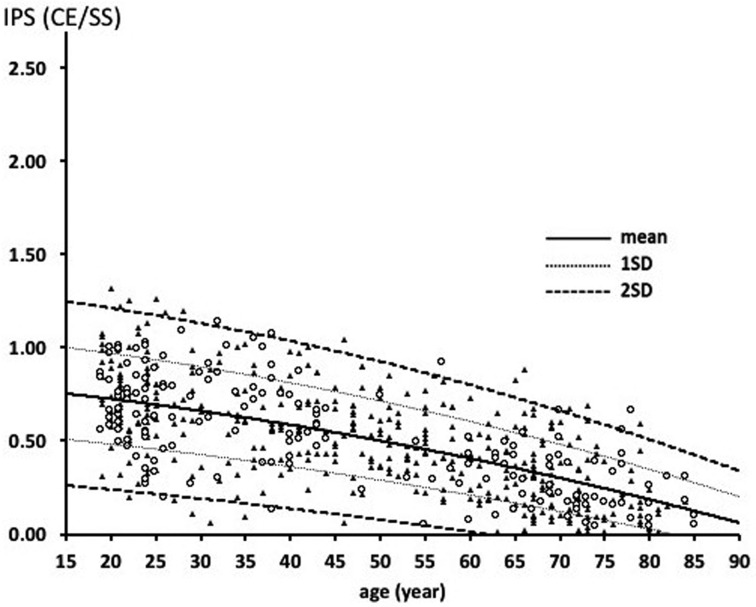
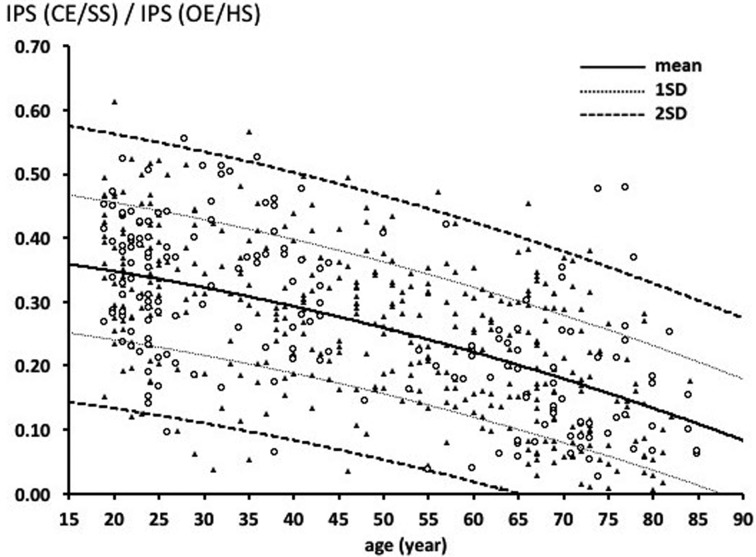
The results related to each IPS of all subjects and generation as determined using regression analysis are shown in Figs. 2, 3, 4. Approximate formulas were 1.9186 + 0.0111 × age −0.0002 × age2 in IPS (OE/HS), 0.8247–0.0039 × age −0.0001 × age2 in IPS (CE/SS), and 0.3863–0.0015 × age −0.0001 × age2 in IPS (CE/SS)/IPS (OE/HS).
Fig. 2.
Correlations of age with IPS (OE/HS). ○: Men. ▲: Women. SD:standard deviation. Scatterplot showing dynamic balance values in healthy individuals (n=405 women; n=178 men). Lines depict mean, 68th, and 95th percentiles.
Fig. 3.
Correlations of age with IPS (CE/SS). ○: Men. ▲: Women. SD:standard deviation. Scatterplot showing dynamic balance values in healthy individuals (n=405 women; n=178 men). Lines depict mean, 68th, and 95th percentiles.
Fig. 4.
Correlations of age with IPS (CE/SS)/IPS (OE/HS). ○: Men. ▲: Women. SD:standard deviation. Scatterplot showing dynamic balance values in healthy individuals (n=405 women; n=178 men). Lines depict mean, 68th, and 95th percentiles.
Determination coefficients of quadratic functions according to IPS and generation were /R2=0.38 for IPS (OE/HS) (p<0.001, Fig. 2); R2=0.44 for IPS (CE/SS) (p<0.001, Fig. 3); and R2=0.34 for IPS (CE/SS)/IPS (OE/HS) (p<0.001, Fig. 4). These results demonstrate a good determination coefficient of the regression curve, indicating a negative correlation with age in all indices.
DISCUSSION
Balance can be categorized into two types: static and dynamic13). When equilibrium is maintained for one stationary body position, it is called static balance14,15,16). Dynamic balance refers to maintaining equilibrium during motion or re-establishing equilibrium through rapid and successive changes in position14,15,16).
IPS, which is measured as movement of the center of gravity and maintenance of a standing position at limit points, is used to measure dynamic balance capability and may be an improved predictor for falls considering the situations when a fall may occur12).
In this study, IPS measurements were performed under two conditions of open eyes and hard surface (OE/HS), or closed eyes and soft (foam rubber) surface (CE/SS). A previous study reported the detrimental effects of closed eyes on postural sway compared with that of open eyes, and the effects of standing on a soft surface compared with a hard surface16). Thus, we used CE/SS as a severe balance condition.
We estimate that visual acuity, plantar superficial sense, deep sense of legs, vestibular function, and muscular strength of the lower body affect IPS (OE/HS). Closed eyes deprive subjects of visual information and a soft surface confuses the plantar superficial sense in IPS (CE/SS), which is an indicator of the effects of sensory disturbance17). In fact, Lord and Ward suggested that the body sway under conditions with closed eyes and on foam rubber correlated with quadriceps strength, proprioception, which was thought to reflect the position sense of feet, and vestibular function18).
We examined the ratio of IPS (OE/HS) and IPS (CE/SS) (Fig. 4). This accounts for balance ability, in the absence of visual acuity and plantar superficial sense. This ratio maintains input from deep sense, vestibular function, and muscular strength and may be a more appropriate marker of balance ability, especially for diabetic patients with compromised deep senses.
We suggest that the two remaining conditions of OE/SS and CE/HS are also useful. The difference between OE and CE should reveal dependence on visual information, while the difference between HS and SS reflects dependence on plantar superficial sense and muscular strength of the lower body. In future studies, IPS should be measured under all four conditions (OE/HS, OE/SS, CE/HS, and CE/SS) to evaluate dependence on each individual ability associated with dynamic standing-balance as precisely as possible.
In this study, we examined the relation between aging and the balance ability using the IPS measured with a stabilometer and noticed several intriguing observations. First, a ceiling effect was not observed in IPS (Figs. 1 and 2). Subjects <30 years old showed relatively high IPS (OE/HS) without an upper limit. Although IPS (CE/SS) approached zero in a portion of elderly subjects, both IPSs were measured quantitatively in almost all subjects. This result indicates that IPS can evaluate higher balance ability in athletes who have trained for competition. Second, we focused on a difference of aging-effects in IPS (OE/HS) and IPS (CE/SS). Levels of IPS (OE/HS) began to decrease at middle-age (40–60 years old), and then decreased more rapidly during elderly ages (>60 years old) (Fig. 2). On the other hand, IPS (CE/SS) decreased linearly with increasing age. These results suggest that the balance ability evaluated by IPS (OE/HS) strongly reflects visual acuity and/or plantar superficial sense. In other words, visual acuity and plantar superficial sense may compensate completely for the decline of deep sense, vestibular function, and/or muscular strength during youth, only partially during middle-age, and show rapid failure at advanced ages.
Interestingly, the ratio of IPS (OE/HS) and IPS (CE/SS) was one third at<40 years of age and decreased linearly with aging. This indicates a greater dependence on visual acuity and/or plantar superficial sense in elderly subjects.
From our results, we conclude that IPS (OE/HS) indicates the comprehensive balance ability of a subject at present, while IPS (CE/SS) reveals the partial balance ability hidden by compensation through visual acuity and plantar superficial sense.
IPS is a useful measurement in various situations. For example, IPS (CE/SS) measured during middle age could predict a future chance of falls during later years (elderly). Moreover, both IPSs may be useful tools to evaluate balance ability in aged people. It is important to evaluate prospectively both IPSs and the ratio as predictors for falls in frail, diabetic patients with sensory disturbances and related complications, as well as an assessment in the performance of athletes in particular fields.
REFERENCES
- 1.Tinetti ME, Speechley M, Ginter SF: Risk factors for falls among elderly persons living in the community. N Engl J Med, 1988, 319: 1701–1707. [DOI] [PubMed] [Google Scholar]
- 2.Kannus P, Sievänen H, Palvanen M, et al. : Prevention of falls and consequent injuries in elderly people. Lancet, 2005, 366: 1885–1893. [DOI] [PubMed] [Google Scholar]
- 3.Stevens JA, Corso PS, Finkelstein EA, et al. : The costs of fatal and non-fatal falls among older adults. Inj Prev, 2006, 12: 290–295. [DOI] [PMC free article] [PubMed] [Google Scholar]
- 4.Rubenstein LZ, Josephson KR: The epidemiology of falls and syncope. Clin Geriatr Med, 2002, 18: 141–158. [DOI] [PubMed] [Google Scholar]
- 5.Shumway-Cook A, Brauer S, Woollacott M: Predicting the probability for falls in community-dwelling older adults using the Timed Up & Go Test. Phys Ther, 2000, 80: 896–903. [PubMed] [Google Scholar]
- 6.Duncan PW, Studenski S, Chandler J, et al. : Functional reach: predictive validity in a sample of elderly male veterans. J Gerontol, 1992, 47: M93–M98. [DOI] [PubMed] [Google Scholar]
- 7.Campbell AJ, Borrie MJ, Spears GF: Risk factors for falls in a community-based prospective study of people 70 years and older. J Gerontol, 1989, 44: M112–M117. [DOI] [PubMed] [Google Scholar]
- 8.Lipsitz LA, Jonsson PV, Kelley MM, et al. : Causes and correlates of recurrent falls in ambulatory frail elderly. J Gerontol, 1991, 46: M114–M122. [DOI] [PubMed] [Google Scholar]
- 9.Berg KO, Maki BE, Williams JI, et al. : Clinical and laboratory measures of postural balance in an elderly population. Arch Phys Med Rehabil, 1992, 73: 1073–1080. [PubMed] [Google Scholar]
- 10.Downs S, Marquez J, Chiarelli P: Normative scores on the Berg Balance Scale decline after age 70 years in healthy community-dwelling people: a systematic review. J Physiother, 2014, 60: 85–89. [DOI] [PubMed] [Google Scholar]
- 11.Mochizuki H, Mineshima T: Reliability and validity of the Index of Postural Stability using forceplates. Rigaku Ryoho Gaku, 2000, 27: 199–203 (in Japanese). [Google Scholar]
- 12.Suzuki Y, Nakata Y, Kato H, et al. : Association between age and dynamic balance capability assessed by use of force plates. Jpn J Phys Fit Sports Med, 2015, 64: 419–425(in Japanese). [Google Scholar]
- 13.Nardone A, Schieppati M: The role of instrumental assessment of balance in clinical decision making. Eur J Phys Rehabil Med, 2010, 46: 221–237. [PubMed] [Google Scholar]
- 14.Brown CN, Mynark R: Balance deficits in recreational athletes with chronic ankle instability. J Athl Train, 2007, 42: 367–373. [PMC free article] [PubMed] [Google Scholar]
- 15.Davlin CD: Dynamic balance in high level athletes. Percept Mot Skills, 2004, 98: 1171–1176. [DOI] [PubMed] [Google Scholar]
- 16.Fujimoto C, Murofushi T, Chihara Y, et al. : Assessment of diagnostic accuracy of foam posturography for peripheral vestibular disorders: analysis of parameters related to visual and somatosensory dependence. Clin Neurophysiol, 2009, 120: 1408–1414. [DOI] [PubMed] [Google Scholar]
- 17.Maeda Y, Tanaka T, Nakajima Y, et al. : Dynamic postural adjustments in stance in response to translational perturbation in presence of visual somatosensory disturbance. J Med Biol Eng, 2014, 34: 333–340. [Google Scholar]
- 18.Lord SR, Ward JA: Age-associated differences in sensori-motor function and balance in community dwelling women. Age Ageing, 1994, 23: 452–460. [PubMed] [Google Scholar]


