Abstract
There are a large number of agricultural workers who are exposed to pesticides through skin and inhalation. The best approach to identify altered molecular pathways during dermal exposure to pesticides is relevant to risk-associated concern about skin safety. In this study, we investigated the cytotoxic effect of zineb, a fungicide, in human keratinocyte (HaCaT) cells. HaCaT cells were treated with zineb (1–40 µg/mL) for 24 hours. Cellular and molecular mechanisms of cell toxicity were investigated through MTT and neutral red-uptake assays. Zineb reduced viability of HaCaT cells and induced apoptosis in a concentration-dependent manner. Zineb increased levels of Bax and caspase 3 and inhibited the level of Bcl2, which subsequently induced apoptosis via the Bax/Bcl2 and caspase pathway. Therefore, zineb could have induced apoptosis through the mitochondrial pathway in HaCaT cells. Our study suggests that zineb is cytotoxic to HaCaT cells via the induction of apoptosis and oxidative stress in vitro.
Keywords: zineb, HaCaT cells, apoptosis, MTT assay, DNA damage
Introduction
Pesticides, including insecticides, fungicides, and herbicides, are chemicals that protect crops from destruction caused by various harmful pests. Application of pesticides has been constantly increasing over the past few decades, despite their deleterious effects on human health owing to the persistent residual presence of such chemicals and their derivatives in consumable crops, which show bioaccumulation and biomagnification. Chronic exposure to pesticides can disturb the function of various organs in the body, including the integumentary, immune, nervous, cardiovascular, respiratory, and other systems.1,2 Mostly, pesticides are absorbed through the skin during mixing, loading, and processing. However, the skin is the most prospective body surface to come into contact with pesticides that can cause toxic effects. Zineb is a class of fungicide (bisdithiocarbamate), and is used in paints on leather, linen, and wood. It controls many fungal diseases in crops through the spraying of 2.5 kg/1,000 L water/ha in fields, and has been found at 200 mg/m3 in the environment.3,4 It has been reported that zineb causes genotoxicity and cytotoxicity in various in vitro and in vivo models.5,6 Cecconi et al7 reported that zineb is toxic to insects and a metabolic poison for mammals.
Living skin cells can react to zineb in different ways, such as redness, pain, heat, and swelling, ie, inflammation.4 The degree of inflammation is a direct result of the concentration-dependent response to zineb. Excess inflammation can cause cell death, and then the manifestation will be much more severe. Zineb-induced cell death occurs when ROS are generated more quickly than they are scavenged by antioxidant defense mechanisms.8 Increased ROS levels in a cellular system can lead to damage to cellular DNA, proteins, lipids, and cellular and molecular changes that can result in cell toxicity and cell death.9,10 It is reported for the first time in this study that HaCaT cells exposed to zineb show significantly enhanced reactive oxygen species (ROS) levels and consequent increased DNA-strand breaks and decrease in cell viability in human keratinocytes. The current study was designed to assess the cytotoxicity of zineb, as well as to investigate the mechanism of zineb-induced cell death (apoptosis and necrosis) in HaCaT cells.
Materials and methods
Chemicals and consumables
Zineb (ethylene bisdithiocarbamate) was purchased from Sabero Organics (Mumbai, India). FBS, DMEM F12, antibiotics, trypsin, antimycotic solution, MTT, DCFH-DA, neutral red (NR) dye, acridine orange (AO), ethidium bromide (EtBr), PBS, propidium iodide, trypsin–EDTA solution, and cell-lysis solution were procured from Sigma-Aldrich (St Louis, MO, USA). Oligonucleotides were purchased from Integrated DNA Technologies (Coralville, IA, USA). A cDNA reverse-transcription kit, SYBR green, protein standard and Trizol reagent were bought from Thermo Fisher Scientific (Waltham, MA, USA).
Cell culture
HaCaT cells (human keratinocytes) was purchased from American Type Culture Collection (PCS-200-011; Rockville, MD, USA). These were cultured in DMEM with 10% FBS in 1%–2% antibiotic–antimycotic solution. Cultures were grown with 95% humidity and 5% CO2. Cells were viewed with phase-contrast microscopy (Nikon Eclipse TE2000).
MTT assay
The percentage cell viability of HaCaT cells was determined by MTT assay.11 HaCaT cells were grown in 96-well plates to 80% confluence for the cytotoxicity assay, and exposed to different concentrations of zineb (0–40 µg/mL) for 24 hours, after which 0.5 mg/mL MTT was added and cells incubated for 4 h. The MTT product (formazan crystal) concentration was determined at 550 nm using a microplate reader (Multiskan Ascent; MTX Lab Systems, Bradenton, FL, USA).
Neutral red-uptake assay
The NR-uptake (NRU) assay is a dye-inclusion assay. After treatment, plates were incubated for 4 hours with a supplemented medium containing 40 µg/mL NR. Cells were subsequently washed twice with DPBS and the dye extracted with 200 µL destaining solution (ethanol, deionized water, and glacial acetic acid, 50:49:1 v:v:v). Absorbance was read at 540 nm using the microplate reader. Cell viability in terms of percentage of control was expressed in the same manner as for the MTT assay. All data are presented as mean ± SE from three independent experiments.
ROS measurement
Generation of intracellular ROS was measured using DCFH-DA dye. HaCaT cells were cultured in 96-well plates and grown to 80% confluence. HaCaT cells were treated with various doses of zineb for 24 hours in the presence of 100 mM H2-DCFH-DA. Finally, cells were washed with PBS and relative fluorescence intensity determined by spectrofluorometry at 480 nm excitation and 530 nm emission.
For qualitative analysis of intracellular ROS generation in HaCaT cells (2×10⁴) after exposure to zineb, treated cells were incubated with H2-DCFH-DA in six-well plates in a CO2 (5%) incubator at 37°C for 30 minutes, then washed with normal PBS and fixed with paraformaldehyde (4%). Fluorescence of HaCaT cells was observed by upright fluorescence microscopy (Nikon Eclipse 80i).
Lipid peroxidation
Lipid peroxidation was determined by evaluation of malondi-aldehyde (MDA) in accordance with Ohkawa et al.12 HaCaT cells was cultured in six-well plates at 2×10⁴ cells/well and exposed to different concentrations of zineb, HaCaT cell was scraped and cell lysate prepared in lysis buffer. Cell lysates (100 µL) were mixed with 8.1% sodium dodecyl sulfate (200 µL), 20% acetic acid (1.5 mL) adjusted to pH 3.5, and 1.5 mL 0.8% thiobarbituric acid. The solution was increased 4 mL by adding Milli-Q water and warmed to 95°C for 120 minutes. The solution was mixed with n-butanol and pyridine (15:1 v:v) and shaken at room temperature. The mixture was centrifuged at 3100 ×g for 15 minutes, supernatants collected, and optical density determined at 546 nm. The quantity of MDA was measured according to a standard curve.
Glutathione
Glutathione was estimated by the method of Saldak and Lindsay.13 In brief, after exposure to zineb (0–40 µg/mL), treated cells were scraped and separated by centrifugation at 1,500 rpm for 2 minutes at 4°C and lysed in lysis buffer. The cell extract (100 µL) was mixed into reaction mixture (500 µL), 0.4 M Tris buffer (1,000 µL) and 0.01 M 5,5-dithiobis-(2-nitrobenzoic acid) (100 µL). The mixed cell lysate was put for 25 minutes at 37°C and after incubation it was read at 412 nm against blank. The amount of glutathione was expressed as nM/mg protein.
Superoxide dismutase (SOD)
SOD activity was determined in accordance with Kono14 using nitroblue tetrazolium in the presence of riboflavin. After zineb (0–40 µg/mL) exposure, the cell was scraped and centrifuged at 1,500 rpm for 2 minute at 4°C and lysed in lysis buffer. The cell extract (100 µL) was mixed with 50 mM sodium carbonate buffer (1.9 mL), 1.6 mM nitroblue tetrazolium (30 µL), Triton X-100 (6 µL) and 100 mM hydroxylamine-HCl (20 µL). The reaction mixture was mixed very well and absorbance was read at 560 nm for 5 minutes against blanks (reaction mixtures and cell extract).
Catalase
Catalase activity was measured using the method described by Aebi.15 Briefly, after zineb (0–40 µg/mL) exposure, the cell was scraped and centrifuged at 1,500 rpm for 2 minute at 4°C and lysed in lysis buffer. The cell extract (100 µL) was mixed with H2O2 phosphate buffer (800 µL) and distilled water (100 µL) and absorbance was read at 240 nm for 4 minutes against blank (H2O2 PBS).
Morphological changes in cells by EtBr-AO staining
Qualitative analysis of normal, apoptotic, and necrotic cells was performed using EtBr/AO morphology assay. Subsequently, cells were exposed to zineb in a concentration-dependent manner. Cells were incubated with a cocktail of EtBr-AO (1 mM). After 30 minutes incubation, cells were washed three times with PBS. Apoptosis/necrosis was observed by fluorescence images in an upright microscope (Nikon Eclipse).
Comet assay
Comet assay was performed following the method of Ali et al.16 Cells were cultured in six-well plates. After 24 hours’ incubation, cells were treated with and without zineb. The first layer (1% normal agarose) on slide was prepared and dried for 20 min and then 1% low-melting-point agarose (80 µL) was added to the cell suspension (20 µL), covered with cover slip, and kept at 4°C for hardening. A third layer was prepared by 0.5% low-melting-point agarose (80 µL), kept at 4°C for hardening, and the coverslip removed. All slides were put in lysis solution overnight at 4°C. Further, run electrophoresis at 16 V for 30 min. Slides were neutralized with buffer for 5 minutes and stained with EtBr. Percentage tail DNA and olive tail moment (OTM) were applied to determine DNA damage in cells. We have taken total 50 cell images from each concentration (25 cell images from each replicate slide) for analysis of each experiment (Komet 5 image-analysis software).
Western blot analysis
HaCaT cells (1.5×10⁵) were plated in six-well plates and incubated for 24 hours at room temperature. Cells were exposed to zineb for 24 hours. Protein was extracted with a cocktail of protein-lysis buffer and protease inhibitor (15 µL/mL). The concentration of protein was determined by the Bradford method.17 Protein in each treated sample was separated on SDS-PAGE (10%), transferred onto polyvinylidene fluoride membranes, and aspecific sites blocked with 5% nonfat dry milk for 1 hour. The primary human monoclonal antibodies β-actin, Bax, Bcl2, and caspase 3 (1:1,500) were diluted as per the manufacturer’s protocol, and put on the membrane for 24 h at 4°C. After incubation, the membrane was washed three times with TBST (10 mM Tris-HCl, 150 mM NaCl, and 0.05% Tween 20), secondary antibodies (HRP-conjugated) were mixed (1:2,000) and put on the membranes for 2 hours. After being washed three times with PBS, bands were visualized using an Immobilon chemiluminescent HRP substrate (Millipore).
RNA extraction and quantitative RT-PCR
With TRI reagent (Sigma-Aldrich), total RNA was extracted from HaCaT cells according to the manufacturer’s instructions. Quantification of total RNA was determined at 260 nm by nanodrop spectrophotometry (ND-1000; Thermo Fisher Scientific). cDNA was synthesized by high-capacity reverse-transcription (RT) kit (RevertAid first-strand cDNA-synthesis kit; Thermo Fisher Scientific). For detection of caspase 3, Bax, Bcl2, and β-actin, mRNA polymerase chain reaction (PCR) primers were designed (Table 1).
Table 1.
List of primer sequences
| Genes | Primer sequence |
|---|---|
| β-Actin | F-CCAACCGCGAGAAGATGA |
| R-CCAGAGGCGTACAGGGATAG | |
| Caspase 3 | F-AGGACTCTAGACGGCATCCA |
| R-CAGTGAGACTTGGTGCAGTGA | |
| Bax | F-TTCATCCAGGATCGAGCAGG |
| R-TGAGACACTCGCTCAGCTTC | |
| Bcl2 | F-TGGACAACCATGACCTTGGACAATCA |
| R-TCCATCCTCCACCAGTGTTCCCATC |
Abbreviations: F, forward; R, reverse.
Statistical analysis
Statistical differences were determined by one-way analysis of variance. Data are expressed as mean ± SE for three independent experiments.
Results
Effect of zineb on cell viability
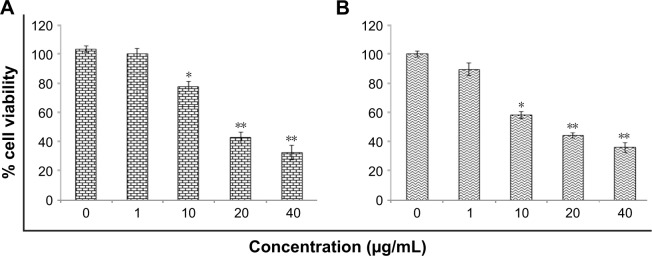
Figure 1 shows percentage cell viability of HaCaT cells through MTT and NRU tests. Zineb significantly reduced cell viability above 10 µg/mL concentration (Figure 1). The highest toxicity of zineb was observed at 40 µg/mL, and cell viability dropped by up to 70.5% compared to controls. For NRU assays, similar results were observed. Cell viability was reduced by 62% at the same concentration of zineb (P<0.01). Zineb (20 µg/mL) caused more than 50% cell death in MTT and NRU assays. As such, we found the EC50 24-hour value of zineb 25 µg/mL for HaCaT cells.
Figure 1.
Cytotoxicity of zineb in HaCaT cells for 24 hours.
Notes: (A) MTT assay; (B) NRU assay. Each value represents the mean ± SE of three experiments. *P<0.05 and **P<0.01 vs control.
Abbreviation: NRU, neutral red uptake.
ROS generation and oxidative stress
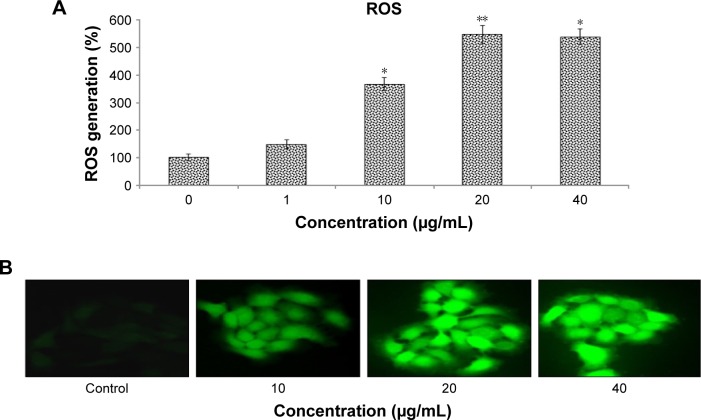
To assess oxidative stress in HaCaT cells due to zineb exposure, we evaluated the quantitative and qualitative generation of fluorescent DCF (the result of DCFH oxidation by different peroxides). Zineb-exposed HaCaT cells showed significant enhancement in production of ROS in terms of DCF-florescence intensity. Fluorescence-intensity increased to 445% and 436% in the 20 and 40 µg/mL zineb-treated groups for 24 hours’ exposure compared to controls (Figure 2).
Figure 2.
Zineb-induced ROS in HaCaT cells.
Notes: (A) ROS generation (%) in HaCaT cells; (B) fluorescence intensity of intracellular ROS generation in HaCaT cells after zineb exposure for 24 hours. Images were taken with phase-contrast fluorescence microscopy (Nikon 80i; Melville, NY, USA). Magnification: 40×. Each value represents the mean ± SE of three experiments. *P<0.05 and **P<0.01 vs control.
Abbreviation: ROS, reactive oxygen species.
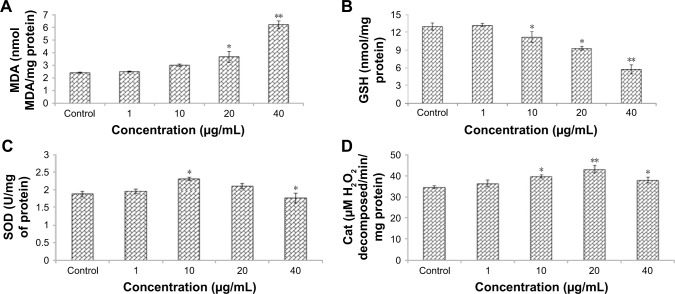
Zineb induced lipid peroxidation in HaCaT cells. After 24 hours incubation with different concentrations of zineb, MDA levels were increased compared to controls (Figure 3A). Results showed that zineb-induced oxidative stress was further evidenced by depletion of glutathione (Figure 3B) and enhanced SOD and catalase levels at 10 µg/mL, but, however, SOD and catalase levels declined slightly at 40 mg/mL in comparison to 10 µg/mL (Figure 3C and D).
Figure 3.
Levels of (A) LPO, (B) GSH, (C) SOD, and (D) Cat activity in HaCaT cells after exposure to zineb for 24 hours.
Notes: Each value represents the mean ± SE of three experiments. *P<0.05 and **P<0.01 vs control.
Abbreviations: Cat, catalase; GSH, glutathione; LPO, lipid peroxidation; MDA, malondialdehyde; SOD, superoxide dismutase.
AO-EtBr staining
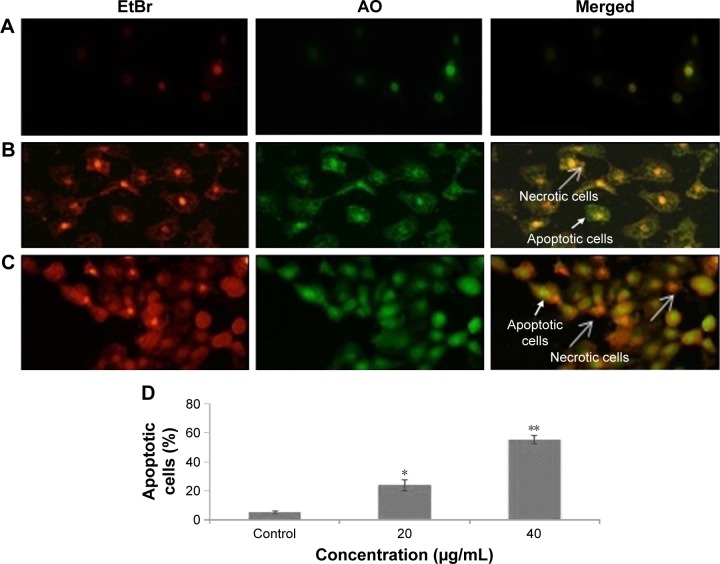
The effect of zineb showed enhanced apoptosis, which was measured by AO/EtBr morphological assays in HaCaT cells (Figure 4). Live cells exhibited normal nuclear chromatin with green fluorescence, but apoptotic cells had fragmented DNA (intense orange). Zineb treatment resulted in a significant number of apoptotic cells compared to controls (Figure 4A–C).
Figure 4.
EtBr-AO double staining was used to identify live cells (green), apoptotic cells (orange), and necrotic cells (red).
Notes: (A) Control cells; (B) 20 µg/mL zineb-exposed cells; (C) 40 µg/mL zineb-exposed cells; (D) graphic representation of apoptotic cells. Note that EtBr entered damaged cells only and bound with condensed nuclear material. Mean ± SE of three experiments are shown. *P<0.05 and **P<0.01 compared to control.
Abbreviations: AO, acridine orange; EtBr, ethidium bromide.
DNA damage
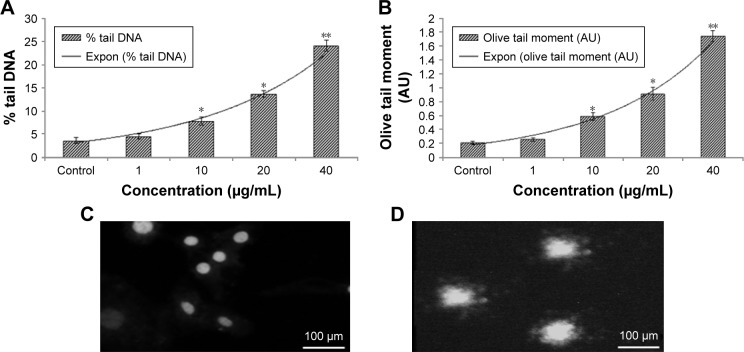
Fragmentation of DNA was measured using the alkaline comet assay, a sensitive tool for measuring DNA-strand breakage in individual cells.18 DNA damage (percentage tail DNA and OTM) reached about 5.6-fold and 3-fold control values after 24 hours zineb exposure at concentrations of 40 and 20 µg/mL, respectively (Figure 5). Indeed, zineb induced DNA damage in a concentration-dependent manner.
Figure 5.
DNA-strand breakage in HaCaT cells due to zineb.
Notes: (A) Tail DNA (%), (B) olive tail moment, and (C) control cells, and (D) at 40 μg/mL for 24 hours. Each value represents the mean ± SE of three experiments. *P<0.05 and **P<0.01 vs control.
Abbreviation: Expon, exponential.
Western blot analysis
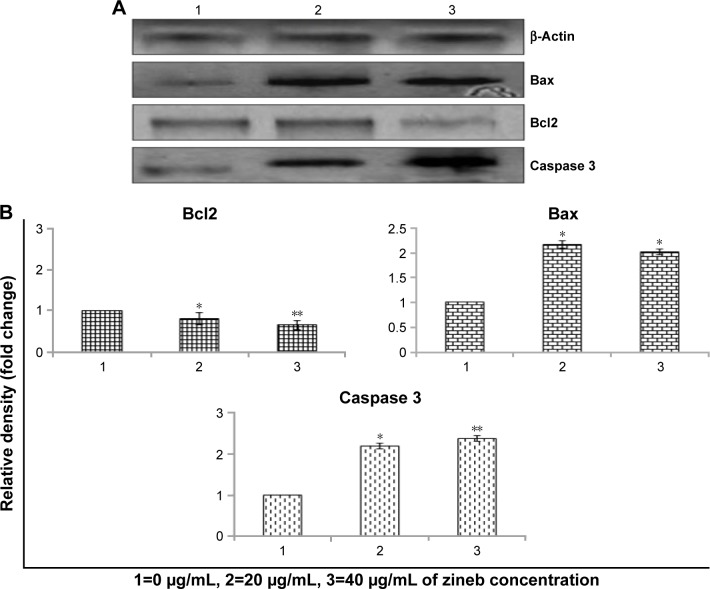
Western blot data showed that there was a significant increase in Bax:Bcl2 ratio expression in zineb over control groups. Further significant increase in expression levels of caspase 3 was found in zineb-treated cells over controls (Figure 6).
Figure 6.
Western blot analysis of protein involved in apoptosis due to zineb for 24 hours’ exposure.
Notes: (A) Bax, Bcl2, and caspase 3. β-Actin was used as internal control to normalize the results. (B) Relative quantification of protein-expression levels. Results expressed as mean ± SE of triplicate experiments. *P<0.05 and **P<0.01 vs control.
mRNA expression in HaCaT cells analyzed by RT-PCR
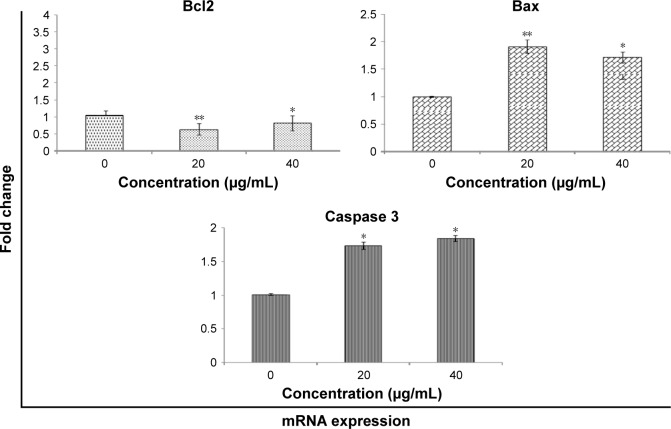
Expressions of caspase 3, Bax, and Bcl2 were analyzed by quantitative RT-PCR with and without (control) zineb treatment. Results showed significant (P<0.01) upregulation of Bax and downregulation of Bcl2 in treated cells over controls, as well as increased expression of caspase 3 in treated HaCaT cells (Figure 7).
Figure 7.
mRNA expression of Bcl2, Bax, and caspase 3 in HaCaT cells treated and not treated with zineb.
Notes: Results expressed as mean ± SE of triplicate experiments. *P<0.05 and **P<0.01 vs control.
Discussion
The concern of toxicity in reference to pesticides has been a key dilemma for human health for the past few decades. Pesticides were developed to control pests for more and safer production, but several pesticides present prospective risks to human health and the environment. Zineb is one of the most widely used commercial fungicides worldwide. Concerns related to fungicide use and human health have been raised, due to the injurious effect on individuals exposed to them. Specifically, exposure to fungicides has revealed a connection with progress of skin diseases.19,20 Meanwhile, as skin receives maximum exposure to zineb and other fungicides, it is important to identify their toxicity. Some researchers have recognized the dermal molecular toxicity mechanism of zineb and other fungicides that are widely used. We studied the mechanisms of geno/cytotoxic molecules of zineb using the illustrative human keratinocyte HaCaT cell line as an in vitro skin model. It has been found that numerous fungicides which are applied to inhibit soybean rust can also suppress the cell growth and disrupt the ovarian cell cycle, and zineb exhibits a more significant toxic response.21 This shows the cytotoxicity of zineb on HaCaT cells. Cell toxicity was increased in a dose dependent manner after 24-hour exposure, and this indicates that zineb can activate cell death in keratinocytes. There are diverse mechanisms of cell death, including necrosis, apoptosis, mitotic catastrophe, and pyroptosis.22 Several studies have established that pesticides can induce cell apoptosis, resulting in dysregulation of associated functions.23–25 Apoptosis is programmed cell death that serves as a mechanism to maintain homeostasis in normal cells, and initiation of apoptosis may be a principal pathological event that causes cell alteration and diseases.26 EtBr-AO morphological assays showed that late apoptosis in the form of red fluorescence occur in HaCaT cells rather than necrosis. We also demonstrated that zineb induced apoptosis was a mechanism of toxicity. Molecular markers of cell death, such as Bax:Bcl2 ratio and caspases, showed an increase in late apoptosis compared with controls upon zineb treatment, and exposed cells showed significant DNA damage (percentage tail and OTM), a characteristic of apoptosis. In addition, gene expression and proteins involved in apoptotic pathways were upregulated due to zineb treatment. Bax/Bcl2 and caspase 3 induce intrinsic/extrinsic pathways of apoptosis,27 and caspase 3 is a final executioner in extrinsic pathways.28
Figure 6 indicates that zineb induced Bax/Bcl2 and caspase 3 protein expression. Figure 7 indicates that zineb upregulated BAX and CASP3 and downregulated BCL2 gene expression. These data imply that ROS mediate mitochondria-dependent pathways involved in zineb-induced apoptosis. It is well acknowledged that the Bax/Bcl2 is involved with levels of mitochondrial membrane potential.29,30 Zineb induced the caspase 3 enzyme as a consequence of apoptosis in HaCaT cells. We found that zineb produced significant toxicity in HaCaT cells in a concentration-dependent manner in the range 0–40 µg/mL. Zineb also increased the level of Bax, inhibited levels of Bcl2, and triggered caspase 3 activity, which subsequently evinced apoptosis via the Bax/Bcl2 and caspase 3 pathway.
Conclusion
We established the apoptotic and cell-toxicity effects of zineb in human keratinocyte cells in vitro. Our findings show consumers and agricultural agencies the potential risks of zineb and zineb-containing products.
Acknowledgments
The authors extend their appreciation to the Deanship of Scientific Research at King Saud University for funding this work through Research Group RGP-1435-076.
Footnotes
Disclosure
The authors report no conflicts of interest in this work.
References
- 1.de Souza A, Medeiros AR, de Souza AC, et al. Evaluation of the impact of exposure to pesticides on the health of the rural population: Vale do Taquari, state of Rio Grande do Sul (Brazil) Cien Saude Colet. 2011;16:3519–3528. doi: 10.1590/s1413-81232011000900020. Portuguese. [DOI] [PubMed] [Google Scholar]
- 2.Mostafalou S, Abdollahi M. Pesticides and human chronic diseases: evidences [sic], mechanisms, and perspectives. Toxicol Appl Pharmacol. 2013;268:157–177. doi: 10.1016/j.taap.2013.01.025. [DOI] [PubMed] [Google Scholar]
- 3.Indian Agricultural Research Institute . Technological Options for Enhanced Productivity and Profit. New Delhi: IARI; 2014. [Google Scholar]
- 4.ExToxNet Cutaneous toxicity: toxic effects on skin. 1993. [Accessed November 6, 2017]. Available from: http://pmep.cce.cornell.edu/profiles/extoxnet/TIB/cutaneoustox.html.
- 5.Elia MC, Arce G, Hurt SS, O’Neill PJ, Scribner HE. The genetic toxicology of ethylenethiourea: a case study concerning the evaluation of a chemical’s genotoxic potential. Mutat Res. 1995;341:141–149. doi: 10.1016/0165-1218(95)90004-7. [DOI] [PubMed] [Google Scholar]
- 6.Soloneski S, Reigosa MA, Larramendy ML. Effect of the dithiocarbamate pesticide zineb and its commercial formulation, the Azzurro – V: abnormalities induced in the spindle apparatus of transformed and non-transformed mammalian cell lines. Mutat Res. 2003;536:121–129. doi: 10.1016/s1383-5718(03)00038-x. [DOI] [PubMed] [Google Scholar]
- 7.Cecconi S, Paro R, Rossi G, Macchiarelli G. The effects of the endocrine disruptors dithiocarbamates on the mammalian ovary with particular regard to mancozeb. Curr Pharm Des. 2007;13:2989–3004. doi: 10.2174/138161207782110516. [DOI] [PubMed] [Google Scholar]
- 8.Jia Z, Misra HP. Reactive oxygen species in in vitro pesticide-induced neuronal cell (SH-SY5Y) cytotoxicity: role of NFκB and caspase-3. Free Radic Biol Med. 2007;42:288–298. doi: 10.1016/j.freeradbiomed.2006.10.047. [DOI] [PubMed] [Google Scholar]
- 9.Finkel T, Holbrook NJ. Oxidants, oxidative stress and the biology of aging. Nature. 2000;408:239–247. doi: 10.1038/35041687. [DOI] [PubMed] [Google Scholar]
- 10.Valko M, Leibfritz D, Moncol J, Cronin MT, Mazur M, Telser J. Free radicals and antioxidants in normal physiological functions and human disease. Int J Biochem Cell Biol. 2007;39:44–84. doi: 10.1016/j.biocel.2006.07.001. [DOI] [PubMed] [Google Scholar]
- 11.Mosmann T. Rapid colorimetric assay for cellular growth and survival: application to proliferation and cytotoxicity assays. J Immunol Methods. 1983;65:55–63. doi: 10.1016/0022-1759(83)90303-4. [DOI] [PubMed] [Google Scholar]
- 12.Ohkawa H, Ohishi N, Yagi K. Assay for lipid peroxides in animal tissues by thiobarbituric acid reaction. Anal Biochem. 1979;95:351–358. doi: 10.1016/0003-2697(79)90738-3. [DOI] [PubMed] [Google Scholar]
- 13.Saldak J, Lindsay RH. Estimation of total, protein-bound, and nonprotein sulfhydryl groups in tissue with Ellman’s reagent. Anal Biochem. 1968;25:192–205. doi: 10.1016/0003-2697(68)90092-4. [DOI] [PubMed] [Google Scholar]
- 14.Kono Y. Generation of superoxide radical during autoxidation of hydroxylamine and an assay for superoxide dismutase. Arch Biochem Biophys. 1978;186:189–195. doi: 10.1016/0003-9861(78)90479-4. [DOI] [PubMed] [Google Scholar]
- 15.Aebi H. Catalase. In: Bergmeyer HU, editor. Methods of Enzymatic Analysis. New York: Academic Press; 1974. pp. 673–684. [Google Scholar]
- 16.Ali D, Verma A, Mujtaba SF, Dwivedi A, Hans RK, Ray RS. UVB-induced apoptosis and DNA damaging potential of chrysene via reactive oxygen species in human keratinocytes. Toxicol Lett. 2011;204:199–207. doi: 10.1016/j.toxlet.2011.04.033. [DOI] [PubMed] [Google Scholar]
- 17.Bradford MM. A rapid sensitive method for the quantification of microgram quantities of protein utilizing the principle of protein-dye binding. Anal Biochem. 1976;72:248–254. doi: 10.1006/abio.1976.9999. [DOI] [PubMed] [Google Scholar]
- 18.Kang C, Xu Q, Martin TD, et al. The DNA damage response induces inflammation and senescence by inhibiting autophagy of GATA4. Science. 2015;349:aaa5612. doi: 10.1126/science.aaa5612. [DOI] [PMC free article] [PubMed] [Google Scholar]
- 19.Guo YL, Wang BJ, Lee CC, Wang JD. Prevalence of dermatoses and skin sensitization associated with the use of pesticides in fruit farmers of southern Taiwan. Occup Environ Med. 1996;53:427–431. doi: 10.1136/oem.53.6.427. [DOI] [PMC free article] [PubMed] [Google Scholar]
- 20.Spiewak R. Pesticides as a cause of occupational skin diseases in farmers. Ann Agric Environ Med. 2001;8:1–5. [PubMed] [Google Scholar]
- 21.Daniel SL, Hartman GL, Wagner ED, Plewa MJ. Mammalian cell cytotoxicity analysis of soybean rust fungicides. Bull Environ Contam Toxicol. 2007;78:474–478. doi: 10.1007/s00128-007-9193-8. [DOI] [PubMed] [Google Scholar]
- 22.Kroemer G, Galluzzi L, Vandenabeele P, et al. Classification of cell death: recommendations of the Nomenclature Committee on Cell Death 2009. Cell Death Differ. 2009;16:3–11. doi: 10.1038/cdd.2008.150. [DOI] [PMC free article] [PubMed] [Google Scholar]
- 23.Ahmadi FA, Linseman DA, Grammatopoulos TN, et al. The pesticide rotenone induces caspase-3-mediated apoptosis in ventral mesencephalic dopaminergic neurons. J Neurochem. 2003;87:914–921. doi: 10.1046/j.1471-4159.2003.02068.x. [DOI] [PubMed] [Google Scholar]
- 24.Calviello G, Piccioni E, Boninsegna A, et al. DNA damage and apoptosis induction by the pesticide mancozeb in rat cells: involvement of the oxidative mechanism. Toxicol Appl Pharmacol. 2006;211:87–96. doi: 10.1016/j.taap.2005.06.001. [DOI] [PubMed] [Google Scholar]
- 25.Fukuyama T, Kosaka T, Tajima Y, Hayashi K, Shutoh Y, Harada T. Detection of thymocytes apoptosis in mice induced by organochlorine pesticides methoxychlor. Immunopharmacol Immunotoxicol. 2011;33:193–200. doi: 10.3109/08923973.2010.495128. [DOI] [PubMed] [Google Scholar]
- 26.MacFarlane M, Williams AC. Apoptosis and disease: a life or death decision. EMBO Rep. 2004;5:674–678. doi: 10.1038/sj.embor.7400191. [DOI] [PMC free article] [PubMed] [Google Scholar]
- 27.Zou H, Henzel WJ, Liu X, Lutschg A, Wang X. Apaf1, a human protein homologous to C. elegans CED-4, participates in cytochrome C-dependent activation of caspase-3. Cell. 1997;90:405–413. doi: 10.1016/s0092-8674(00)80501-2. [DOI] [PubMed] [Google Scholar]
- 28.Falschlehner C, Emmerich CH, Gerlach B, Walczak H. TRAIL signaling: decisions between life and death. Int J Biochem Cell Biol. 2007;39:1462–1475. doi: 10.1016/j.biocel.2007.02.007. [DOI] [PubMed] [Google Scholar]
- 29.Barlow BK, Lee DW, Cory-Slechta DA, Opanashuk LA. Modulation of antioxidant defense systems by the environmental pesticide maneb in dopaminergic cells. Neurotoxicology. 2005;26:63–75. doi: 10.1016/j.neuro.2004.07.004. [DOI] [PubMed] [Google Scholar]
- 30.Drechsel DA, Patel M. Role of reactive oxygen species in the neurotoxicity of environmental agents implicated in Parkinson’s disease. Free Radic Biol Med. 2008;44:1873–1886. doi: 10.1016/j.freeradbiomed.2008.02.008. [DOI] [PMC free article] [PubMed] [Google Scholar]


