Abstract
Background
The neutrophil–lymphocyte ratio (NLR), a biomarker for systematic inflammation, has been recently identified as a prognostic factor for various types of both solid and hematologic malignancies. Our study presented here was the first meta-analysis assessing the prognostic role of NLR in multiple myeloma (MM).
Methods
We systematically searched PubMed, Embase, and ISI Web of Science for relevant studies. Odds ratios (ORs) or hazards ratios (HRs) with corresponding 95% CIs are pooled to estimate the association between NLR and clinicopathological parameters or survival of MM patients.
Results
Seven trials with 1,971 MM patients were enrolled in the meta-analysis, and the results indicated that elevated pretreatment NLR was significantly associated with advanced tumor stages (International Staging System [ISS] III vs ISS I–II: OR 2.427, 95% CI: 1.268–4.467; and Durie–Salmon III vs Durie–Salmon I–II: OR 1.738, 95% CI: 1.133–2.665). Moreover, increased NLR also predicted poorer overall survival (HR 2.084, 95% CI: 1.341–3.238) and progression-free survival (HR 1.029, 95% CI: 1.016–1.042). And two-stage dose–response meta-analysis revealed linear association between increased NLR and risk of mortality in MM patients.
Conclusion
We can conclude that MM patients with higher NLR are more likely to have poorer prognosis than those with lower NLR.
Keywords: neutrophil–lymphocyte ratio, multiple myeloma, prognosis, dose–response meta-analysis
Introduction
Multiple myeloma (MM) is well known as a malignant neoplasm of plasma cells derived from a single clonal expansion in the bone marrow (BM), which is characterized by bone destruction, renal failure, anemia, and hypercalcemia.1 In the USA in 2016, the American Cancer Society estimated that there were 30,280 newly diagnosed MM patients and 12,590 deaths caused by MM, and MM accounted for more than 18% of all hematologic malignancies.2 For optimal personalized treatment, accurate assessment of prognosis is urgently required in the clinical practice. However, high variability exists in the prognosis of patients with MM.
As we all know, the International Staging System (ISS) was developed on the basis of a multicenter study, which reported that β2-microglobin (β2-MG) and serum albumin were most closely correlated with the prognosis by the multivariate analysis. Although ISS overcame several limitations of Durie–Salmon (D-S) staging system, and was applied worldwide for many years, the Revised ISS is now widely accepted as the new standard prognostic model for MM patients in case of therapeutic innovation and technical development. However, clinical progress of myeloma patients and their survival are so highly variable that we cannot get exact prognosis just based on the state at the time of diagnosis. Besides, BM biopsy is invasive and some further clinical examinations, such as fluorescence in situ hybridization (FISH), are too expensive to be affordable. Therefore, researchers pay more attention to combining some patient-related factors to develop new prognostic models.
Recently, the systemic inflammation has been presented as a critical component of tumor progression.3 In this context, several studies have investigated effective markers to measure the correlation between inflammation and survival of various cancer patients, including C-reactive protein, albumin, as well as the neutrophil–lymphocyte ratio (NLR), lymphocyte–monocyte ratio, and platelet–lymphocyte ratio, and so on.4–7 The NLR, simply neutrophil count (cells/µL) divided by lymphocyte count (cells/µL), has been recently identified as a prognostic factor for both solid tumors and hematologic malignancies.8–11
Elevated level of NLR may predict poor clinical outcome in MM. Meanwhile, due to the variance in the study design and sample size, direct impact of NLR level on patients’ survival and tumor’s clinicopathological parameters remains inconclusive. In this study, we searched PubMed (Medline), Embase, and ISI Web of Science databases for relevant studies and performed a meta-analysis in order to determine the prognostic role of NLR in MM and investigate the association between NLR and some clinicopathological parameters.
Methods
Search strategy
We conducted the systematic search strategies described by Dickersin et al12 to identify all relevant electric publications until April 2017 throughout databases, including PubMed (Medline), Ovid (EMBASE), and ISI Web of Science databases. The search strategy included terms as follows: “NLR” (eg, “neutrophil to lymphocyte ratio”, “neutrophil lymphocyte ratio”, and “neutrophil-to-lymphocyte ratio”), “prognosis” (eg, “outcome”, “survival”, and “mortality”), and “MM” (eg, “multiple myeloma”, “myeloma”, “plasmacytoma”, “myelomatosis”, and “Kahler’s disease”). Furthermore, we manually checked the reference lists of retrieved studies to identify more potential pertinent studies.
Selection criteria
Studies were included in the meta-analysis if they met all of the following criteria: 1) patients were diagnosed with MM according to International Myeloma Working Group criteria 2014;13 2) association between the pretreatment NLR and overall survival (OS), progression-free survival (PFS), or other clinicopathological parameters was reported; 3) studies that were not directly reporting hazards ratios (HRs) and 95% CI were allowed if we could reconstruct them by p-values and other data reported;14 4) the publication language was confined to English. Exclusion criteria were 1) abstracts, letters, reviews, case reports, and so on; 2) studies with insufficient data for analysis; 3) studies without specific data concerning MM or NLR; and 4) multiple published reports. When there were several reports concerning the same cohort, we included the most recent publication in our meta-analysis.
Data extraction
Two investigators (FJF and SDM) independently identified the eligible studies for this meta-analysis. Any disagreement was resolved by discussion with the third party (SDM and LSA). The qualities of the included studies were assessed according to the Newcastle–Ottawa Quality Assessment Scale (NOS). This scale uses a star system (with a maximum of nine stars) to evaluate a study in three domains: selection of participants, comparability of study groups, and the ascertainment of outcomes of interest. NOS scores of ≥6 were assigned as high-quality studies. For each study, the following relevant data were extracted in a predefined table: 1) first author’s name, year of publication, country of the population, sample size, patient age, gender, therapy, follow-up period; 2) clinicopathological parameters including β2-MG level, ISS stages, and D-S stages; 3) survival data including OS and PFS (OS was calculated from the medical treatment until the death of patient or the last follow-up. PFS was defined as the interval between the date of treatment and the detection of the recurrence tumor or death from any cause); 4) cut-off value used to define “elevated NLR”.
Statistical analysis
HR and 95% CIs were obtained directly from each literature or from estimation according to the methods by Parmer et al.14 The combined odds ratio (OR) and its 95% CIs were used to evaluate the association between NLR and clinicopathological parameters.15
A two-stage dose–response meta-analysis was conducted to assess whether NLR was associated with higher risks of mortality from MM, based on specific cut-off values, distribution of death cases and person-years, and adjusted HRs with 95% CIs. We used the generalized least-square regression described by Orsini et al to calculate the study-specific linear trend and 95% CIs for higher NLR within each study from the natural logs of adjusted HRs and 95% CIs, and pooled HRs and 95% CIs were obtained under the random-effects model.16 We approximately derived person-years from follow-up duration and the number of participants at each NLR level. The midpoint of the higher NLR category was set at 1.2 times the lower boundary (specific cut-off value in each study). And we set the lower boundary to zero in the lower NLR category.
Heterogeneity among included studies was checked by the χ2-based Q-test and I2 test.17 The fixed-effect model was used for analysis without any significant heterogeneity between studies (p>0.10, I2=0%). Otherwise, the random-effects model was chosen. Subgroup analysis and metaregression were further performed to explore the source of heterogeneity. Sensitivity analysis was also performed to examine the effect of each study on the overall pooled results. All statistical tests were two sided and the significance level was set at 5%.
The Begg’s funnel plot was used to visually evaluate the publication bias of all studies included in our meta-analysis. And then the Egger’s bias indicator test was performed for each of the pooled study groups.18 All analyses were carried out using STATA statistical software package version 14.0 (STATA, College Station, TX, USA).
Results
Selection and characteristics of included studies
As shown in Figure 1, the initial search algorithm retrieved a total of 125 studies. After excluding the duplicates (n=21), abstracts, letters, reviews, and so on (n=13), and the studies not related to research topics (n=41), the remaining studies (n=50) were further reviewed by reading the full text. Additional studies were then excluded because they did not provide specific data concerning MM (n=27) or NLR (n=16). Therefore, seven studies10,16,19–23 between 2014 and 2017 with a total of 1,971 MM patients were enrolled in our meta-analysis.
Figure 1.
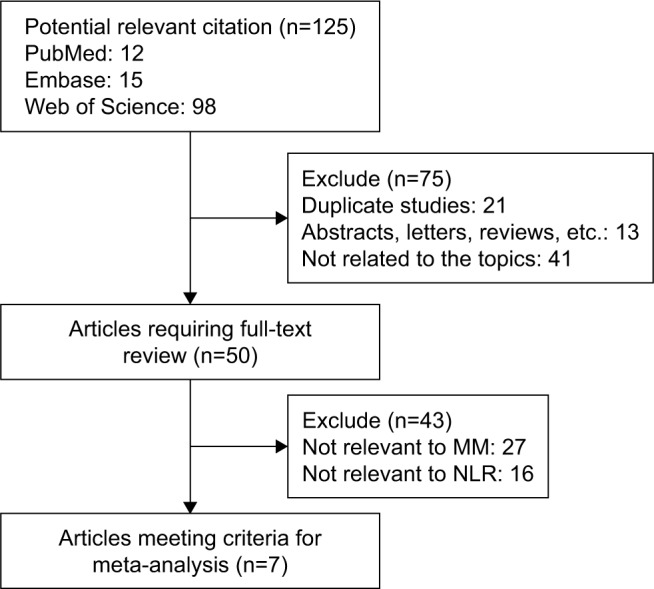
Flow diagram of the selection of relevant published works regarding NLR in MM.
Abbreviations: MM, multiple myeloma; NLR, neutrophil–lymphocyte ratio.
Summary on the characteristics of the included studies is shown in Table 1. The publication periods of all included studies range from 2014 to 2017. Three studies were from the eastern region (two from China21,22 and one from Korea20) and four from the western region (two from Turkey,16,19 one from the USA,23 and one from the USA and Italy). Three studies16,19,23 enrolled <200 patients and four studies10,20–22 had >200 patients. Five studies10,19,20,22,23 directly reported HR and 95% CIs in the original literature. NOS score was above 7 in four studies.10,20–22
Table 1.
Characteristics of studies included in the meta-analysis
| Author | Year | Country | Follow-upamedian (range) | Age | Cases (male/female) | Sample size | Cut-off value | Therapy | Outcome | Survival analysis | Methodb | NOS score |
|---|---|---|---|---|---|---|---|---|---|---|---|---|
| Kelkitli et al19 | 2014 | Turkey | 41 (1–100) | 63 (35–89) | 83/68 | 151 | 2 | NR | OS | No | 2 | 7 |
| Kim et al20 | 2017 | Korea | .10 years | 64 (30–83) | 160/113 | 273 | 2.25 | Chemotherapy including novel agents and/or eligible ASCT | OS | M | 1 | 8 |
| Li et al21 | 2017 | China | 25 (1–64) | NR | 196/119 | 315 | 2 | Bortezomib-based or conventional chemotherapy, such as thalidomide, doxorubicin, or vincristine | OS, PFS | U, M | 1 | 8 |
| Onec et al16 | 2017 | Turkey | (1–60) | 65.5 (34–88) | 28/24 | 52 | 1.72 | VAD and/or bortezomib-based therapies, such as BD and BCD | OS | U, M | 1 | 7 |
| Romano et al10 | 2015 | Italy and USA | (1–60) | 63 (28–88) | 161/148 | 309 | 2 | (V)TD/Rd + ASCT or VMP | OS, PFS | No | 1 | 9 |
| Shi et al22 | 2017 | China | 64 (1–96) | NR | 344/216 | 560 | 4 | NR | OS, PFS | M | 1 | 8 |
| Wongrakpanich et al23 | 2016 | USA | (1–140) | 69 (56–78) | 62/69 | 131 | 2.783 | NR | OS | U, M | 1 | 7 |
Notes:
Denoted as obtaining estimated follow-up ranges from Kaplan–Meier curves in the corresponding publications.
1 denoted as obtaining HRs directly from publications; 2 denoted as estimating HRs from Kaplan–Meier curves, using GetData Graph Digitizer 2.26 (http://getdata-graph-digitizer.com/) to digitize and extract the relevant survival data.
Abbreviations: ASCT, autologous stem cell transplantation; BCD, bortezomib, cyclophosphamide, and dexamethasone; BD, bortezomib and dexamethasone; HR, hazards ratio; M, multivariate analysis; NOS, Newcastle–Ottawa Quality Assessment Scale; NR, not reported; PFS, progression-free survival; OS, overall survival; Rd, lenalidomide and dexamethasone; U, univariate analysis; VAD, vincristine, adriamycin, and dexamethasone; VMP, bortezomib, melphalan, and prednisone; (V)TD, (bortezomib), thalidomide, and dexamethasone.
Association between NLR and clinicopathological parameters
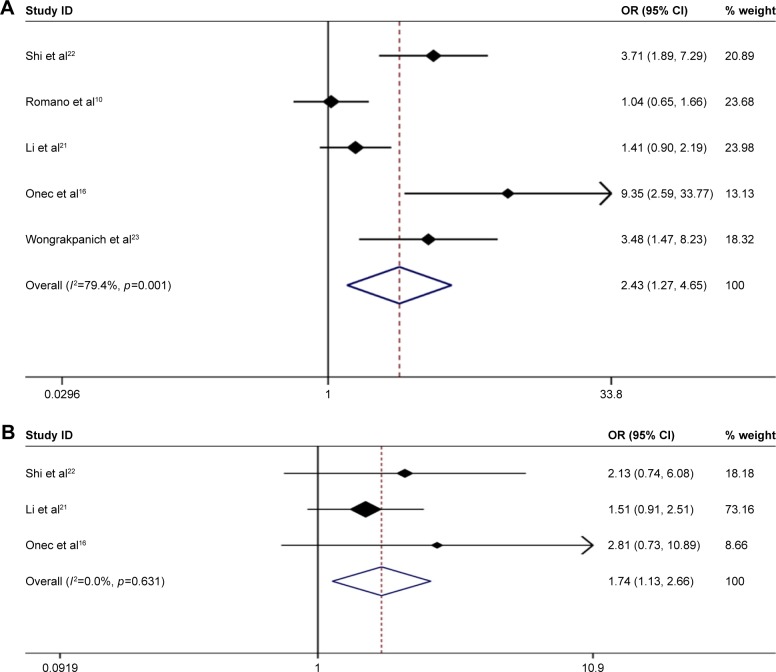
We next analyzed the association between NLR and clinicopathological parameters. Among seven studies in our meta-analysis, five studies10,16,20–23 indicated a significant correlation between high NLR and advanced ISS staging of MM patients (ISS III vs ISS I–II: pooled OR 2.427, 95% CI: 1.268–4.467) with significant heterogeneity (χ2=19.44, p=0.001; I2=79.4%) (Figure 2A).
Figure 2.
Forest plots showing the association between elevated NLR and clinicopathological parameters. (A) ISS staging (III vs I–II); (B) D-S staging (III vs I–II).
Abbreviations: OR, odds ratio; NLR, neutrophil–lymphocyte ratio; ISS, International Staging System.
Moreover, three studies16,21,22 examined the association between high NLR and advanced D-S staging of MM patients. The results showed a significant association (D-S III vs D-S I–II: pooled OR 1.738, 95% CI: 1.133–2.665) with no heterogeneity (χ2=0.92, p=0.631; I2=0.0%) (Figure 2B).
Association between NLR and survival of MM patients
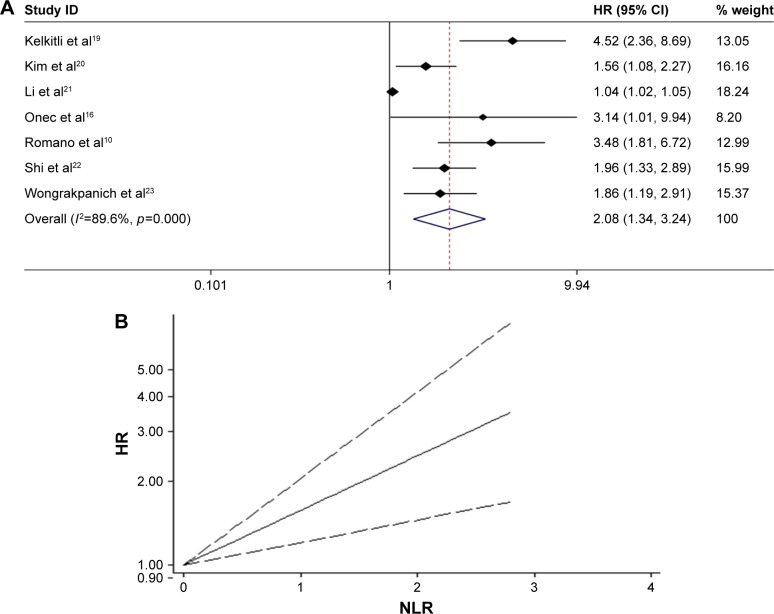
Seven studies10,16,19–23 in our analysis examined the association between NLR and survival of MM patients. With heterogeneity (χ2=57.64, p<0.0001; I2=89.6%), the pooled HR of 2.084 (95% CI: 1.341–3.238) indicated that MM patients with elevated NLR were expected to have shorter OS (Figure 3A). Furthermore, we conducted a dose–response meta-analysis to evaluate the prognostic role of NLR on specific cut-off value using generalized least squares. And the results showed linear association between higher NLR and shorter OS in MM patients (HR =1.568, 95% CI: 1.205–2.04, p=0.001) (Figure 3B).
Figure 3.
(A) Meta-analysis of the association between elevated NLR and OS of MM. (B) Dose-response analysis of the prognostic role of NLR in OS of MM.
Abbreviations: HR, hazards ratio; NLR, neutrophil–lymphocyte ratio; MM, multiple myeloma; OS, overall survival.
To explore the source of heterogeneity, subgroup analysis and metaregression were performed by the study location (eastern vs western region), sample size (≥200 vs <200), cut-off value defining “elevated NLR” (2 vs not 2), and NOS score (≥8 vs <8). The subgroup analysis did not alter the prognostic role of NLR in OS substantially (Table 2), with significant heterogeneity across studies in most subgroups. Metaregression analysis figured out that study location (p=0.064) might partially explain the source of the heterogeneity.
Table 2.
Subgroup analysis and metaregression of pooled hazard ratios for overall survival in MM patients with high NLR
| Subgroup analysis | No of studies | No of patients | Pooled HR (95% CI) | Metaregression (p-value) | Heterogeneity
|
|
|---|---|---|---|---|---|---|
| I2, % | p-value | |||||
| Region | ||||||
| Western | 4 | 643 | 2.714 (1.992–3.699) | 47.5 | 0.126 | |
| Eastern | 3 | 1,148 | 1.421 (0.924–2.185) | 0.064 | 86.6 | 0.001 |
| Sample size | ||||||
| <200 | 3 | 334 | 2.832 (1.504–5.330) | 0.259 | 60.0 | 0.082 |
| ≥200 | 4 | 1,457 | 1.706 (1.053–2.764) | 89.3 | <0.001 | |
| Cutoff value | ||||||
| =2.0 | 3 | 775 | 1.038 (1.020–1.056) | 0.773 | 99.3 | <0.001 |
| ≠2.0 | 4 | 1,016 | 1.811 (1.445–2.269) | 0.0 | 0.641 | |
| NOS score | ||||||
| ≥8 | 4 | 1,457 | 1.706 (1.053–2.764) | 0.259 | 89.3 | <0.001 |
| <8 | 3 | 334 | 2.832 (1.504–5.332) | 60.0 | 0.082 | |
Abbreviations: HR, hazards ratio; MM, multiple myeloma; NLR, neutrophil–lymphocyte ratio; NOS, Newcastle–Ottawa Quality Assessment Scale.
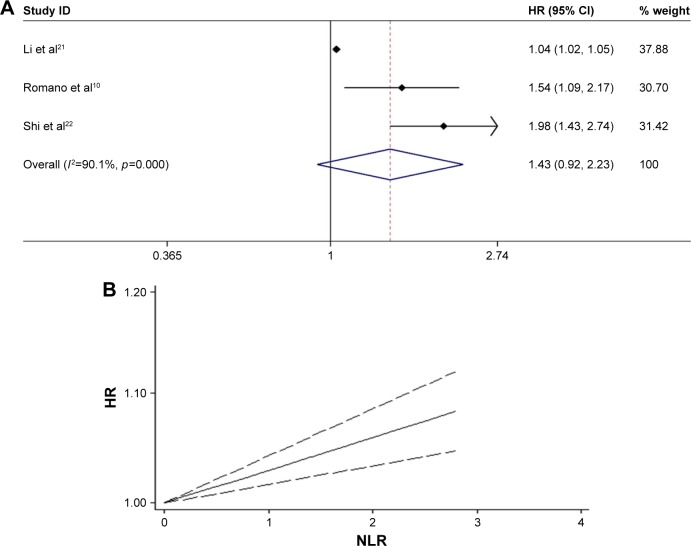
Furthermore, three studies10,21,22 were pooled to estimate the correlation between NLR and PFS in MM patients. The results showed that there was no significant relationship between high NLR and shorter PFS (HR =1.434, 95% CI: 0.923–2.227), with significant heterogeneity (χ2=20.13, p<0.0001; I2=90.1%) (Figure 4A). The dose–response meta-analysis revealed linear association between higher NLR and shorter PFS in MM patients (HR =1.029, 95% CI: 1.016–1.042, p<0.001) (Figure 4B). Because of the limited original literature, subgroup analysis and metaregression cannot be performed to explore the source of significant heterogeneity. So, more relevant studies are warranted to validate our present meta-analytic results.
Figure 4.
(A) Meta-analysis of the association between elevated NLR and PFS of MM. (B) Dose-response analysis of the prognostic role of NLR in PFS of MM.
Abbreviations: HR, hazards ratio; NLR, neutrophil–lymphocyte ratio; MM, multiple myeloma; PFS, progression-free survival.
Sensitivity analysis
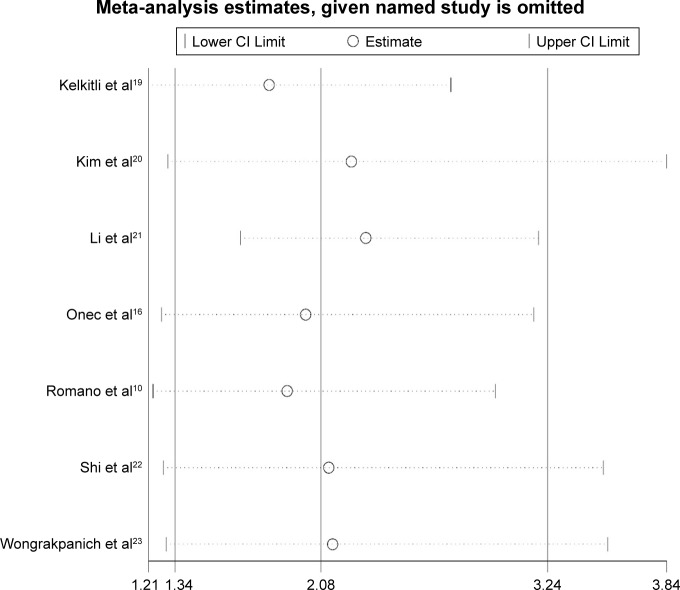
Sensitivity analyses were performed next. A single study involved in the meta-analysis was deleted each time to unveil the influence of the individual data set on the pooled HRs. It was shown that one study from Li et al21 impacted the results obviously, indicating the main source of heterogeneity to some extent (Figure 5).
Figure 5.
Sensitivity analysis of the overall pooled study for OS.
Abbreviation: OS, overall survival.
Publication bias
Based on the results of sensitivity analysis, the outlier study from Li et al21 was excluded from the analysis of publication bias. The Begg’s funnel plot showed that there was no significant asymmetry for OS (p=0.260) (Figure 6). The p-value of Egger’s test also indicated that there was no publication bias in OS (p=0.077) among the studies included in our meta-analysis.
Figure 6.
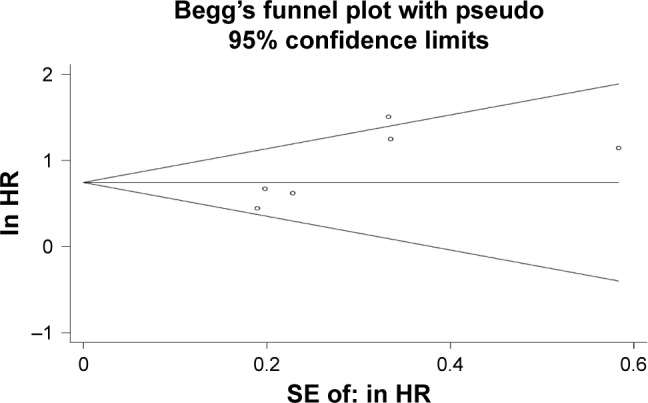
Publication bias of the present meta-analysis.
Abbreviation: HR, hazards ratio.
Discussion
Previous studies have demonstrated the biological and prognostic importance of a proinflammatory tumor microenvironment in cancer progression.3,24–26 Numerous studies27,28 and several meta-analyses11,29,30 have provided solid evidence on the correlation between elevated pretreatment NLR and poor prognosis in different tumors, including colorectal cancer, hepatocellular carcinoma, renal cell carcinoma, non-small-cell lung cancer, and urinary cancer.
Our study presented here was the first meta-analysis assessing the association between NLR and clinicopathological parameters as well as prognosis in MM. Seven trials with a total of 1,791 patients were included in this meta-analysis, demonstrating that there was also a significant association between NLR and clinicopathological parameters (Figure 2). What is more, elevated NLR predicted shorter OS and PFS in MM patients (Figures 3 and 4). The results were consistent with previous reports, indicating that NLR is also a promising prognostic biomarker for MM treatment and outcomes.
This heterogeneity among these included studies may be partially explained by study location, sample size, cut-off value of NLR, and NOS score. Significant heterogeneity in selection bias is inevitable in studies with smaller sample sizes. However, the subgroup analysis showed that the prognostic value of NLR was unaffected by the above factors included in the analysis. Moreover, baseline pretreatment, types and doses of chemotherapy regimens, and dichotomized cut-off values also differed among the studies. Although different treatments for MM patient might affect the OS outcome, patients were divided into two groups according to the pretreatment NLR in every study. Thus, treatment protocol is not a confounding factor in the meta-analysis. Definitely, more studies are warranted to further investigate the prognostic role of NLR in MM patients undergoing different therapies. In addition, the sensitivity analysis identified the study from Li et al,21 impacting the results obviously, while, after excluding the outlier study, the analytic results were not apparently affected, thus indicating the robustness of pooled results in our meta-analysis.
NLR has the advantage of low economic cost and wide availability, thereby drawing increasing attention. Mechanically, an elevated NLR is usually caused by neutrophilia and lymphopenia. Neutrophilia can prompt secreting active cytokines such as vascular endothelial growth factor and therefore accelerate tumor progression.31 Lymphopenia is regarded to correlate with disease severity and is linked to the immune escape of tumor cells from tumor-infiltrating lymphocytes.32,33 Therefore, an elevated NLR generates a favorable immune microenvironment that promotes vascular invasion and host immune suppression, thereby correlating to poor prognosis of patients.
Limitations
It is noteworthy that our meta-analysis had some limitations that call for cautious interpretation of the results. First, only seven studies published in full text were included in this meta-analysis. Second, the cut-off value for defining high NLR in each study was not the same (Table 1), which may have contributed to heterogeneity. Third, some studies provided only a Kaplan–Meier curve and did not report HR or 95% CI, possibly causing inaccurate HR estimation. Fourth, differences of paper quality and sample size across the studies might cause bias in the meta-analysis, although subgroup analysis and metaregression did not show the above factors as the resource of heterogeneity. Fifth, most of the included studies reported positive results; therefore, our results might overestimate the prognostic significance of NLR to some degree.
Despite the above limitations, our meta-analysis supports the values of NLR for predicting survival outcome in MM patients. NLR can be easily obtained from routine blood tests, and thus may be widely applied in clinic as an alternative to cytogenetic and FISH analysis, gene expression profiling, plasma cell labeling index, serum free light chain ratio, and early interim analysis with positron emission tomography for evaluating risk stratification of MM patients.
Conclusions
Here, we searched electronic databases for relevant studies, and enrolled seven studies with a total of 1,791 patients in meta-analysis, drawing a conclusion that patients with higher NLR are more likely to have shorter OS and PFS under more advanced stages. Taken together, the results from our meta-analysis suggest that NLR gains a prognostic value for patients with MM. More multicenter, prospective cohorts are warranted to further validate the role of the NLR in MM.
Acknowledgments
We would like to thank the researchers and study participants for their contributions. This work was supported by grants of the National Natural Science Foundation of China (No 81500172 for Lisha Ai, and No 81670197 for Chunyan Sun); and the Integrated Innovative Team for Major Human Diseases Program of Tongji Medical College, HUST; and the Clinical Research Physician Program of Tongji Medical College, HUST.
Footnotes
Disclosure
The authors report no conflicts of interest in this work.
References
- 1.Röllig C, Knop S, Bornhäuser M. Multiple myeloma. Lancet. 2015;385(9983):2197–2208. doi: 10.1016/S0140-6736(14)60493-1. [DOI] [PubMed] [Google Scholar]
- 2.Siegel RL, Miller KD, Jemal A. Cancer Statistics, 2017. CA Cancer J Clin. 2017;67(1):7–30. doi: 10.3322/caac.21387. [DOI] [PubMed] [Google Scholar]
- 3.Grivennikov SI, Greten FR, Karin M. Immunity, inflammation, and cancer. Cell. 2010;140(6):883–899. doi: 10.1016/j.cell.2010.01.025. [DOI] [PMC free article] [PubMed] [Google Scholar]
- 4.Polterauer S, Grimm C, Seebacher V, et al. The inflammation-based Glasgow Prognostic Score predicts survival in patients with cervical cancer. Int J Gynecol Cancer. 2010;20(6):1052–1057. doi: 10.1111/IGC.0b013e3181e64bb1. [DOI] [PubMed] [Google Scholar]
- 5.Mcmillan DC. The systemic inflammation-based Glasgow Prognostic Score: a decade of experience in patients with cancer. Cancer Treat Rev. 2013;39(5):534–540. doi: 10.1016/j.ctrv.2012.08.003. [DOI] [PubMed] [Google Scholar]
- 6.Pinato DJ, Stebbing J, Ishizuka M, et al. A novel and validated prognostic index in hepatocellular carcinoma: the inflammation based index (IBI) J Hepatol. 2012;57(5):1013–1020. doi: 10.1016/j.jhep.2012.06.022. [DOI] [PubMed] [Google Scholar]
- 7.Proctor MJ, Horgan PG, Talwar D, Fletcher CD, Morrison DS, McMillan DC. Optimization of the systemic inflammation-based Glasgow prognostic score: a Glasgow Inflammation Outcome Study. Cancer. 2013;119(12):2325–2332. doi: 10.1002/cncr.28018. [DOI] [PubMed] [Google Scholar]
- 8.Keam B, Ha H, Kim TM, et al. Neutrophil to lymphocyte ratio improves prognostic prediction of International Prognostic Index for patients with diffuse large B-cell lymphoma treated with rituximab, cyclophosphamide, doxorubicin, vincristine and prednisone. Leuk Lymphoma. 2015;56(7):2032–2038. doi: 10.3109/10428194.2014.982642. [DOI] [PubMed] [Google Scholar]
- 9.Koh YW, Kang HJ, Park C, et al. Prognostic significance of the ratio of absolute neutrophil count to absolute lymphocyte count in classic Hodgkin lymphoma. Am J Clin Pathol. 2012;138(6):846–854. doi: 10.1309/AJCPO46GFKGNXCBR. [DOI] [PubMed] [Google Scholar]
- 10.Romano A, Parrinello NL, Consoli ML, et al. Neutrophil to lymphocyte ratio (NLR) improves the risk assessment of ISS staging in newly diagnosed MM patients treated upfront with novel agents. Ann Hematol. 2015;94(11):1875–1883. doi: 10.1007/s00277-015-2462-4. [DOI] [PMC free article] [PubMed] [Google Scholar]
- 11.Templeton AJ, McNamara MG, Šeruga B, et al. Prognostic role of neutrophil-to-lymphocyte ratio in solid tumors: a systematic review and meta-analysis. J Natl Cancer Inst. 2014;106(6):dju124. doi: 10.1093/jnci/dju124. [DOI] [PubMed] [Google Scholar]
- 12.Dickersin K, Scherer R, Lefebvre C. Identifying relevant studies for systematic reviews. BMJ. 1994;309(6964):1286–1291. doi: 10.1136/bmj.309.6964.1286. [DOI] [PMC free article] [PubMed] [Google Scholar]
- 13.Chng WJ, Dispenzieri A, Chim CS, et al. IMWG consensus on risk stratification in multiple myeloma. Leukemia. 2014;28(2):269–277. doi: 10.1038/leu.2013.247. [DOI] [PubMed] [Google Scholar]
- 14.Parmar MK, Torri V, Stewart L. Extracting summary statistics to perform meta-analysis of the published literature for survival endpoints. Stat Med. 1998;17(24):2815–2834. doi: 10.1002/(sici)1097-0258(19981230)17:24<2815::aid-sim110>3.0.co;2-8. [DOI] [PubMed] [Google Scholar]
- 15.Moher D, Liberati A, Tetzlaff J, Altman DG, PRISMA Group Preferred reporting items for systematic reviews and meta-analyzes: the PRISMA statement. PLoS Med. 2009;6(7):e1000097. doi: 10.1371/journal.pmed.1000097. [DOI] [PMC free article] [PubMed] [Google Scholar]
- 16.Onec B, Okutan H, Albayrak M, et al. The predictive role of the neutrophil/lymphocyte ratio in survival with multiple myeloma: a single center experience. J Clin Lab Anal. 2017;31(2) doi: 10.1002/jcla.22032. [DOI] [PMC free article] [PubMed] [Google Scholar]
- 17.Higgins JP, Thompson SG, Deeks JJ, Altman DG. Measuring inconsistency in meta-analyzes. BMJ. 2003;327(7414):557–560. doi: 10.1136/bmj.327.7414.557. [DOI] [PMC free article] [PubMed] [Google Scholar]
- 18.Stuck AE, Rubenstein LZ, Wieland D. Bias in meta-analysis detected by a simple, graphical test. Asymmetry detected in funnel plot was probably due to true heterogeneity. BMJ. 1998;316(7129):469. [PMC free article] [PubMed] [Google Scholar]
- 19.Kelkitli E, Atay H, Cilingir F, et al. Predicting survival for multiple myeloma patients using baseline neutrophil/lymphocyte ratio. Ann Hematol. 2014;93(5):841–846. doi: 10.1007/s00277-013-1978-8. [DOI] [PubMed] [Google Scholar]
- 20.Kim DS, Yu ES, Kang KW, et al. Myeloma prognostic index at diagnosis might be a prognostic marker in patients newly diagnosed with multiple myeloma. Korean J Intern Med. 2017;32(4):711–721. doi: 10.3904/kjim.2016.054. [DOI] [PMC free article] [PubMed] [Google Scholar]
- 21.Li Y, Li H, Li W, et al. Pretreatment neutrophil/lymphocyte ratio but not platelet/lymphocyte ratio has a prognostic impact in multiple myeloma. J Clin Lab Anal. 2017;31(5) doi: 10.1002/jcla.22107. [DOI] [PMC free article] [PubMed] [Google Scholar]
- 22.Shi L, Qin X, Wang H, et al. Elevated neutrophil-to-lymphocyte ratio and monocyte-to-lymphocyte ratio and decreased platelet-to-lymphocyte ratio are associated with poor prognosis in multiple myeloma. Oncotarget. 2017;8(12):18792–18801. doi: 10.18632/oncotarget.13320. [DOI] [PMC free article] [PubMed] [Google Scholar]
- 23.Wongrakpanich S, George G, Chaiwatcharayut W, et al. The prognostic significance of neutrophil-to-lymphocyte and platelet-to-lymphocyte ratios in patients with multiple myeloma. J Clin Lab Anal. 2016;30(6):1208–1213. doi: 10.1002/jcla.22004. [DOI] [PMC free article] [PubMed] [Google Scholar]
- 24.Hanahan D, Weinberg RA. Hallmarks of cancer: the next generation. Cell. 2011;144(5):646–674. doi: 10.1016/j.cell.2011.02.013. [DOI] [PubMed] [Google Scholar]
- 25.Shalapour S, Karin M. Immunity, inflammation, and cancer: an eternal fight between good and evil. J Clin Invest. 2015;125(9):3347–3355. doi: 10.1172/JCI80007. [DOI] [PMC free article] [PubMed] [Google Scholar]
- 26.Wang D, Dubois RN. Immunosuppression associated with chronic inflammation in the tumor microenvironment. Carcinogenesis. 2015;36(10):1085–1093. doi: 10.1093/carcin/bgv123. [DOI] [PMC free article] [PubMed] [Google Scholar]
- 27.Viers BR, Boorjian SA1, Frank I, et al. Pretreatment neutrophil-to-lymphocyte ratio is associated with advanced pathologic tumor stage and increased cancer-specific mortality among patients with urothelial carcinoma of the bladder undergoing radical cystectomy. Eur Urol. 2014;66(6):1157–1164. doi: 10.1016/j.eururo.2014.02.042. [DOI] [PubMed] [Google Scholar]
- 28.Berardi R, Rinaldi S, Santoni M, et al. Prognostic models to predict survival in patients with advanced non-small cell lung cancer treated with first-line chemo- or targeted therapy. Oncotarget. 2016;7(18):26916–26924. doi: 10.18632/oncotarget.8309. [DOI] [PMC free article] [PubMed] [Google Scholar]
- 29.Gu XB, Tian T, Tian XJ, Zhang XJ. Prognostic significance of neutrophil-to-lymphocyte ratio in non-small cell lung cancer: a meta-analysis. Sci Rep. 2015;5:12493. doi: 10.1038/srep12493. [DOI] [PMC free article] [PubMed] [Google Scholar]
- 30.Hu K, Lou L, Ye J, Zhang S. Prognostic role of the neutrophil-lymphocyte ratio in renal cell carcinoma: a meta-analysis. BMJ Open. 2015;5(4):e006404. doi: 10.1136/bmjopen-2014-006404. [DOI] [PMC free article] [PubMed] [Google Scholar]
- 31.Jablonska J, Leschner S, Westphal K, Lienenklaus S, Weiss S. Neutrophils responsive to endogenous IFN-beta regulate tumor angiogenesis and growth in a mouse tumor model. J Clin Invest. 2010;120(4):1151–1164. doi: 10.1172/JCI37223. [DOI] [PMC free article] [PubMed] [Google Scholar]
- 32.Ray-Coquard I, Cropet C, Van Glabbeke M, et al. European Organization for Research and Treatment of Cancer Soft Tissue and Bone Sarcoma Group Lymphopenia as a prognostic factor for overall survival in advanced carcinomas, sarcomas, and lymphomas. Cancer Res. 2009;69(13):5383–5391. doi: 10.1158/0008-5472.CAN-08-3845. [DOI] [PMC free article] [PubMed] [Google Scholar]
- 33.Porrata LF, Rsitow K, Inwards DJ, et al. Lymphopenia assessed during routine follow-up after immunochemotherapy (R-CHOP) is a risk factor for predicting relapse in patients with diffuse large B-cell lymphoma. Leukemia. 2010;24(7):1343–1349. doi: 10.1038/leu.2010.108. [DOI] [PubMed] [Google Scholar]


