Abstract
We describe a novel functional imaging approach for quantitative analysis of right ventricular (RV) blood flow patterns in specific experimental animals (or humans) using real-time, three-dimensional (3-D) echocardiography (RT3D). The method is independent of the digital imaging modality used. It comprises three parts. First, a semiautomated segmentation aided by intraluminal contrast medium locates the RV endocardial surface. Second, a geometric scheme for dynamic RV chamber reconstruction applies a time interpolation procedure to the RT3D data to quantify wall geometry and motion at 400 Hz. A volumetric prism method validated the dynamic geometric reconstruction against simultaneous sonomicrometric canine measurements. Finally, the RV endocardial border motion information is used for mesh generation on a computational fluid dynamics solver to simulate development of the early RV diastolic inflow field. Boundary conditions (tessellated endocardial surface nodal velocities) for the solver are directly derived from the endocardial geometry and motion information. The new functional imaging approach may yield important kinematic information on the distribution of instantaneous velocities in the RV diastolic flow field of specific normal or diseased hearts.
Keywords: cardiac image analysis, ventricular function, cardiac fluid dynamics, right ventricle, heart chamber volume
QUANTITATIVE ANALYSIS of three-dimensional (3-D) digital cardiac images has become increasingly important given the recent advances in the digital cardiac imaging techniques of 3-D echocardiography, magnetic resonance imaging, computed tomography, and digital fluoroscopy (1, 24, 26). The growth of these digital imaging techniques is accompanied by an increasing usage of image manipulation tools, providing more elaborate image analysis and measurement and quantitative evaluation and leading to more refined diagnostic accuracy than visual interpretation alone. Moreover, complex mathematical procedures are being used to localize and highlight important changes in cardiac function that cannot be visually detected directly from the original images. With the concurrent development of high-performance computers and analytical software, a functional sort of imaging can now evolve, geared toward the creation of physiological images that are the result of a mathematical simulation derived from a set of images. Such functional imaging will allow visualization and understanding of the evolution of any dynamic process of interest (filling, ejection) within the heart. Accordingly, it should allow better insights into cardiac physiology and pathophysiology and may possibly detect warning signs of diseases not yet overt.
This study developed innovative dynamic geometric chamber reconstruction models for use in functional imaging analyses of right ventricular (RV) filling dynamics and physiology. With the use of a new volumetric “prism method,” it is first shown that the geometric chamber reconstructions provide accurate and reliable dynamic instantaneous RV chamber geometry and volumes throughout the cardiac cycle. The method is then applied to functional imaging of the early RV inflow field under normal and experimental volume overload conditions.
METHODS
As depicted in Fig. 1, there are three major phases to our image-based, dynamic blood flow simulation. The input is the real-time, 3-D echocardiographic (RT3D) images of the heart, including the RV chamber. The segmentation phase takes this imaging data and extracts the RV chamber border. The output of the segmentation phase is successive geometric snapshots of the RV chamber boundary. The second phase, geometric reconstruction and wall motion analysis, takes as input these snapshots through the cardiac cycle and computes the 3-D motion of the endocardial boundary. The final phase, computational fluid dynamics (CFD) simulation, applies boundary conditions from the endocardial border motion data to a finite element method (FEM)-based fluid dynamics software. The output is the full 3-D field of intra-ventricular blood flow.
Fig. 1.
Flowchart of the functional imaging method. Input to the algorithm is a series of real-time, three-dimensional (3-D) echocardiography (RT3D) images of the right ventricular (RV) chamber, and the output is the corresponding blood flow velocity field in the right ventricle. CFD, computational fluid dynamics.
Experimental animals and instrumentation
RT3D images of the right ventricle were obtained on seven awake, large (23–30 kg) adult dogs of either sex, chronically instrumented with sonomicrometric crystals for volume measurements using the shell subtraction (SSM) model (6, 7, 14, 22, 25) both under control conditions and during subacute, surgically induced (chordal rupture) volume overload. Cardiac chamber casts were obtained in another eight dogs of comparable size and characteristics at the end of unrelated surgical experiments. All procedures and animal care were in accordance with institutional guidelines, conforming to the “Position of the American Heart Association on Research Animal Use,” American Heart Association, November 11, 1984.
The physiological characteristics, tricuspid chordal rupture procedure, and instrumentation for sonomicrometric data acquisition have been recently published (2, 22, 23, 25). The cardiac period was 0.550 ± 0.012 s (means ± SD) at control and 0.530 ± 0.014 s in the volume overload condition. In brief, the right external jugular vein was exposed with the animal under local anesthesia with 1% lidocaine, and an 8-Fr 25-cm introducer sheath was positioned into the right ventricle under fluoroscopy. A 6-Fr urological biopsy forceps (Circon Instruments; Santa Barbara, CA) was inserted into the right ventricle via the sheath, and multiple passes were taken to sever chordae until 3–4+ regurgitation developed (2, 22, 23, 25). Regurgitation was such as to yield both complete contrast medium filling of the atrium within several cycles and an elevation of peak right atrial pressures (v wave) to over 15 mmHg with obliteration of the x–y descent. Imaging data were collected between the second and third weeks after chordal rupture.
Real-time 3-D echocardiography
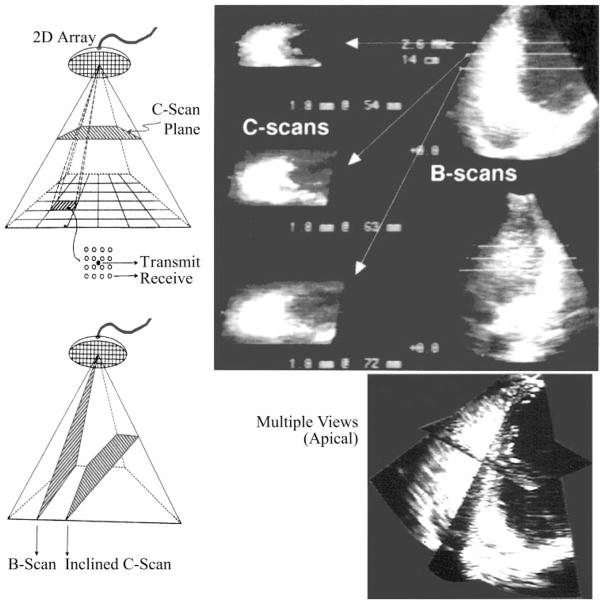
RV images were obtained by a Volumetrics (Volumetrics; Durham, NC) phased-array RT3D ultrasound scanner (16, 26, 28). With the use of the stored image data, endocardial border detection systems extract and compute the coordinates of points constituting the RV endocardial borders (16, 26, 28, 29). The scanner was initially set to the multiple-scanning mode, enabling observation of images on two mutually orthogonal B-mode scans as well as several parallel horizontal C-scan planes (Fig. 2). The maximum depth of scanning was set at either 12 or 14 cm, depending on thoracic size and geometry. At these settings, framing rate was either 21.9 or 19.3 frames/s, axial resolution 1–1.5 mm, and lateral resolution was 1.5–2 mm.
Fig. 2.
RT3D imaging illustrating B-mode and C-mode simultaneous views within the subpyramidal scanned volume. Stop-frame contemporaneous RV images are shown after intraluminal contrast medium injection for endocardial border enhancement before image segmentation.
With the dog at left decubitus, the scanning probe was positioned at the point of maximal impulse. The probe pointed from lower left to upper right into the thorax and an apical four-chamber view was first obtained. The central axis of the scan was initially aligned with the line connecting the apex and the mitral valve. It was then shifted in parallel until it passed through the tricuspid valve. Once the right ventricle was maximally visualized, recording loops lasting between 1.5 and 2.5 s were captured and stored in memory. The number of instantaneous RV chamber images included in any loop varied from 29 to 50, encompassing two-five complete cycles.
The loops were immediately replayed to ensure image quality. Once satisfactory loops were acquired, after intravenous contrast injection of an agitated air microbubble mixture in bacteriostatic saline (16), the positions of RV apex and tricuspid valve along the scanning axis were recorded. The positions of the mutually orthogonal B-mode scans and of the successive short-axis C scans were similarily recorded. These landmarks served as important references during endocardial border detection.
Endocardial border detection and RV chamber geometry
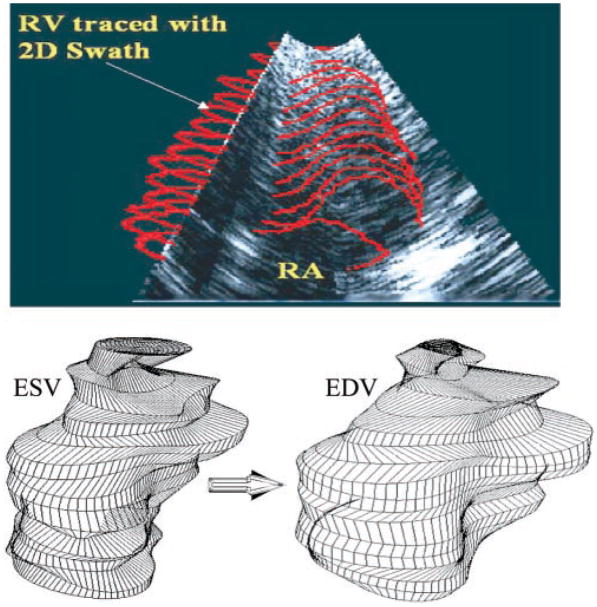
The imaging data stored on a 1.2-GB magneto-optical disk (Sony Electronics; Montvale, NJ) were first transferred into the local memory of a Silicon Graphics Reality Engine (Silicon Graphics; Mountain View, CA) at the Imaging and Visualization Facility of the Duke Center for Emerging Cardiovascular Technologies. The data were read by interactive endocardial border detection software (16, 26, 28, 29), which displayed the echocardiographic RV volumes individually. The software displays all horizontal cross sections in an apex-to-base order, along with the two mutually orthogonal B-mode images. With the use of the reference record taken during the experiment, the cross sections at the levels of the tricuspid valve and apex were first determined. A semiautomated interactive computer module then located the endocardial border. The putative border is represented by a moving stack of contours in a set of two-dimensional (2-D) slices. An operator initiates the moving endocardial border stack by entering a rough initial contour on a single slice. This contour then adapts automatically to the endocardial border using the “2-D swath” algorithm (16, 26, 28, 29). The swath algorithm follows the moving endocardial border through all the slices of the frame (Fig. 3, top), as well as successive time frames. Each contour in the moving stack was converted to its elliptical Fourier series allowing for evenly spaced endocardial border coordinates. The elliptical Fourier series is useful in representing cardiac shapes and in automated methods for finding boundaries (27, 29). These representations provide a frequency-based decomposition of an object and describe its overall shape efficiently using relatively few harmonic coefficients.
Fig. 3.
Top: RV endocardial border of each C-mode slice is traced manually as a closed loop representing an initial guess. Two-dimensional (2-D) “swath” border detection algorithm then adjusts the initial guess so that the border falls on the “most likely position” and allows visualization of the stack of 2-D contours of each RT3D frame using the B-mode, as pictured. Bottom: representative end-systolic (ESV) and end-diastolic (EDV) RV chamber reconstructions.
With the use of a desired number of harmonics, evenly spaced, smoothed endocardial points were regenerated from the Fourier transformations. The individual points were converted into 3-D Cartesian coordinates and stored in a file. Each such file is a four-dimensional matrix, which constitutes the imaged endocardial borders of a beating right ventricle at 50-ms intervals throughout one cardiac cycle. Representative end-systolic and end-diastolic RV chamber reconstructions are given in Fig. 3, bottom. They are comparable with RV chamber views from 3-D visualization of magnetic resonance images (cf. Fig. 4 in Ref. 30). To obtain diastolic inflow field simulation time steps of 2.5 ms, it was necessary to approximate RV geometry at time instants between the successive RT3D images. Under steady-state conditions, RV geometry was calculated at these intermediate times as a quadratic weighted average of the dynamic geometry in contiguous RT3D frames (APPENDIX).
Echocardiographic RV instantaneous chamber volume adjustment
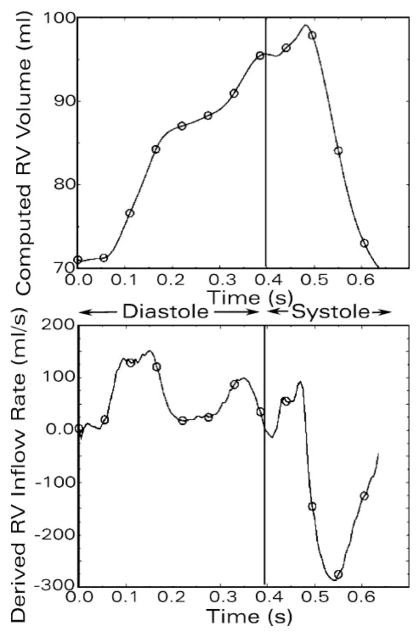
The RV chamber volume was also calculated from the instantaneous sonomicrometric dimensions by the standard SSM formulas (6, 7, 14, 22, 25). The volumetric inflow rate through the tricuspid orifice was obtained digitally as the time derivative of the RV chamber volume by using the central difference method. The calculated rate of volume change over time (dV/dt) signal was smoothed using the first 20 harmonics of its Fourier decomposition, and tricuspid inflow rate values were sampled at 800 Hz; representative tracings of RV chamber volume and its time derivative signal obtained in this way are presented in Fig. 4. These values were used for adjusting the instantaneous volume and velocity boundary conditions in the CFD simulations of the RV diastolic flow field, as needed, according to the following scheme.
Fig. 4.
Continuous tracings of instantaneous RV chamber volume (top) by shell subtraction model (SSM) using sonomicrometric measurements, and its digitally obtained time derivative signal (bottom), (continuous lines). These instantaneous values were used for adjusting the RT3D-derived volume and velocity boundary conditions in successive 2.5-ms intervals before their use in the CFD simulations of the RV diastolic flow field. Representative adjusted points corresponding to the original RT3D data, and the associated rate of volume change (dV/dt) values are superposed (open circles) on the SSM-derived tracings of RV chamber volume and its time derivative.
To satisfy the conditions of mass conservation and incompressibility of blood, the following equation must be satisfied
where, Vi and Vi+1 are the mesh volumes at instants i and i+1, Δt is the time increment (2.5 ms) between these two instants, and dV/dt is the rate of change of volume at t + 1.25 ms.
For RT3D-derived meshes of which the instantaneous volume differed from that calculated using the previous equation, a uniform expansion/contraction method was applied to obtain a new mesh with the desired volume while preserving the geometric similarity. For an arbitrary boundary point (x0, y0, z0) in the original mesh, the coordinates of its corresponding point (x, y, z) in the adjusted mesh were
where the subscript c denotes the “pseudocenter” of each endocardial contour defined by the means of x- and y-coordinates of its points.
Results of this procedure for echocardiographic RV instantaneous chamber volume adjustment are illustrated in Fig. 4, in which the adjusted volume points corresponding to the original RT3D data, and the associated dV/dt values are superposed on the SSM-derived tracings of RV chamber volume and its time derivative.
Validation of RV chamber geometric reconstruction
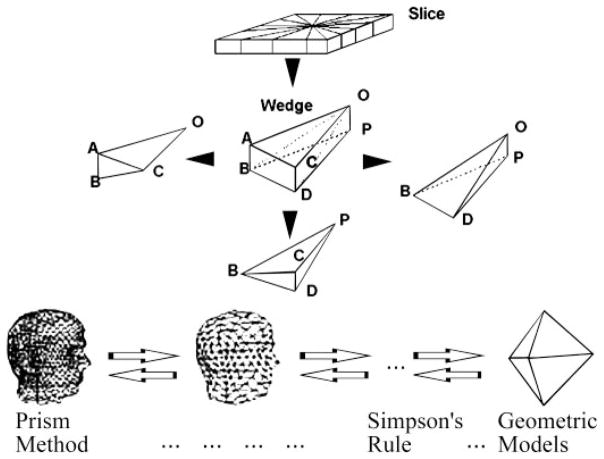
To validate the geometric representation of the RV chamber, a volumetric approach was applied. Dynamic noninvasive RV volumes obtained by RT3D were compared with simultaneously determined sonomicrometric ones by using SSM in the chronically instrumented awake dogs under control and volume overload conditions. To calculate the chamber volume enclosed by the endocardial border, a volumetric “prism method” was developed, which represents a simple adaptation of the Archimedean method of exhaustion for computing areas and volumes of various geometric objects (11). Advantages of the prism method are that its individual steps can be easily automated, and, unlike “disk summation” using Simpson’s or other integral algorithms, the vertices of the tetrahedral tessellation can accurately follow endocardial surface details corresponding to local “features” (Fig. 5, bottom), such as papillary muscles. The primary steps are shown graphically in Fig. 5 and include the following: 1) Connect the corresponding points of adjacent layers, forming a slice. 2) With the use of the “pseudocenters” defined by the means of the x- and y-coordinates separately for the points of the top and bottom layers, divide each slice into n wedges, where n is the number of points within each layer. 3) Decompose each wedge into three tetrahedra in the manner illustrated in Fig. 5. 4) For an arbitrary tetrahedron with vertices O, A, B, and C, calculate its volume using the scalar triple product
Fig. 5.
Schematic diagram illustrating the volumetric prism method. Algorithm is an adaptation of the Archimedean “method of exhaustion” for computing volumes of various geometric objects. Unlike abstract geometric solids and “disk summation” using Simpson’s or other integral algorithms, the vertices of the tetrahedral tessellation can accurately follow endocardial surface details corresponding to local “features” (bottom).
5) Obtain the volume of each wedge as the sum of the volumes of its three tetrahedra, that of each slice by summing its wedges, and that of the RV chamber by summing all slices.
RV chamber cast measurements
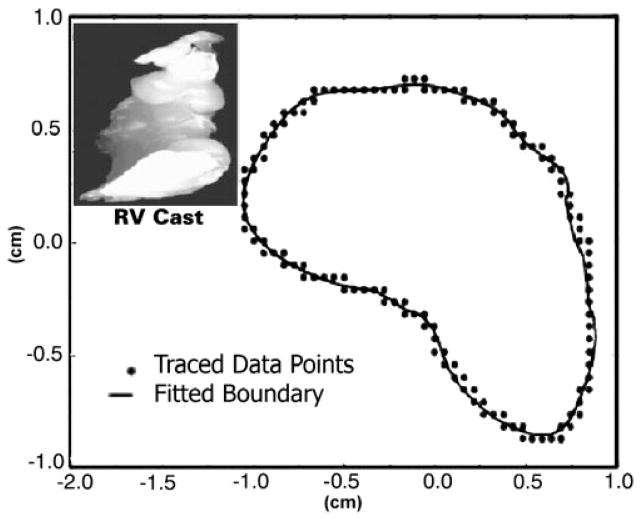
The volumetric “prism method” was itself validated first on RV chamber casts. At the end of unrelated surgical experiments, eight dogs (comparable in size and characteristics to the chronically instrumented animals) were euthanized with intravenous KCl (1 to 2 mmol/kg) to result in diastolic cardiac arrest. The heart was quickly excised with the stumps of the great vessels. After being thoroughly cleaned, cardiac chamber casts were immediately prepared under physiological diastolic hydrostatic loading. Left and right ventricles, in that order, were filled with molten paraffin retrogradely through the aorta and pulmonary artery. Paraffins with a low melting point (115°F) were employed to minimize heat introduction. Once set, the casts were removed, and surface points corresponding to endocardial landmarks were noted. A representative RV cast is shown in Fig. 6, inset.
Fig. 6.
2-D Fourier series curve fit of the traced endocardial points (x- and y-coordinates) of a representative RV cast layer. Fourier series representation allows for a uniform number of data points in each successive layer and smoothes the boundary. Smoothing reduces noise inherent in the data collection and tracing process. Inset: typical RV cast.
The volume of each RV chamber cast was measured by direct water displacement, and the mean of three independent measurements was recorded. A 2-D digitization technique was used to obtain the endocardial border coordinates for each cast. First, a z-axis was established corresponding to a line extending from the apex to base. The casts were then mechanically sectioned into 1- to 5-mm thick sections perpendicular to the z-axis. These sections, with their z-coordinates recorded, were subjected to individual 2-D analysis. Reference markings were applied to each cast to ensure proper section alignment. Each section was photographed, and the images were filtered and enlarged (200%) to optimize outline digitization by using a Summagraphics digitizing tablet (Summagraphics; Seymour, CT) and SigmaScan software (HALLoGRAM Pub; Aurora, CO). With these digitized data as input, custom software then reconstructed the successive planar arrays of x- and y-coordinates for ascending z-axis values.
Statistical comparisons
Bland and Altman’s (4, 5) approach was applied to assess the agreement between measurement modes. The mean of the methods is treated as the best estimate of true value (4). Alternate methods were visually compared for agreement, any bias due to systematic error, and to spot any possible relationship between imprecision and chamber size. ANOVA and standard statistical analyses were performed by using SAS (SAS; Cary, NC) and Statgraphics Plus (Manugistics Group; Rockville, MD).
Functional imaging
With the use of the prism model with RT3D data, RV chamber dynamic geometry and boundary conditions (RV endocardial velocities) were obtained for solution of the Navier-Stokes equations (8–10, 18, 19) in CFD simulations of RV filling characteristics. Blood was assumed to be a Newtonian, incompressible fluid with a kinematic viscosity of 0.04 Stokes and mass density of 1.05 g/cm3. We used a combination of custom software and FIDAP (Fluid Dynamics International; Evanston, IL). FIDAP is a general-purpose computer program that uses FEM to simulate fluid flows (9, 10). In FEM the flow domain represented by the filling RV chamber is tessellated into small “finite elements,” forming a mesh (8). The definition of the elements is accomplished by identifying the locations of the element corners in space. These identified points are called “nodes.” The partial differential Navier-Stokes equations covering the flow domain as a whole are replaced by ordinary differential equations for the unsteady flow analyses at hand. The resulting system of equations has matrix coefficients that are derived by approximating the continuum equations on each element (8–10). The boundary condition assigned to each external nodal point was the time-dependent velocity vector describing the direction of instantaneous motion of the nodal point (see Fig. 9, top). This nonlinear system of equations was solved by numerical techniques to determine velocity distributions at each node in every element throughout the “discretized” (8) flow field.
Fig. 9.
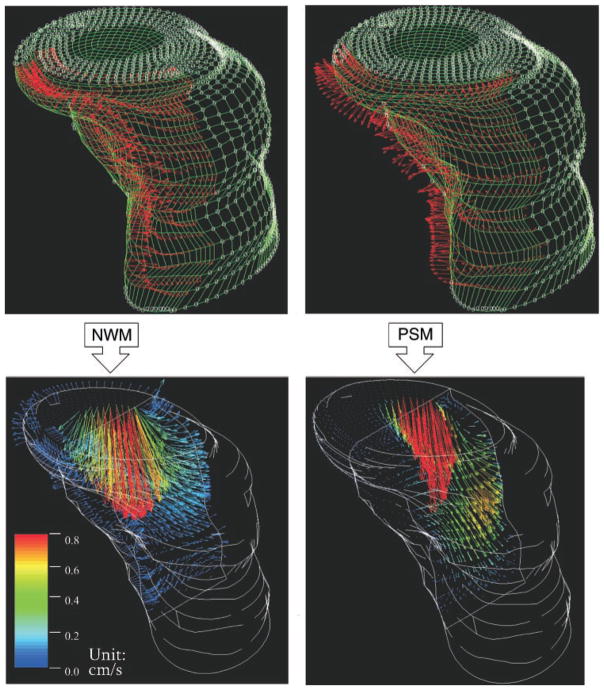
Functional imaging of commencing RV inflow using RT3D imaging data, under normal wall motion (NWM) conditions and during volume overload with paradoxic diastolic septal motion (PSM). Top: external (endocardial) surface nodes of instantaneous computational meshes and application of boundary conditions (red velocity vectors on endocardial surface nodes). Only velocity vectors on the septal border of each RV mesh are shown to avoid clutter. Septal nodal velocity vectors (red) point toward RV chamber and free wall in the normal case but toward the left ventricle with PSM. Bottom: median sagittal (anteroposterior) plane “cuts” of the resulting velocity fields at the very start (≈10 ms from onset) of the E-wave. With NWM there is blood flow toward the free wall in the septal region, whereas with PSM there is very little blood flow in that region. Note the different velocity profiles at the tricuspid orifice, and the abrupt transition (deceleration) from red-yellow-green to black in the dilated chamber (PSM) compared with the more gradual transition through blue hues in the normal.
FIDAP performed the numerical computations involved in solving the Navier-Stokes equations governing the evolution of the flow field. Numerical simulations were carried out using the CRAY T90 supercomputer running FIDAP on the UNICOS operating system (Cray; Mendota Heights, MN) at the North Carolina Supercomputing Center (Research Triangle Park, NC).
RESULTS
Validation on casts of RV geometric reconstruction and volumetric prism method
Fixing the number of layers along the z-axis of each RV chamber cast to 25, we first assessed the impact of varying the number of Fourier harmonics representing the endocardial border of a 2-D layer on the accuracy of the geometric reconstruction for the 3-D chamber. Each layer was fitted with 3, 5, 7, and 10 harmonics. A representative fit using 7 harmonics is shown in Fig. 6. ANOVA showed no significant difference among the volumes measured (F = 0.01, P = 0.99). When the linear model was used for calibrating each prism method calculation against direct water displacement, on the basis of standar error of estimate (SEE) and root mean square (RMS) error of the residuals, the best fit was obtained using five harmonics.
A possible relationship between the number of successive 2-D layers interpolated along the z-axis, and the accuracy of the geometric reconstruction was then explored. Each layer was represented using five harmonics. Accuracy tests were performed for 10, 15, 25, 35, and 50 layers along the z-axis. The volumes of all eight RV casts obtained by the prism method for each of these numbers of z-axis layers were compared with the volumes obtained by water displacement. Again, ANOVA showed no significant difference between the six sets (viz., the computed 10, 15, 25, 35, and 50 axial layer volumes and direct water displacement), and linear calibrations versus water displacement showed no significant differences in SEE and RMS error.
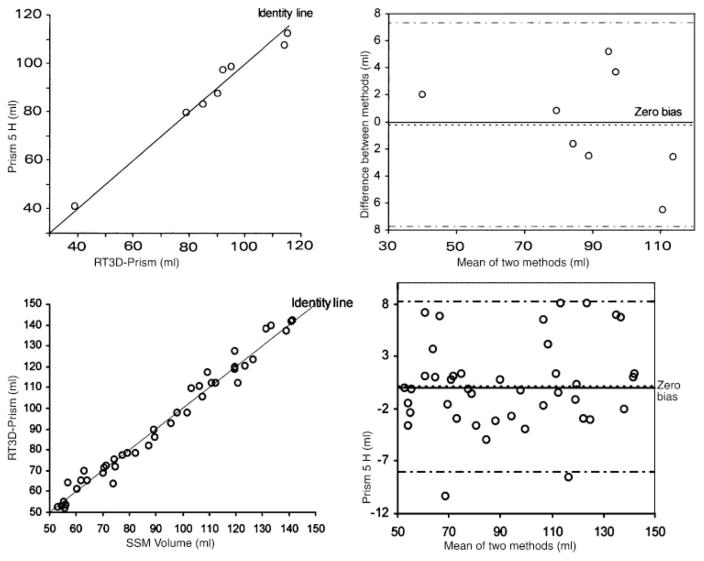
The agreement between the prism method, using the first 5 harmonics for 2-D smoothing and 25 z-axis layers, and water displacement was examined by the method of Bland and Altman (4, 5). As shown in Fig. 7, the measurement points follow the identity line very closely (top left). The difference plot (Fig. 7, top right) shows the variance of the observations to be small and constant across the sampling range and the lack of bias or systematic error in the prism calculations. The bias was −0.19%, so on average volumes of the RV geometric reconstructions were −0.19% lower than the direct measurements of cast volume by water displacement.
Fig. 7.
Top: Bland-Altman plots demonstrating agreement between volumes obtained by the prism method (left) on geometric reconstructions of RV chamber casts and direct water displacement. Note closeness of data points to the identity line and the near-zero bias and narrow 95% confidence interval bounds (right). Bottom: Bland-Altman plots showing close agreement between the dynamic RV chamber volumes (prism method) reconstructed using RT3D data and the SSM volumes in awake dogs (pooled control and volume overload data) (left). Note closeness of data points to the identity line and the near-zero bias with tight 95% confidence intervals (right).
Volumetric validation of the dynamic RV chamber geometric reconstruction in conscious dogs
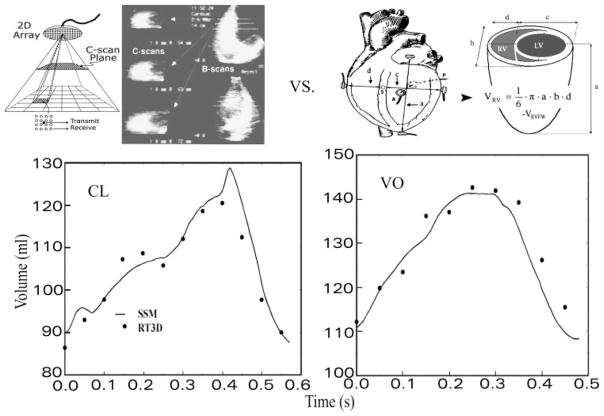
The panel labeled as CL in Fig. 8 shows a representative comparison of instantaneous RV chamber volumes obtained in an awake chronically instrumented dog heart by using SSM with simultaneous volumes calculated by applying the prism method to the RT3D imaging data under the control condition. The panel labeled VO is similar but under volume overload, which produced considerable increases in operating RV chamber volume levels.
Fig. 8.
RV instantaneous volumes calculated noninvasively by the prism model for chamber geometric reconstructions using RT3D serial chamber reconstructions (top left) agree closely with those using the SSM under control conditions (CL) and chronic volume overload (VO) (bottom). Also shown are instrumentation and measurements needed for application of the SSM (top right); VRVFW is the RV free wall volume determined by water displacement during autopsy.
A comparison of the instantaneous RV volumes using SSM with those computed by the prism method from the RT3D imaging reconstructions was performed by using pooled data from four dogs under control and volume overload. The experimental determinations involved in validating RT3D volumes against simultaneous sonomicrometric volumes using SSM are exceedingly complex and resource demanding, both in the stage of the simultaneous data acquisition in the animal lab and in their computational phase. These four out of the seven dogs were examined in the validation studies because they exhibited diastolic paradoxical septal motion (PSM) and thus afforded a more severe test, while providing more than ample data points for a thorough comparison. Figure 7, bottom, illustrates the agreement between the prism method using RT3D data and SSM. Notable on the left panel of Fig. 7 is how closely the measurement points follow the identity line. The difference plot similarly shows the variance of the observations to be small and constant across the entire volume range and lack of bias of the prism method compared with SSM. The bias was 0.18 ml; RV chamber reconstructions from noninvasive RT3D data had volumes 0.18 ml (0.2%) higher on average than corresponding SSM measurements.
Functional imaging results
Figure 9 shows representative functional imaging results (comparative fluid dynamics) of the commencing diastolic RV inflow field. Simulations of the RV inflow field in its earliest stages were performed on all seven animals under control and volume overload conditions. Simulation data shown in Fig. 9, left, exemplify normal conditions, in which the septum moves toward the RV free wall, and those on the right diastolic PSM, in which the septum moves toward the left ventricle. The flow fields are illustrated at instants just after the onset of the upstroke of the E wave at which the average inflow velocities were comparable.
Major differences between the two simulations were the direction of the interventricular septal motion, as is shown in Fig. 9, top, and the magnitude of RV free wall velocity. Accordingly, the early inflow field with normal wall motion exhibits blood velocities toward the free wall in the septal region, whereas with diastolic paradoxical septal motion no flow is seen in this region. Compared with normal wall motion, wall motion abnormalities yield conspicuously different velocity profiles at the tricuspid anulus. In both cases, the highest velocities are concentrated in the vicinity of the inflow orifice. The magnitude of blood velocities below the inflow orifice falls off more gradually in the normal case, as reflected in the step-by-step transition in blue color hues of the velocity vectors; the blue hues light up a large area of the “cut.” In the volume-overloaded ventricle, the transition from higher (red/yellow) through low (blue) flow velocities is abrupt; most of the “cut” beyond the immediate vicinity of the orifice is black.
DISCUSSION
Our goal was to couple noninvasive digital imaging technology with innovative computer modeling and simulation techniques to contribute to the development of a fluid dynamic functional imaging approach to the study of intracardiac flow patterns and pathophysiology. Modeling is the geometric counterpart to simulation in that the goal is not to describe function but to quantitatively capture dynamic chamber anatomy in space and time. From the locations of endocardial border points in space, modeling defines connections between these points to derive instantaneous tessellated RV chamber surfaces and volumes. Our dynamic reconstruction approach defines RV chamber anatomy by means of discrete points joined to form polygonal tessellating elements such as tetrahedra. There is a natural synergy between modeling and simulations in that the CFD simulations require a geometric description of the flow domain for which the discretized FEM mesh is generated.
Physiological simulation is the quantitative description of biophysical behavior in terms of mathematical equations. The reasons for performing CFD simulations include our desire to visualize cardiac fluid dynamic function, leading to improved utilization of information available in contemporary and emerging new diagnostic imaging modalities, and as a tool to investigate conditions that are difficult or even impossible to create experimentally.
Results from the present volumetric animal study show that, using RT3D imaging, our RV chamber geometric reconstruction method computes dynamic RV volumes throughout the cardiac cycle, which agree closely with those by SSM, both under control and volume overload conditions. The accuracy of the invasive SSM in normal and volume-overloaded canine hearts has been verified in previous publications from our laboratory (6, 7). In addition, the prism method was shown on casts to compute RV chamber volumes that closely coincide to those by water displacement.
Prism volumetric method
The dynamic RV reconstruction scheme was shown to be accurate by using the prism method. In common with other volumetric methods (13, 15, 17) based on geometric reconstruction of images, the prism method places no geometric assumption on the chamber whose volume is to be measured. It can be used with other noninvasive digital imaging modalities, including magnetic resonance and computed tomography scanning, in addition to 3-D echocardiography.
Advantages of the prism method are that its individual steps can be easily automated and, unlike “disk summation” using Simpson’s or other integral algorithms, the vertices of the tetrahedral tessellation can accurately follow endocardial surface details corresponding to local “features” (Fig. 5), such as papillary muscles. Because it remains difficult to extract the RV chamber directly by automated endocardial border recognition from RT3D frames, we currently feel it is more appropriate to segment the chamber slice by slice, isolating the endocardium, and then tessellate the surface from the layered 2-D contour stack. On the basis of our results, it is recommended to use five to seven harmonic 2-D layer Fourier representations and no more than 25 z-axis layers. This represents the best balance between the tightness of fit of each 2-D layer, the smoothness of each regenerated layer, and the accuracy of the geometric reconstruction.
With continuing advances in spatiotemporal resolution and accuracy of imaging technologies, however, it should become possible to extract the chamber automatically and then obtain the Fourier transform to the volume image (constructed of voxels instead of pixels) in the 3-D frequency space directly.
Functional imaging of RV inflow with normal wall motion and PSM
Our method can analyze intraventricular blood flow patterns in any individual heart because it drives the CFD simulations using actual RV chamber dynamic geometric reconstruction and wall motion as boundary conditions. The comparative fluid dynamics of the commencing diastolic RV inflow field with normal wall motion (NWM) and with diastolic paradoxical septal motion, shown in Fig. 9, are interesting. The PSM case exhibits a flow field that is qualitatively different from that of NWM: with NWM there is blood flow toward the free wall in the septal region, whereas with PSM there is very little blood flow in that region. Compared with normal, wall motion abnormalities yield conspicuously different velocity profiles at the tricuspid anulus. This result suggests that presence of diastolic wall motion abnormalities may be detected by clinical Doppler evaluation of diastolic inflow velocity profiles in the earliest stage of diastolic inflow. At that stage the flow field is irrotational (8, 18–21). From the fluid dynamic standpoint, irrotational flow patterns in regions such as the ventricular chamber (“simply connected”) are exclusively dependent on the instantaneous velocity of the boundary. Alternatively, different patterns of motion by the endocardial surface (including interventricular septum) are transmitted instantaneously throughout the flow field, including at the tricuspid orifice.
In both cases, highest velocities are concentrated in the vicinity of the inflow orifice. This reflects the strong convective deceleration ensuing as blood moves from the orifice to the periphery of the chamber. It is analogous and exactly the converse of the strong convective acceleration of the intraventricular ejection flow in the immediate vicinity of the outflow orifice, which has previously been demonstrated in cardiac catheterization and CFD studies (3, 8–10, 18–21).
Because the RV endocardial surface area is much larger than the tricuspid orifice area (endocardial surface/orifice area ≥10), blood entering the irrotational flow field of early diastole experiences convective deceleration (18). The magnitude of blood velocities below the inflow orifice falls off more gradually in the normal case reflecting a lower convective deceleration than in the volume-overloaded ventricle with diastolic paradoxical septal motion, where the transition from higher to lower flow velocities is abrupt. The larger the end-systolic size of the chamber relative to the inflow valve anulus, the higher is the diastolic convective deceleration. This reveals a subtle but important influence on filling dynamics of an “inflow, or diastolic, ventriculoannular disproportion,” ensuing with chamber dilatation in volume overload. The concept is the counterpart of the “outflow, or systolic ventriculoannular disproportion,” introduced and elaborated in earlier publications (8, 10, 18, 19).
In conclusion, a novel functional imaging approach has been developed for the investigation of blood flow patterns in the right ventricle of specific experimental animals (and human subjects) using information derived from RT3D images. The method is independent of imaging modality used, e.g., ultrasound, magnetic resonance, and digital ventriculography. Boundary conditions are directly derived from dynamic endocardial geometry, which allows for the first time an animal-specific ventricular blood flow simulation under normal or abnormal wall motion patterns. It is hoped that the method of combining dynamic modeling of the cardiac chambers throughout the cardiac cycle in combination with computational fluid dynamics will become increasingly valuable for understanding the detailed nature of 3-D flow patterns in the heart. It is likely that improvements in RT3D imaging will allow this type of analysis for all cardiac chambers and in diverse physiological and disease states.
Acknowledgments
This work was supported in part by National Heart, Lung, and Blood Institute Grant R01 HL-50446 (to A. Pasipoularides), the Duke/National Science Foundation Engineering Research Center for Emerging Cardiovascular Technologies, and the North Carolina Super Computing Center/Cray Research (to A. Pasipoularides and M. Shu).
APPENDIX
Under steady-state conditions, RV chamber geometry was interpolated between successive RT3D images as the weighted average of the changing endocardial border outline obtained using RT3D. It was sufficient to obtain the set of Fourier coefficients representing the geometry. For an arbitrary instant t* within a cardiac cycle, a given Fourier coefficient (f*) was calculated using the following algorithm.
Obtain the time intervals between t* and t1, t2, … ,tn, where t1, t2, … ,tn are RT3D frame sampling instants within a steady-state cardiac cycle of length T. Let the time interals be Δt1, Δt2, … ,Δtn, where
Calculate a quadratic weighting factor (di) for RT3D frame at ti as
Calculate total “weight” as
Calculate the normalized weight (wi) of each RT3D frame at ti as
Finally, letting fi be the corresponding Fourier coefficients at instants t1, t2, … ,tn, calculate the desired Fourier coefficient at instant t* using
References
- 1.Axel L. Physics and technology of cardiovascular MR imaging. Cardiol Clin. 1998;16:125–133. doi: 10.1016/s0733-8651(05)70005-9. [DOI] [PubMed] [Google Scholar]
- 2.Bauman RP, Rembert JC, Greenfield JC., Jr Myocardial blood flow in awake dogs with chronic tricuspid regurgitation. Basic Res Cardiol. 1998;93:63–69. doi: 10.1007/s003950050063. [DOI] [PubMed] [Google Scholar]
- 3.Bird JJ, Murgo JP, Pasipoularides A. Fluid dynamics of aortic stenosis: subvalvular gradients without subvalvular obstruction. Circulation. 1982;66:835–840. doi: 10.1161/01.cir.66.4.835. [DOI] [PubMed] [Google Scholar]
- 4.Bland JM, Altman DG. Comparing methods of measurement: why plotting difference against standard method is misleading. Lancet. 1995;346:1085–1087. doi: 10.1016/s0140-6736(95)91748-9. [DOI] [PubMed] [Google Scholar]
- 5.Bland JM, Altman DG. Measuring agreement in method comparison studies. Stat Methods Med Res. 1999;8:135–160. doi: 10.1177/096228029900800204. [DOI] [PubMed] [Google Scholar]
- 6.Feneley MP, Elbeery JR, Gaynor JW, Gall SA, Davis JW, Rankin JS. Ellipsoidal shell subtraction model of right ventricular volume. Comparison with regional free wall dimensions as indexes of right ventricular function. Circ Res. 1990;67:1427–1436. doi: 10.1161/01.res.67.6.1427. [DOI] [PubMed] [Google Scholar]
- 7.Gaynor JW, Feneley MP, Gall SA, Maier GW, Kisslo JA, Davis JW, Rankin JS, Glower DD. Measurement of left ventricular volume in normal and volume-overloaded canine hearts. Am J Physiol Heart Circ Physiol. 1994;266:H329–H3240. doi: 10.1152/ajpheart.1994.266.1.H329. [DOI] [PubMed] [Google Scholar]
- 8.Georgiadis JG, Wang M, Pasipoularides A. Computational fluid dynamics of left ventricular ejection. Ann Biomed Eng. 1992;20:81–97. doi: 10.1007/BF02368507. [DOI] [PubMed] [Google Scholar]
- 9.Hampton TG, Shim Y, Straley CA, Pasipoularides A. Finite element analysis of cardiac ejection dynamics: ultrasonic implications. Adv Eng. 1992;22:371–374. [Google Scholar]
- 10.Hampton TG, Shim Y, Straley CA, Uppal R, Craig D, Glower DD, Smith PK, Pasipoularides A. Finite element analysis of ejection dynamics on the CRAY Y-MP. Comput Cardiol Proc. 1992;19:295–298. [Google Scholar]
- 11.Heath TL. The Works of Archimedes. New York: Dover; pp. 107–109.pp. 176–182. date unknown. [Google Scholar]
- 12.Isaaz K, Pasipoularides A. Noninvasive assessment of intrinsic ventricular load dynamics in dilated cardiomyopathy. J Am Coll Cardiol. 1991;17:112–121. doi: 10.1016/0735-1097(91)90712-i. [DOI] [PubMed] [Google Scholar]
- 13.Jiang L, Handschumacher MD, Hibberd MG, Siu SC, King ME, Weyman AE, Levine RA. Three-dimensional echocardiographic reconstruction of right ventricular volume: in vitro comparison with two-dimensional methods. J Am Soc Echocardiogr. 1994;7:150–158. doi: 10.1016/s0894-7317(14)80120-x. [DOI] [PubMed] [Google Scholar]
- 14.Mirsky I, Pasipoularides A. Elastic properties of normal and hypertrophied cardiac muscle. Fed Proc. 1980;39:156–161. [PubMed] [Google Scholar]
- 15.Munoz R, Marcus E, Palacio G, Gauvreau KK, Wessel DL, Colan SD. Reconstruction of 3-dimensional right ventricular shape and volume from 3 orthogonal planes. J Am Soc Echocardiogr. 2000;13:177–185. doi: 10.1067/mje.2000.103108. [DOI] [PubMed] [Google Scholar]
- 16.Ota T, Fleishman CE, Strub M, Stetten G, Ohazama CJ, von Ramm OT, Kisslo J. Real-time, three-dimensional echocardiography: feasibility of dynamic right ventricular volume measurement with saline contrast. Am Heart J. 1999;137:958–966. doi: 10.1016/s0002-8703(99)70422-9. [DOI] [PubMed] [Google Scholar]
- 17.Papavassiliou DP, Parks WJ, Hopkins KL, Fyfe DA. Three-dimensional echocardiographic measurement of right ventricular volume in children with congenital heart disease validated by magnetic resonance imaging. J Am Soc Echocardiogr. 1998;11:770–777. doi: 10.1016/s0894-7317(98)70051-3. [DOI] [PubMed] [Google Scholar]
- 18.Pasipoularides A. Clinical assessment of ventricular ejection dynamics with and without outflow obstruction. J Am Coll Cardiol. 1990;15:859–882. doi: 10.1016/0735-1097(90)90287-y. [DOI] [PubMed] [Google Scholar]
- 19.Pasipoularides A. Cardiac mechanics: basic and clinical contemporary research. Ann Biomed Eng. 1992;20:3–17. doi: 10.1007/BF02368503. [DOI] [PubMed] [Google Scholar]
- 20.Pasipoularides AD, Murgo JP, Bird JJ, Craig WE. Fluid dynamics of aortic stenosis: mechanisms for the presence of subvalvular pressure gradients. Am J Physiol Heart Circ Physiol. 1984;246:H542–H550. doi: 10.1152/ajpheart.1984.246.4.H542. [DOI] [PubMed] [Google Scholar]
- 21.Pasipoularides A, Murgo JP, Miller JW, Craig WE. Nonobstructive left ventricular ejection pressure gradients in man. Circ Res. 1987;61:220–227. doi: 10.1161/01.res.61.2.220. [DOI] [PubMed] [Google Scholar]
- 22.Pasipoularides AD, Shu M, Shah A, Silvestry S, Glower DD. Right ventricular diastolic function in canine models of pressure overload, volume overload, and ischemia. Am J Physiol Heart Circ Physiol. 2002;283:H2140–H2150. doi: 10.1152/ajpheart.00462.2002. [DOI] [PMC free article] [PubMed] [Google Scholar]
- 23.Pasipoularides AD, Shu M, Shah A, Glower DD. Right ventricular diastolic relaxation in conscious dog models of pressure overload, volume overload and ischemia. J Thorac Cardiov Surg. 2002;124:964–972. doi: 10.1067/mtc.2002.126677. [DOI] [PMC free article] [PubMed] [Google Scholar]
- 24.Ritman EL. State of the art and future perspectives-fast CT for quantitative cardiac analysis. Mayo Clin Proc. 1990;65:1336–1349. doi: 10.1016/s0025-6196(12)62145-4. [DOI] [PubMed] [Google Scholar]
- 25.Shah AS, Atkins BZ, Hata JA, Tai O, Kypson AP, Lilly RE, Koch WJ, Glower DD. Early effects of right ventricular volume overload on ventricular performance and β-adrenergic signaling. J Thorac Cardiovasc Surg. 2000;120:342–349. doi: 10.1067/mtc.2000.107278. [DOI] [PubMed] [Google Scholar]
- 26.Shiota T, Jones M, Chikada M, Fleishman CE, Castellucci JB, Cotter B, DeMaria AN, von Ramm OT, Kisslo J, Ryan T, Sahn DJ. Real-time three-dimensional echocardiography for determining right ventricular stroke volume in an animal model of chronic right ventricular volume overload. Circulation. 1998;97:1897–900. doi: 10.1161/01.cir.97.19.1897. [DOI] [PubMed] [Google Scholar]
- 27.Staib LH, Duncan JS. Boundary finding with parametrically deformable models. IEEE Pattern Anal Mach Intell. 1992;14:1061–1075. [Google Scholar]
- 28.Stetten G, Ota T, Ohazama C, Fleishman C, Castelucci J, Oxaal J, Ryan T, Kisslo J, von Ramm OT. Real-time 3D ultrasound: a new look at the heart. J Cardiovasc Diagn Procedures. 1998;15:73–84. [Google Scholar]
- 29.Stetten GD, Drezek R. Active fourier contour applied to real time 3D ultrasound of the heart. Int J Imag Graph. 2001;1:647–658. [Google Scholar]
- 30.Yim PJ, Ha B, Ferreiro JI, Henry GW, Branch CA, Johnson TA, Lucas CL. Diastolic shape of the right ventricle of the heart. Anat Rec. 1998;250:316–324. doi: 10.1002/(SICI)1097-0185(199803)250:3<316::AID-AR6>3.0.CO;2-Y. [DOI] [PubMed] [Google Scholar]


