

SUMMARY
Salmonella Typhi is the cause of typhoid fever, a major global health concern. An essential virulence factor of this pathogen is typhoid toxin. In contrast to most AB-type toxins, typhoid toxin exclusively expressed by intracellular bacteria. The regulatory networks that ensure this unique gene expression pattern are unknown. Here, we developed FAST-INSeq, a genome-wide screening approach to identify S. Typhi genes required for typhoid toxin expression within infected cells. We find that typhoid toxin expression is controlled by a silencing and counter-silencing mechanism through the opposing actions of the PhoP/PhoQ two-component regulatory system and the histone-like protein H-NS. The screen also identified bacterial mutants that alter the proportion of intracellular S. Typhi that reside within an intravacuolar environment, which was essential for toxin expression. Collectively, these data describe a regulatory mechanism that allows a bacterial pathogen to exclusively express a virulence factor when located within a specific intracellular compartment.
Keywords: Salmonella Typhi pathogenesis, typhoid toxin, gene regulation, intracellular pathogens, PhoP/PhoQ, H-NS
eTOC Blurb
Typhoid toxin, a central Salmonella Typhi virulence factor, is an unusual AB-type toxin in that it is exclusively expressed by intracellular bacteria. Here, Fowler & Galán develop a genetic screen and unveil the regulatory mechanisms that control typhoid toxin intracellular expression. Toxin expression requires bacterial localization within Salmonella containing vacuoles
INTRODUCTION
Salmonella enterica serovar Typhi (S. Typhi) and the related serovar S. Paratyphi cause typhoid fever in humans, a major global public health concern (Dougan and Baker, 2014; Parry et al., 2002) (Crump et al., 2004). An essential virulence factor for both of these typhoidal Salmonella enterica serovars is typhoid toxin, a unique A2B5 toxin that, when administered to experimental animals, can reproduce many of the specific symptoms of typhoid fever (Galan, 2016; Song et al., 2013; Spano et al., 2008). Typhoid toxin has a unique architecture as it is composed of a pentameric (B) subunit, made up of PltB, linked to two enzymatic (A) subunits, the ADP ribosyl transferase PltA and the deoxyribonuclease CdtB (Song et al., 2013). A unique aspect in the biology of typhoid toxin is its exclusive production by intracellularly localized bacteria (Haghjoo and Galan, 2004; Spano et al., 2008). After its synthesis, typhoid toxin is secreted by a specialized protein secretion system into the lumen of the Salmonella-containing vacuole (SCV) (Hodak and Galan, 2013) where it is packaged into vesicle carrier intermediates that transports it to the extracellular space (Chang et al., 2016; Spano et al., 2008). Intoxication of infected cells can only occur via autocrine or paracrine pathways. Toxin targeting to cells and its packaging into vesicle carrier is mediated by its pentameric PltB B subunit, which interacts with specific cell surface or luminal vacuolar glycan receptors (Chang et al., 2016; Deng et al., 2014; Song et al., 2013). These receptors must have N-acetylneuraminic acid (Neu5Ac) as their terminal moiety, a predominant characteristic of human sialoglycans that is in contrast to sialoglyans in most other mammalian species, which are terminated in N-glycolyneuraminic acid (Neu5Gc) (Chang et al., 2016; Deng et al., 2014).
An intriguing corollary of typhoid toxin’s unique biology is that infected cells that do not express extracellular receptors for toxin uptake would be immune to the toxin and thus able to sustain toxin production without their intoxication. This could be particularly relevant during the chronic phase of S. Typhi infection when the toxin’s activity is thought to play an important role (Galan, 2016), a phase critical to its success as a human pathogen (Gonzalez-Escobedo et al., 2011; Gopinath et al., 2012). In this context, the coordination of toxin expression in the intracellular environment with its subsequent packaging into vesicle carrier intermediates must be central to the remarkable biology of this toxin. However, the regulatory mechanisms responsible for this coordination have not been elucidated.
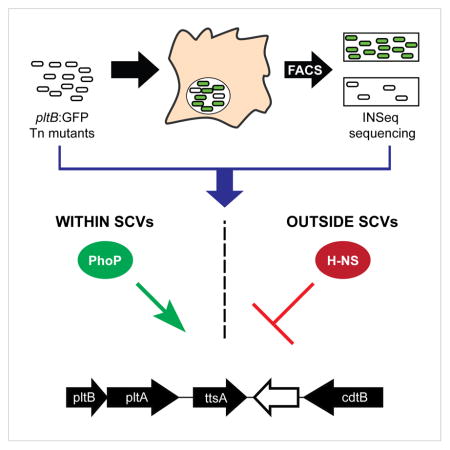
Although it is well established that intracellular bacterial pathogens encode virulence factors that, like typhoid toxin, are uniquely expressed within cells, less is known about the regulatory networks that ensure this pattern of gene expression. Here we report the results of a genetic screen to identify genes required for typhoid toxin gene expression during S. Typhi infection of cultured human cells. Our screen not only identified genes that control typhoid toxin gene expression, but also genes that affect the proportion of bacteria that express the toxin. Our results show that typhoid toxin expression is controlled by a regulatory network involving a silencing and counter-silencing mechanism through the opposing actions of the PhoP/PhoQ two-component regulatory system and the histone-like protein H-NS. Furthermore, we found that toxin expression requires a specific intracellular environment that ensures its packaging into vesicle carrier intermediates.
RESULTS
FAST-INSeq: a method to identify genes required for typhoid toxin expression within infected cells
In order to dissect the regulatory circuit that controls typhoid toxin expression in S. Typhi we developed an approach (fluorescence activated sorting of transposon mutants coupled to insertion site sequencing or FAST-INSeq) to screen for genes necessary for the control of typhoid toxin gene expression within cultured epithelial cells (Figure 1A). To implement this approach we constructed a S. Typhi reporter strain in which the coding sequence of the typhoid toxin subunit pltB was replaced at its native genomic locus by a gene encoding superfolder green fluorescent protein (GFP). To test the behaviour of the reporter strain, we infected cultured epithelial cells and examined the expression of the GFP reporter by a quantitative fluorescence assay. As predicted, expression of the typhoid toxin reporter was not detected when the reporter strain was grown in vitro and was highly induced following infection of cultured Henle-407 human epithelial cells (Haghjoo and Galan, 2004; Spano et al., 2008)(Figure S1A). To gain insight into the proportion of bacteria expressing typhoid toxin, we introduced into the S. Typhi pltB:gfp reporter strain a plasmid that constitutively expresses the red fluorescent protein mCherry (Spano et al., 2011) and determined the number of green (typhoid toxin expressing) and red (all) bacteria in infected cells using flow cytometry. We found that a small (~10%) but significant proportion of bacteria exhibited little to no green fluorescence (Figure 1B) indicating that a subset of intracellular S. Typhi do not express typhoid toxin.
Figure 1. The FAST-INSeq method to identify S. Typhi mutants that affect typhoid toxin expression in infected human cells.

(A) Schematic diagram of the FAST-INSeq method. A random library of INSeq-compatible transposon mutants in the pltB:gfp reporter strain was used to infect Henle-407 cells for 18 hours. Bacteria from infected cells were sorted by FACS and the high and low fluorescence pools were analyzed by INSeq. Schematic of hypothetical results in which the abundance of individual transposon within genes that allow (black arrows) or prevent (red arrows) typhoid toxin expression are depicted. (B) FACS analysis of pltB:gfp in S. Typhi constitutively expressing of mCherry isolated from infected Henle- 407 cells. A histogram is shown depicting the GFP fluorescence intensities of individual bacteria 18 hs post-infection with gates showing the fraction of the population exhibiting high and low levels of GFP. (C) Circular diagram showing the distribution of transposon mutants within the S. Typhi genome in the mutant library. The outer track (black) shows the full S. Typhi genome, the next two tracks (red and blue) show the distribution of genes by DNA strand and the inner track (green) shows the distribution of transposon insertions in the library (inoculum pool) used for the screen. (D) Plot showing the normalized numbers of sequencing reads of transposon insertions within each S. Typhi gene in the inoculum pool versus the post-infection pool. Green and red dots represent genes required for chemotaxis and the function of the SPI-1 T3SS, respectively. See also Figure S1 and Tables S1–S4.
We then generated a library of ~200,000 insertion mutants in the S. Typhi pltB:gfp reporter strain using a mariner transposon modified to be compatible with insertion sequencing (INSeq), a method that enables monitoring the relative abundances of insertion sites in transposon mutant libraries using next-generation DNA sequencing (Gawronski et al., 2009; Goodman et al., 2009; van Opijnen et al., 2009). Henle-407 cells were infected with the pooled S. Typhi pltB:gfp transposon insertion mutant library for 18 hours, at which time the bacteria were recovered from infected cell lysates and sorted using fluorescence activated cell sorting (FACS), an approach that has been previously used to isolate bacterial mutants with a particular gene expression profile (Valdivia and Falkow, 1996; Valdivia and Falkow, 1997). We applied FACS to separate bacteria in which the pltB:gfp reporter was strongly induced (high fluorescence pool), from bacteria showing little or no gfp expression (low fluorescence pool) (Figure S1B). The distribution and abundance of transposon insertion sites in these two pools was then determined using INSeq. The central premise of this approach was that transposon insertions in genes that are important for the intracellular induction of typhoid toxin expression would disrupt pltB:gfp reporter expression and would therefore be over-represented in the low fluorescence pool.
In order to track the mutant population throughout the screen, INSeq was also used to quantify the transposon insertion sites in the full library (inoculum pool) as well as in the pool of mutants recovered from infected cells prior to sorting (post-infection pool). INSeq analysis of the inoculum pool showed the presence of at least two unique insertions within all but 387 of the 4,274 annotated genes of the S. Typhi genome, with an average of ~20 unique insertions per gene totalling ~90,000 independent insertions within coding regions (Figure 1C, Tables S1 and S2). Comparison of the composition of each of the pools across biological replicates indicated that the results were highly reproducible (Figure S1C). To bench-mark our screening protocol, we first compared the mutant population in the inoculum with that of the pool of mutants recovered 18 hours post-infection (hpi) (Figure 1D). We reasoned that this comparison should identify well-characterized genes expected to be necessary for S. Typhi to enter and replicate within mammalian cells. Insertion mutations in a small number of genes were over-represented in the post-infection pool. This group was primarily comprised of genes involved in chemotaxis (Figure 1D, Table S3), which is in agreement with previous reports indicating that S. Typhimurium chemotaxis mutants exhibit a mild hyper-invasive phenotype (Jones et al., 1992). Insertions within a much larger number of genes (~200) were recovered in significantly reduced numbers after infection, indicating a defect in their ability to invade, survive or replicate within cultured cells (Table S4). It is noteworthy that homologs of each of these genes are present in the genome of S. Typhimurium, indicating that the fundamental mechanisms by which typhoidal and non-typhoidal Salmonellae invade epithelial cells are largely conserved despite the disparate virulence properties of these pathogens. As expected, within this group were insertions within genes in the Salmonella pathogenicity island 1 (SPI-1), which encode a type III secretion system (T3SS) that is required by S. Typhi to invade non-phagocytic cells (Galan, 2001; Galán and Curtiss III, 1991) (Figure 1D, Figure S1D). This system mediates bacterial entry by delivering the effector proteins SopE2, and SopB, which redundantly modulate Rho-family GTPase function (Galan, 2001). Furthermore, entry is also enhanced by the activity of the effector protein SipA, which modulates actin polymerization. As predicted by their redundant activities, insertions within sopE2 and sopB did not significantly affect the ability of S. Typhi to invade and replicate within cultured cells. In contrast, insertions within the actin-nucleating effector protein SipA was recovered in significantly lower numbers, which is consistent with its role in bacterial entry (Figure S1D). In addition to the SPI-1 T3SS, insertions within genes associated with other functions such as motility, nucleotide metabolism, LPS biosynthesis and cell envelope maintenance or remodelling were recovered in significantly lower numbers in the post-infection pool compared to the inoculum pool suggesting their direct or indirect involvement in S. Typhi infection, survival or replication within cultured cells. Collectively, these results indicate that our library had very good genome coverage, that our results were highly reproducible between replicates, and provide a proof-of-concept for the encompassing nature of the genetic screen.
Identification of S. Typhi genes that affect typhoid toxin expression within infected human cells
To identify genes involved in the regulation of typhoid toxin gene expression, we used INSeq to compare the distribution and abundance of transposon insertion sites in the low and high fluorescence pools described above (Figure 2A). Our analysis identified 14 genes in which transposon insertions were over-represented in the low fluorescence pool, suggesting that these genes are important for the intracellular induction of typhoid toxin expression. These genes encode transcriptional regulatory proteins (phoP, phoQ, slyA), components of an ABC transporter (yrbD, yrbE and yrbF), a putative flavodoxin of unknown function (yqcA), the SPI-2 T3SS effector sifA, the magnesium transporter mgtA, as well as genes required for purine biosynthesis (purL, purF, purC, purM and purH) (Table 1). To validate these findings, we generated S. Typhi isogenic mutant strains carrying deletions of each of the genes or pathways identified by the screen and examined the expression of pltB following infection of Henle-407 cells (Figure 2B). Deletions of slyA and the phoP-phoQ locus led to severely reduced pltB reporter expression compared to wild type, indicating that these genes are important for the control of typhoid toxin gene expression. In contrast, deletion of the remaining genes identified in our screen had little or no effect on pltB:lacZ expression levels during infection (Figure 2B). Given that our analysis determined that induction of typhoid toxin gene expression is not uniform and that a population of S. Typhi does not express the toxin genes during infection (Figure 1B), we reasoned that some of these genes might alter the proportion of bacteria expressing typhoid toxin, which would not necessarily be evident when analyzing the average levels of gene expression in the entire population of mutant bacteria recovered from infected cells. To test this hypothesis we examined by flow cytometry the proportion of typhoid toxin expressing bacteria in S. Typhi mutant strains expressing the pltB:gfp reporter and mCherry under a constitutive promoter (Figure 2C). We found that as expected, pltB:gfp expression was not detectable above background in the ΔphoP-phoQ mutant strain. In the ΔslyA mutant strain, the fraction of S. Typhi that expressed the toxin reporter was similar to wild type, but the population that expressed the toxin exhibited an ~10-fold reduction in GFP levels compared to wild type. This phenotype suggested that slyA is not important for determining whether or not typhoid toxin is expressed, but is important for achieving high levels of induction in toxin-expressing S. Typhi. In contrast, we found that the ΔyrbE mutation resulted a substantial increase in the fraction of S. Typhi that did not express the typhoid toxin reporter during infection compared to wild type. Importantly, however, the GFP levels observed for the toxin-expressing population were indistinguishable from wild type. These results indicate that our screen identified mutants that result in decreased levels of typhoid toxin expression as well as mutants that affect the proportion of S. Typhi that express the toxin genes during infection.
Figure 2. Identification of S. Typhi genes that affect typhoid toxin expression in infected cells.

(A) Plot showing the normalized numbers of sequencing reads of transposon insertions within each S. Typhi gene in the high fluorescence vs. the low fluorescence pools. Open and black circles represent genes required for biotin biosynthesis or that were over-represented in the low fluorescence pool, respectively. (B) Expression of the pltB::lacZ reporter in wild-type (WT) S. Typhi and the indicated isogenic mutant strains. The levels of β-galactosidase activity in the inoculum and in bacteria isolated from infected cells were normalized by the number of CFU. Values represent the mean +/− standard deviation for three independent determinations. Asterisks indicate statistically significant differences from the wild-type control (** p<0.001, * p<0.05, n.s.s. not statistically significant). (C) FACS analysis of typhoid toxin expression of the indicated S. Typhi strains 18 hs post-infection. Histograms show the GFP fluorescence intensities of individual bacteria with gates showing high and low fluorescence populations. Data for the wild type sample, also shown in Figure 1B, is presented again for clarity. See also Figures S2 and S6 and Table S5.
Table 1.
Genes identified by FAST-INSeq as important for typhoid toxin expression in infected human cells
| Gene | h. f. Insertions | h. f. reads | l. f. Insertions | l. f. reads | Ratioa |
|---|---|---|---|---|---|
| Gene regulation | |||||
| PhoP | 2 | 4 | 12 | 358 | >50 |
| PhoQ | 5 | 22 | 33 | 1246 | >50 |
| SlyA | 2 | 18 | 4 | 135 | ~8 |
| Purine biosynthesis | |||||
| PurF | 20 | 189 | 22 | 1814 | ~10 |
| PurH | 17 | 253 | 19 | 1766 | ~7 |
| Purl | 35 | 478 | 29 | 1644 | ~3 |
| PurC | 12 | 134 | 10 | 445 | ~3 |
| PurM | 16 | 151 | 13 | 483 | ~3 |
| YrbDEF transporter | |||||
| YrbE | 10 | 52 | 5 | 340 | ~7 |
| YrbF | 10 | 101 | 5 | 410 | ~4 |
| YrbD | 17 | 214 | 10 | 677 | ~3 |
| Other | |||||
| YqcA | 7 | 87 | 4 | 555 | ~6 |
| SifA | 14 | 129 | 6 | 581 | ~5 |
| MgtA | 13 | 51 | 8 | 237 | ~5 |
Ratio of normalized INSeq sequencing reads from transposon insertions within the indicated gene in the low fluorescence (l. f) pool compared to the high fluorescence (h. f.) pool.
The FAST-INSeq screen also identified several mutants that were under-represented in the low fluorescence pool compared to the high fluorescence pool, suggesting that these mutants might promote typhoid toxin expression (Figure 2A, Table S5). The strongest such phenotypes were observed for the five genes encoding enzymes required for the biosynthesis of biotin, an enzyme co-factor that is required for the synthesis of fatty acids (Streit and Entcheva, 2003). While transposon insertions in each of these genes were very well represented in the high fluorescence pool, they were essentially absent from the low fluorescence pool, suggesting that disruption of biotin biosynthesis significantly affects the population of S. Typhi that does not express the toxin genes during infection (Table S5, Figure 2A). To verify this observation, we introduced a ΔbioB mutation into the S. Typhi pltB:gfp reporter strain and examined typhoid toxin expression at the single bacterium level following infection using flow cytometry. Consistent with the results of the screen, we found that the population of bacteria that do not express pltB:gfp during infection was essentially absent in the ΔbioB mutant (Figure 2C). However, the ΔbioB mutant did not affect the fluorescence intensity of the toxin-expressing population, nor did it impact the average level of expression of a pltB:lacZ reporter during infection (Figure 2C, Figure S2A). Furthermore, biotin depletion did not increase pltB:lacZ expression in bacteria grown under in vitro (non-inducing) conditions, indicating that biotin starvation does not stimulate typhoid toxin expression (Figure S2B–C). These results indicate that mutations that prevent biotin biosynthesis eliminate the population of S. Typhi that does not express typhoid toxin during infection, but does not directly affect typhoid toxin expression. Taken together, our genetic screen identified genes that are required for the expression of typhoid toxin and genes that affect the proportion of S. Typhi that express typhoid toxin.
The two-component system PhoP/PhoQ and the regulatory protein SlyA activate the expression of typhoid toxin during S. Typhi infection of cultured epithelial cells
Our genetic screen identified the PhoP/PhoQ (PhoPQ) two-component regulatory system as potentially required for typhoid toxin gene expression. This observation is intriguing as this global regulator controls the expression of numerous genes, including those involved in several aspects of Salmonella-host interactions (Dalebroux and Miller, 2014; Groisman, 2001; Kato and Groisman, 2008). To verify this observation we determined the effects of deleting the phoPQ locus on the expression of β-galactosidase reporter fusions to pltB or cdtB (Figure 3A). Deletion of the phoPQ locus completely abolished expression of both the cdtB:lacZ and pltB:lacZ transcriptional reporters during infection of cultured epithelial cells, and expression of the reporters was restored upon introduction of a plasmid encoding phoPQ. To further explore the role of the PhoPQ system in typhoid toxin regulation, we expressed the constitutively allele PhoQE232K (Dalebroux et al., 2014) and examined the expression of typhoid toxin following S. Typhi growth under in vitro (non-inducing) conditions (Figure 3B). We found that expression the constitutive phoQE232K allele resulted in a significant (>30-fold) increase over wild type in the expression of the cdtB:lacZ and pltB:lacZ reporters. These results indicate that PhoPQ activation is sufficient to stimulate typhoid toxin expression under otherwise non-inducing conditions. Consistent with this observation, growth of S. Typhi under conditions that have previously been shown to stimulate PhoPQ activity, including growth under low concentrations of magnesium, acidic pH, or the presence of cationic antimicrobial peptides (Bader et al., 2005; Choi and Groisman, 2016; Garcia Vescovi et al., 1996; Prost et al., 2007), led to a significant increase in the expression of both transcriptional reporters, although acidic pH yielded more modest toxin expression (Figure 3C). This is consistent with a proteomics study that identified typhoid toxin components among S. Typhi proteins that are produced after growth under low magnesium conditions (Charles et al., 2009), and another study that reported elevated levels of typhoid toxin in S. Typhimurium grown under similar conditions (Guidi et al., 2013). However, the relevance of the latter study is uncertain since it was conducted in an heterologous systems and utilized a plasmid encoded reporter.
Figure 3. PhoPQ and SlyA activate typhoid toxin expression during infection.

(A) Expression of the pltB::lacZ reporter in the indicated S. Typhi strains carrying a low copy plasmid encoding phoPQ or the empty vector (EV). The levels of β-galactosidase activity in the inoculum and bacteria isolated from infected Henle-407 cells 20 hours post infection (hpi) were normalized by the number of CFU. (B and C) β-galactosidase activity (Miller units) of the pltB:lacZ and cdtB:lacZ reporters in the indicated S. Typhi ΔphoPQ strains carrying a low copy plasmid encoding phoPQ, phoPQE232K, or the empty vector (EV) (B) or grown in defined growth media under conditions in which PhoPQ activity is either repressed (pH 7.2, 1 mM Mg2+), or stimulated (10 μM Mg2+, 5 μg/ml C18G, pH 4.9) (C). (D) PhoP binding to the promoter regions of the indicated genes in S. Typhi grown under conditions that stimulate (10 μM Mg2+) or repress (2 mM Mg2+) PhoPQ activity. The amount of DNA recovered for the indicated promoters was normalized to the input sample. Fold enrichment values represent the ratio of this value to that of the rpoD control promoter. Asterisks denote promoters that were significantly enriched compared to the rpoD control under the indicated conditions. (E) Expression of the pltB:lacZ and cdtB:lacZ reporters in the indicated S. Typhi strains. The levels of β-galactosidase activity in the inoculum and bacteria isolated from infected cells were normalized by the number of CFU. (F) β-galactosidase activity (Miller units) of the pltB:lacZ and cdtB:lacZ reporters in the indicated S. Typhi strains carrying a plasmid encoding slyA (slyA) or the empty vector (EV). Values represent the mean +/− standard deviation for three independent determinations. Statistical differences between the indicated samples are denoted as follows: **** p<0.0001, *** p<0.001, **p<0.01, *p<0.05, n.s.s. not statistically significant. See also Figure S3.
The PhoPQ system controls the expression of a large number of genes, raising the possibility that its influence over typhoid toxin expression might be indirect. To explore this possibility, we first defined the locations of the promoters that control typhoid toxin expression using rapid amplification of cDNA ends (RACE). The genes encoding typhoid toxin, pltB, pltA and cdtB, as well ttsA, a gene required for its secretion, reside on a small genomic islet where cdtB is transcribed from one strand and pltB, pltA, and ttsA are transcribed from the opposite strand (Figure S3A). We identified a single transcriptional start site for each strand that reside 122 bp and 62 bp upstream of the coding regions of cdtB and pltB, respectively (Figure S3A). Deletion of the pltB promoter region resulted in a complete loss of ttsA expression during infection (Figure S3B). These data therefore indicate that typhoid toxin transcription is controlled by two promoters: one that drives cdtB expression and one that drives the expression of a pltB-pltA-ttsA operon. We then conducted chromatin immunoprecipitation (ChIP) experiments to determine whether PhoP could directly bind the typhoid toxin promoters. Under low magnesium (PhoP-activating) growth conditions, PhoP was found to bind both the pltB and cdtB promoter regions (Figure 3D). No binding was detected at either typhoid toxin promoter when S. Typhi was grown in the same medium containing a high concentration of magnesium (Figure 3D). Collectively, these data demonstrate that conditions that activate the PhoPQ system stimulate typhoid toxin expression and that PhoP is a direct activator of typhoid toxin expression.
In addition to phoP and phoQ, the FAST-INSeq screen also identified slyA as significantly enriched in the pool of mutants that did not express typhoid toxin during S. Typhi infection. SlyA is a PhoP-activated transcriptional regulator that acts as a co-regulator for the expression of a subset of genes within the PhoP regulon (Navarre et al., 2005; Norte et al., 2003; Shi et al., 2004). To investigate SlyA’s role in typhoid toxin regulation, we examined the expression of pltB and cdtB in a ΔslyA mutant strain. In agreement with the results of the screen, we observed in infected cells significantly less pltB:lacZ expression for the ΔslyA mutant relative to wild type (Figure 3E), although the reduction in expression was less pronounced than what we observed in the ΔphoPQ mutant (Figure 3A). In contrast, cdtB:lacZ expression during infection was not affected by the ΔslyA mutation, suggesting that SlyA is a co-activator of pltB-pltA-ttsA expression, but that it is not required for cdtB expression (Figure 3E). Similarly, the ΔslyA mutant exhibited decreased induction of pltB:lacZ expression compared to wild-type following in vitro growth in low magnesium medium, but did not affect cdtB:lacZ expression under these conditions (Figure S3C). The reduced expression of pltB under inducing conditions in the ΔslyA mutant strain was reversed by introducing a plasmid encoding a wild type copy of slyA (Figure S3D). Interestingly, over-expression of slyA under non-inducing growth conditions led to a substantial increase in both pltB:lacZ and cdtB:lacZ expression (Figure 4F). In the case of cdtB, this effect was not observed in a ΔphoPQ mutant background, suggesting that the increased cdtB expression observed under these conditions was due to PhoPQ activation as a result of SlyA over-expression. Consistent with this hypothesis, we observed that SlyA over-expression also induced expression of other PhoP-activated genes, including those whose expression is thought to be SlyA independent (Figure S3E). In contrast to cdtB, over-expression of slyA in a ΔphoPQ background led to increased pltB expression (Figure 3F), indicating that SlyA can stimulate pltB expression in a PhoPQ-independent manner. Collectively, these results demonstrate that stimulation of the PhoPQ system following S. Typhi invasion of host cells directly activates typhoid toxin expression and that SlyA is an important co-activator of the pltB but not of the cdtB promoter.
Figure 4. H-NS silences typhoid toxin expression under non-inducing conditions.

(A) H-NS binding to the promoter regions of the indicated S. Typhi genes after growth in a medium not permissive for typhoid toxin expression (pH 7.2, 2 mM Mg2+). Included in the analysis are the PhoP-activated genes pagC and mgtA as positive and negative controls, respectively. The amount of DNA recovered was normalized to the amount in the input sample. Fold enrichment values represent the ratio of this value to that of the rpoD control promoter. Asterisks denote promoters that were significantly enriched compared to the rpoD control. (B and C) β-galactosidase activity (Miller units) of the pltB:lacZ reporter in the indicated S. Typhi reporter strains grown under non-inducing conditions. Expression of the reporter in five independently-generated Δhns/ΔphoPQ mutant strains is shown (B). Expression of the reporter in the Δhns/ΔphoPQ strain carrying a plasmid encoding hns or the empty vector (EV) (C). Asterisks denote statistical significance when compared to the wild-type sample. (D) Relative mRNA levels of the indicated genes in wild-type or Δhns/ΔphoPQ S. Typhi mutant strains grown under non-inducing conditions for toxin expression. PhoP-activated genes that are silenced by H-NS (pagC) or independent of H-NS (mgtA, slyB) were included as controls. Values shown represent the mean +/− standard deviation for three independent determinations. **** p<0.0001, *** p<0.001, **p<0.01, *p<0.05, n.s.s. not statistically significant.
H-NS silences typhoid toxin expression under non-inducing conditions
To gain further insight into the regulatory mechanisms that control typhoid toxin gene expression we conducted a transposon mutagenesis screen to identify mutations that permit expression of the toxin genes under non-inducing conditions. For this screen we used the pltB:lacZ S. Typhi reporter strain in conjunction with a transposable element that carries an outward-facing, IPTG-inducible promoter that can drive the expression of downstream genes. S. Typhi mutant colonies able to express typhoid toxin were identified on LB indicator plates that contained X-Gal and IPTG. Screening more than 200,000 transposon mutants led to the identification of numerous colonies with increased pltB:lacZ expression. Mapping of the transposon insertion sites determined that in the majority of the identified mutants the transposon’s IPTG-inducible promoter inserted immediately upstream of the lacZ coding sequence and therefore these mutants were not considered further. Several independent insertions were mapped to the region immediately upstream of slyA, placing its expression under the control of the IPTG-inducible promoter in the transposable element indicating that, as shown above, over-expression of slyA results in increased typhoid toxin expression. Additional transposon insertions mapped to hns, which encodes a nucleoid associated protein that modulates chromosomal structure (Fang and Rimsky, 2008; Stoebel et al., 2008) and silence the expression of horizontally acquired genes, which, like those encoding typhoid toxin, exhibit high AT content (Lucchini et al., 2006; Navarre et al., 2006). The increased pltB expression observed in these mutants did not require the addition of IPTG, indicating that stimulation of the expression of the pltB:lacZ reporter is likely due to the loss of H-NS activity. Using ChIP, we determined that H-NS strongly binds both the pltB and the cdtB promoter regions, indicating that H-NS directly silences the typhoid toxin genes (Figure 4A). A previous screen conducted to identify mutations that allow expression of cdtB under non-inducing conditions identified genes not detected in this screen (Haghjoo and Galan, 2007). The discrepancies between the two screens are likely due to differences in the genetic backgrounds and reporters used in the two studies. Each of the independent hns insertion mutants identified in the screen mapped to the 3′ end of the hns coding region, suggesting that the mutations might result in a partial loss of H-NS function. To further investigate the role of H-NS in typhoid toxin regulation, we sought to generate an hns S. Typhi deletion mutant strain. hns has been reported to be essential for S. Typhimurium in a wild-type background but dispensable in a strain that lacks phoPQ (Navarre et al., 2006). We therefore deleted hns in a ΔphoPQ pltB:lacZ strain and examined the expression of the reporter in standard laboratory medium (non-inducing conditions). We found that the expression of pltB:lacZ in several independently-generated Δhns/ΔphoPQ reporter strains was significantly (~25-fold) higher than its expression in the wild type strain grown under the same conditions (Figure 4B). The increase in pltB:lacZ expression under non-inducing conditions in the Δhns/ΔphoPQ strain was reversed upon hns complementation, confirming that the de-repression of typhoid toxin expression in the hns mutant strain is due to the loss of H-NS (Figure 4C). Using RT-qPCR, we also observed that the transcript levels of the co-regulated ttsA and cdtB genes were markedly increased in the Δhns/ΔphoPQ strain when compared to wild type after growth under non-inducing conditions (Figure 5D). We also compared the expression of other PhoP-regulated genes in the wild-type and Δhns/ΔphoPQ strains, including genes whose expression in S. Typhimurium is dependent (pagC) or independent (slyB and mgtA) of H-NS (Perez et al., 2008). We observed that expression of pagC was greatly increased in the Δhns/ΔphoPQ background, while expression of slyB and mgtA was unchanged or slightly reduced (Figure 4D). These results demonstrate that PhoP-activated gene expression is not ubiquitously increased in this strain and that the observed de-repression of typhoid toxin gene expression in this strain is the result of a loss of H-NS silencing. Taken together, these results indicate that in the absence of H-NS silencing the typhoid toxin genes are highly expressed, even in the absence of PhoPQ. Typhoid toxin expression is therefore controlled by a silencing and counter-silencing mechanism mediated by H-NS, PhoPQ, and the PhoPQ-regulated gene SlyA.
Figure 5. Typhoid toxin is expressed by intravacuolar but not by cytosolic S. Typhi.

(A and B) Henle-407 cells were infected with pltB:gfp S. Typhi constitutively expressing mCherry. At 18 hours post infection (hpi) the samples were fixed and S. Typhi were visualized using the mCherry (red) signal, while typhoid toxin expression was visualized using the GFP signal (green). A representative field in which all S. Typhi exhibit high levels of typhoid toxin expression is shown (A). A rare infected cell that contains large numbers of S. Typhi, distributed throughout much of the cell, that do not express the pltB:gfp typhoid toxin reporter is also shown (B). (C) HeLa cells were infected with a S. Typhi strain expressing pltB:gfp. At 12 hpi the samples were fixed and the cells were selectively permeabilized using digitonin. The nuclei of HeLa cells were visualized using DAPI staining (blue), which also faintly stained the S. Typhi chromosomal DNA. S. Typhi localized within the cell cytosol was visualized using an antibody against S. Typhi LPS (red) and typhoid toxin expression was visualized using the GFP signal (green). The image shown is a representative example of a rare infected cell that contains large numbers of cytoplasmic S. Typhi that exhibit little or no typhoid toxin expression. Scale bars: 10 μm. For all panels, brightness and contrast were optimized for each of the individual color channels to maximize visual clarity. See also Figures S4 and S5.
Salmonella Typhi localization within the SCV is required for Typhoid toxin expression
As discussed above, we observed that a significant proportion of intracellular S. Typhi does not express typhoid toxin. This is in contrast to S. Typhi grown under inducing conditions in vitro, which leads to toxin expression in virtually the entire population (Figure S2D). This observation suggests that during infection a subset of intracellular S. Typhi does not receive the environmental cues required to stimulate toxin expression. To explore this premise, we examined typhoid toxin expression at the single bacterium level during infection of Henle-407 cells using fluorescence microscopy. We found that the vast majority of infected cells contained exclusively S. Typhi that expressed high levels of the toxin reporter (Figure 5A). However, a small number of host cells contained very large numbers of bacteria (>100/cell in many cases) that did not express detectable levels of GFP (Figure 5B). The distribution and large numbers of bacteria observed in these cells suggested that the S. Typhi population that does not express the toxin genes might be localized within the host cell cytosol and not within a vacuole. Following invasion of host cells Salmonella resides within a membrane-bound compartment. In cultured epithelial cells, however, a small proportion of the intracellular bacteria escape the phagosomal environment to reach the cellular cytosol where they replicate to high numbers (Knodler et al., 2010). To determine whether the S. Typhi population that does not express typhoid toxin is localized within the cytosol, we used fluorescence microscopy and a differential-staining protocol that distinguishes vacuolar and cytosolic Salmonella. We used pltB:gfp to identify the population of S. Typhi that expresses typhoid toxin and LPS staining after digitonin permeabilization to identify cytoplasmic bacteria (Checroun et al., 2006; Knodler et al., 2010). We observed two populations of S. Typhi: a more abundant population of vacuolar bacteria exhibiting high levels of GFP expression, and a minor population of densely clustered cytoplasmic bacteria in a small number of cells that had low or undetectable levels of GFP expression (Figure 5C, Figure S4). These data demonstrate that typhoid toxin is only expressed by S. Typhi located within the SCV and that the cues necessary to stimulate its expression are absent in the cell cytosol.
During the screen for genes that control the expression of typhoid toxin we observed that the population of S. Typhi that does not express the typhoid toxin genes was absent in biotin biosynthesis mutants, although these mutants do not appear to directly affect typhoid toxin expression. This observation in conjunction with the observation that cytosolic bacteria are unable to express typhoid toxin suggest that biotin biosynthesis might be required for S. Typhi to escape the SCV and/or to replicate within the cytosol. To test this hypothesis we used fluorescence microscopy to examine typhoid toxin expression in cells infected with a S. Typhi ΔbioB mutant. Consistent with the observation that this mutant does not affect the expression of typhoid toxin, we found robust expression of the pltB:gfp reporter in intracellular bacteria. However, compared to cells infected with wild type S. Typhi, we found drastically reduced numbers of bacteria that did not express typhoid toxin in the ΔbioB strain. The rare bacteria identified that were not expressing the toxin, were filamentous (Figure S5A) and cytosolic (Figure S5B, Figure S4C). Collectively, these data indicate that biotin biosynthesis is required for S. Typhi to grow in the host cell cytosol and further support the conclusion that S. Typhi exclusively expresses typhoid toxin within the SCV.
DISCUSSION
We have described here a regulatory network that effectively controls the exclusive expression of typhoid toxin within mammalian cells to ensure the coordination of typhoid toxin synthesis with its subsequent export from infected cells. We have found that S. Typhi decodes environmental cues that lead to typhoid toxin intracellular production through mechanisms involving the PhoP/PhoQ two-component transcriptional regulatory system. This system works in conjunction with an opposing silencing mechanism involving the histone-like protein H-NS that ensures the effective repression of typhoid toxin expression when S. Typhi is not in the appropriate environment for toxin production such as outside of host cells. Although we found that PhoP is able to bind the promoters that drive typhoid toxin transcription, our data indicate that in this regulatory network, PhoP may be exerting its activity not as a direct transcriptional activator but rather, by opposing the silencing activity of H-NS. Consistent with this notion we found that in the absence of H-NS typhoid toxin expression is independent of PhoP/PhoQ, which is in agreement with recent findings indicating that a subset of S. Typhimurium’s PhoP regulon comprised of horizontally acquired genes is regulated in this manner (Will et al., 2014; Zwir et al., 2012; Zwir et al., 2014).
The unique architecture of typhoid toxin suggests that this multi-subunit toxin may have emerged relatively recently (Galán, 2016). Consistent with this hypothesis, our results indicate that cdtB and the pltB pltA ttsA operon are regulated differently. Although transcription from both promoters is controlled by the PhoP/PhoQ system, they differ in their requirement for SlyA thus indicating that both promoters have not yet converged into a single regulatory network. Alternatively, these differences in the regulatory mechanisms may suggest the intriguing possibility that, in some instances, typhoid toxin may be assembled without its CdtB subunit.
What might be the environmental cue(s) that lead to typhoid toxin expression? The sensor kinase PhoQ has been shown to be able to sense several environment conditions, many of which we showed here were able to stimulate toxin expression. For example, the PhoP/PhoQ system is activated under low Mg2+ conditions and we found that growth of S. Typhi in media containing low Mg2+ concentrations resulted in high levels of typhoid toxin expression. Interestingly, it has been previously shown that the high affinity magnesium transporter MgtA is required by Salmonella to robustly express the PhoP regulon under low magnesium conditions (Park and Groisman, 2014) and our genetic screen showed that insertions within mgtA were over-represented in the pool of mutants showing lower toxin expression. However, although a ΔmgtA S. Typhi mutant strains showed significantly reduced typhoid toxin expression after in vitro growth under low magnesium growth conditions, this mutation had no effect on toxin expression after infection of cultured epithelial cells (Figure S6). However, beginning ~6 hpi, the ΔmgtA mutant strain was recovered at significantly reduced numbers compared to wild type (Figure S6 and Table S4). The reduced replication of the ΔmgtA mutant within the SCV altered the proportion of intravacuolar vs cytoplasmic bacteria thus altering the proportion of bacteria expressing typhoid toxin, which explains its detection in the original screen. These observations may also explain why other genes identified by our screen to affect typhoid toxin expression (Table 1), have no effect on typhoid toxin expression when individually tested (Figure 2) (Table S4). These observations also suggest that limited availability of magnesium may not be a relevant in vivo cue that leads to typhoid toxin expression and that another cue or combination of cues may be responsible for triggering toxin expression.
Our data indicate that toxin expression strictly requires the environment of the Salmonella-containing vacuole. We arrived at this conclusion through multiple pieces of evidence. We found that bacteria that have escaped to the cell cytosol did not expressed typhoid toxin. This observation was further supported by the genetic screen, which identified insertions within the gene encoding the SPI-2 T3SS effector SifA as enriched in the pool of bacteria that failed to express the toxin. Previous studies have shown that mutations in this gene have a propensity to escape the SCV (Beuzon et al., 2000). Our screen also identified genes involved in biotin biosynthesis as specifically enriched in the population of bacteria that expressed typhoid toxin. We demonstrated that these mutants do not affect typhoid toxin expression, but rather they affect the ability of the cytoplasmic population that fails to express typhoid toxin to grow and divide normally.
Given the high degree of inter-connectivity between regulatory networks and the presence of several global regulatory networks active in Salmonella during the intracellular phase of infection, it is noteworthy that each of the mutants that altered typhoid toxin expression levels identified by our comprehensive screen mapped to the PhoPQ/H-NS silencing/counter-silencing circuit. Indeed, it is well documented that other regulatory networks co-regulate PhoP-activated genes or even regulate phoP/phoQ expression directly (Dalebroux and Miller, 2014; Groisman, 2001; Kato and Groisman, 2008), and yet none of those networks emerged from our screen. Our data suggest that typhoid toxin expression requires a high level of PhoQ stimulation, a feature presumably important to insulate toxin expression from cross-talk with other regulatory networks. These regulatory features provide a platform to ensure very tightly repressed toxin expression when it is not required, but very high levels of toxin expression from within SCVs.
STAR Methods
CONTACT FOR REAGENTS AND RESOURCE SHARING
Requests and inquiries for reagents and resource sharing should be directed to the Lead Contact, Dr. Jorge Galán (jorge.galan@yale.edu).
EXPERIMENTAL MODEL AND SUBJECT DETAILS
Bacterial Strains
All S. Typhi strains described (listed in the Key Resources Table) were derived from the wild-type isolate ISP2825 (Galan and Curtiss, 1991) and were constructed using standard recombinant DNA and allelic exchange procedures using the E. coli β-2163 Δnic35 as the conjugative donor strain (Demarre et al., 2005). Strains were routinely cultured in LB broth at 37°C. Where indicated, a chemically defined growth medium was used that is based on N minimal medium (Snavely et al., 1991), containing 0.2% glucose as a carbon source, supplemented with the indicated concentrations of MgCl2 and adjusted to pH 7.2 unless otherwise stated.
KEY RESOURCES TABLE.
| REAGENT or RESOURCE | SOURCE | IDENTIFIER |
|---|---|---|
| Antibodies | ||
| Rabbit polyclonal anti-S. Typhi | Sifin | TS1605 |
| Goat anti-rabbit Alexa-594 | Thermo Fisher | Cat # A11012 RRID: AB_2534079 |
| Mouse monoclonal M2 anti-FLAG | Sigma-Aldrich | Cat # F3165 RRID:AB_259529 |
| Mouse monoclonal anti-GM130 | BD Biosciences | Cat # 610823 RRID: AB_398142 |
| Goat anti-mouse Alexa-647 | Invitrogen | Cat # A-21240 RRID: AB_2535809 |
| Bacterial and Virus Strains | ||
| Salmonella enterica serovar Typhi ISP2825 | Roy Curtis III | PMID: 1879916 |
| SB2612 pltB:lacZ | Galán Laboratory | This study |
| SB2625 pltB:lacZ ΔphoPQ | Galán Laboratory | This study |
| SB2627 pltB:lacZ ΔslyA | Galán Laboratory | This study |
| SB2890 pltB:lacZ ΔpurF | Galán Laboratory | This study |
| SB2894 pltB:lacZ ΔyrbE | Galán Laboratory | This study |
| SB2897 pltB:lacZ ΔyqcA | Galán Laboratory | This study |
| SB2908 pltB:lacZ ΔsifA | Galán Laboratory | This study |
| SB2954 pltB:lacZ ΔmgtA | Galán Laboratory | This study |
| SB2884 pltB:lacZ ΔbioB | Galán Laboratory | This study |
| SB2965 pltB:lacZ ΔphoPQ Δhns | Galán Laboratory | This study |
| SB2718 pltB:gfp | Galán Laboratory | This study |
| SB2900 pltB:gfp ΔphoPQ | Galán Laboratory | This study |
| SB2886 pltB:gfp ΔslyA | Galán Laboratory | This study |
| SB2895 pltB:gfp ΔyrbE | Galán Laboratory | This study |
| SB2885 pltB:gfp ΔbioB | Galán Laboratory | This study |
| SB2613 cdtB:lacZ | Galán Laboratory | This study |
| SB2626 cdtB:lacZ ΔphoPQ | Galán Laboratory | This study |
| SB2628 cdtB:lacZ ΔslyA | Galán Laboratory | This study |
| SB2720 phoP-3xFLAG | Galán Laboratory | This study |
| SB2993 hns-3XFLAG | Galán Laboratory | This study |
| SB3235 cdtB-3xFLAG ttsA-3xFLAG | Galán Laboratory | This study |
| SB3206 cdtB-3xFLAG ttsA-3xFLAG ΔPpltB | Galán Laboratory | This study |
| E. coli β-2163 Δnic 35 | Didier Mazel | PMID: 15748991 |
| Biological Samples | ||
| Chemicals, Peptides, and Recombinant Proteins | ||
| Digitonin | Sigma-Aldrich | Cat # D141 |
| DAPI | Sigma-Aldrich | Cat # 10236276001 |
| Terminal Transferase | New England BioLabs | Cat # M0315S |
| MmeI | New England BioLabs | Cat # R0637S |
| Sau3AI | New England BioLabs | Cat # R0169S |
| BamHI | New England BioLabs | Cat # R3136S |
| ONPG | Sigma-Aldrich | Cat # N1127 |
| X-gal | American BIO | Cat # AB02400 |
| IPTG | Sigma-Aldrich | Cat # I6758 |
| TRIzol | Thermo Fisher | Cat # 15596026 |
| Critical Commercial Assays | ||
| iScript cDNA synthesis kits | BIO-RAD | Cat # 1708891 |
| iTaq Universal SYRB Green Supermix | BIO-RAD | Cat # 1725121 |
| Deposited Data | ||
| Experimental Models: Cell Lines | ||
| Henle-407 (Human epithelial cells) | Roy Curtiss III | N/A |
| HeLa (human epithelial cells) | ATCC | CCL-2 RRID:CVCL_0030 |
| Experimental Models: Organisms/Strains | ||
| Oligonucleotides | ||
| See Table S6. | ||
| Recombinant DNA | ||
| pSB4004 pWSK-PrpsM-mCherry | Galán Laboratory | PMID: 22042847 (Spano et al., 2011) |
| pSB3784 pBAD-tetR-empty vector | Galán Laboratory | This study |
| pSB4785 pBAD-slyA | Galán Laboratory | This study |
| pWSK129 pWSK-empty vector | Sidney Kushner | PMID: 2055470 |
| pSB5091 pWSK-phoPQ | Galán Laboratory | This study |
| pSB5093 pWSK-phoPQE232K | Galán Laboratory | This study |
| pSB4702 pWSK-slyA | Galán Laboratory | This study |
| pSB5090 pWSK-hns | Galán Laboratory | This study |
| pSB4807 pSAM-cmR | Galán Laboratory | This study |
| pSB4700 pAJD428-ampR-kanR | Galán Laboratory | This study |
| • | ||
| Software and Algorithms | ||
| GraphPad Prism | GraphPad Software | https://www.graphpad.com/scientific-software/prism/ |
| MicroManager | Ronald Vale lab, UCSF | https://micro-manager.org |
| Adobe Photoshop | Adobe | www.adobe.com |
| Adobe Illustrator | Adobe | www.adobe.com |
| INSeq_pipeline_v2 package | Andrew Goodman lab, Yale University | N/A |
| FlowJo | FlowJo, LLC | https://www.flowjo.com |
| Other | ||
Cell Lines
The Henle-407 and HeLa cell lines employed in this study were cultured in Dulbecco’s modified Eagle medium (DMEM, GIBCO) supplemented with 10% bovine calf serum (BCS, Gemini Bioproducts) at 37°C with 5% CO2 in a humidified incubator. Both cell lines were routinely tested for mycoplasma contamination. HeLa cells were obtained from the ATCC and Henle-407 cells were obtained from the Roy Curtiss library collection. See the Key Resources Table.
METHOD DETAILS
Plasmids
All plasmids (listed in Key Resource Table) were constructed using standard recombinant DNA techniques. The plasmid used to over-express slyA was constructed by inserting the slyA coding sequence downstream of the PBAD promoter in a tetracycline-resistant derivative of the pBAD30 plasmid (Guzman et al., 1995). All plasmids used for complementation experiments were derived from the low copy plasmid pWSK129 (Wang and Kushner, 1991), into which the indicated genes and their native promoters were cloned.
Salmonella Typhi infections
To infect Henle-407 and HeLa cells, overnight cultures of S. Typhi were diluted 1/20 into fresh LB containing 0.3 M NaCl and grown to an OD600 of 0.9. Cells were infected for 1 hour in Hank’s balanced salt solution (HBSS) at a multiplicity of infection (MOI) of 50 (FAST-INSeq screen and western blot analysis) or 20 (all other experiments). Cells were then washed three times with HBSS and incubated in culture medium containing 100 μg/ml gentamycin to kill extracellular bacteria. After 1 hour, cells were washed and fresh medium was added containing 5 μg/ml gentamycin to avoid repeated cycles of reinfection.
Transposon mutagenesis
Transposon mutagenesis for the FAST-INSeq screen was conducted using a mariner transposon delivered by pSB4807, a modified version of the pSAM_Bt plasmid (Goodman et al., 2009) in which the ermR cassette was replaced by a cmR cassette. This suicide vector was mobilized into the pltB:gfp S. Typhi strain by conjugation using E. coli β-2163 Δnic35 as the donor strain. Mutants were selected by plating on LB agar plates containing 30 μg/ml chloramphenicol. A total of ~200,000 mutants were collected and multiple aliquots of this library were stocked for subsequent use in the screen (described below). Transposon mutagenesis for the in vitro screen seeking mutants that activate typhoid toxin expression under non-inducing conditions was conducted in a similar manner but using a mini Tn5 transposon from pSB4700, a modified version of the pAJD428 plasmid (Maxson and Darwin, 2004), and pltB:lacZ S. Typhi as the host strain. In this screen, mutants were selected on LB plates containing 40 μg/ml kanamycin, which also contained 1 mM IPTG (to induce expression from the transposable element’s outward-facing Ptac promoter) and 40 μg/ml X-gal (to identify mutants exhibiting pltB:lacZ expression under these non-inducing conditions). Individual blue colonies were picked, colony purified two times, and assayed using quantitative β-galactosidase assays to identify active mutants. The transposon insertion sites of selected mutants were identified by isolating their genomic DNA, which was partially digested with the restriction enzyme Sau3AI (New England Biolabs). Digested genomic DNA was ligated to DNA adaptors that had been digested with BamHI (New England Biolabs) and ligation products were PCR-amplified using primers that anneal to the adaptor sequences. PCR products were then sequenced using an outward-facing primer within the transposable element. A total of >200,000 mutant colonies were screened in this manner.
FAST-INSeq screen
Five 15 cm dishes were seeded with 1×10⁷ Henle-407 cells each and grown for ~24 hours prior to infection using the transposon mutant library described above. Aliquots of the inoculum used for infection were collected for subsequent INSeq preparation (inoculum pool). 18 hours post infection, the cells were washed three times with PBS, detached from plates using dilute trypsin and pelleted by centrifugation at 150 x g for 5 minutes. Cells were lysed using a 5 min incubation in 0.1% sodium deoxycholate (in PBS) supplemented with 100 μg/ml DNase I to degrade and solubilize the genomic DNA released from lysed host cells. The lysate was centrifuged at 5,000 x g for 5 minutes to isolate S. Typhi from the soluble cellular debris. The S. Typhi-containing pellet was re-suspended in PBS and further purified from cellular debris using two spins at 150 x g for 5 minutes (discarding the pellet fraction) and one spin at 3,200 x g for 20 minutes (discarding the supernatant). An aliquot of the recovered S. Typhi was amplified by growth in LB at 37°C and subsequently prepared for INSeq sequencing (post-infection pool) and the remainder was washed and diluted in PBS to a concentration of ~2×10⁶ bacteria/ml for FACS. A total of ~6×10⁶ S. Typhi mutants were sorted according to their fluorescence intensity in the GFP channel (488 nm excitation, 515/20 with 505LP emission) using a BD FACS Aria II flow cytometer. The isolated low fluorescence and high fluorescence pools were amplified by growth in LB at 37°C and subsequently prepared for INSeq sequencing. The screen was conducted using the same mutant library on three independent occasions.
For INSeq sequencing, genomic DNA was extracted from each of the mutant pools, digested with MmeI (New England Biolabs) and barcoded samples were prepared for sequencing as described previously (van Opijnen et al., 2009). The purified 121 bp DNA products containing barcodes to identify the individual mutant pools were sequenced on an Illumina HiSeq2000 system at the Yale Center for Genomic Analysis. The sequencing data were analyzed using the INSeq_pipeline_v2 package (Goodman et al., 2011) which separated sequencing reads by pool, mapped/quantified insertions and grouped insertions by gene. For each pool, the total number of sequencing reads was normalized to be 2,176,000 (an average of 500/gene). To identify genes in which insertions were enriched in a statistically significant manner in one pool compared to another, a value of 50 (10% of the average number of reads per gene) was added to the normalized number of reads in both pools. Ratios of the log-transformed read numbers for the two pools were then calculated and genes with values that were an average of more than two standard deviations from the mean over the three replicates of the screen were considered to be significantly enriched.
β-galactosidase assays
For in vitro grown samples, unless otherwise stated, overnight cultures were washed two times, diluted 1/20 into fresh medium and grown for 8 hours at 37°C at which point 10 or 20 μl of the culture was added to 90 μl of permeabilization buffer (100 mM Na2HPO4, 20 mM KCl, 2 mM MgSO4, 0.8 mg/ml hexadecyltrimethylammonium bromide [CTAB], 0.4 mg/ml sodium deoxycholate, 5.4 μL/ml β-mercaptoethanol) and assayed as described below. For samples collected from infected cells, 3×10⁵ Henle-407 cells were plated in 6-well plates and grown for 24 hours prior to infection with the indicated strains. Following infections, cells were washed two times with PBS, released from the plates using dilute trypsin and pelleted by centrifugation for 5 minutes at 150 x g. Cells were then lysed in 0.1% sodium deoxycholate (in PBS) supplemented with 100 μg/ml DNase I and the lysate was centrifuged at 5,000 x g for 5 minutes to pellet the bacteria. The bacteria were re-suspended in PBS, a small aliquot of which was diluted to calculate the total number CFU recovered. The remainder of the bacteria were re-suspended in 100 μl of permeabilization buffer and assayed as described below. Assays were conducted at 20 hpi other than the experiment depicted in Figure 2B, which was conducted at 8 hpi to avoid biases introduced by the low rates of survival of some of the mutant strains assessed in this experiment at later time points. β-galactosidase assays were conducted using a modified version of the protocol developed by Miller (Miller, 1972). Briefly, samples were permeabilized for 20 minutes at room temperature in the buffer described above. 600 μl of substrate buffer (60 mM Na2HPO4, 40 mM NaH2PO4, 2.7 μL/mL β-mercaptoethanol, 1 mg/ml ONPG [o-nitrophenyl-β-D-galactopyranoside, Sigma]) was then added to initiate the reactions. Once the samples developed an obvious yellow colour, the reactions were quenched using 700 μl of 1M Na2CO3 and the reaction time was noted. Cell debris was removed by centrifugation at 20,000 x g for 5 minutes and the OD420 of the samples was measured. Miller units were calculated as: (1000 * OD420)/(reaction time [minutes] * culture volume assayed [ml] * OD600 [culture]). Two-tailed student’s t tests were used to determine the statistical significance of the indicated pairwise comparisons.
GFP reporter assays
4×10⁶ Henle-407 cells were plated in 10 cm dishes and grown for 24 hours prior to infection with the pltB:gfp S. Typhi strain. At the indicated time points post infection, the intracellular bacteria were recovered and the total number of CFU was determined as described above for β-galactosidase assays. The bacteria were suspended in 200 μL PBS and added to 96-well black clear bottom plates (Corning) and the fluorescence intensity of GFP was determined using a Tecan Infinite m1000 plate reader (488/5 excitation, 510/5 emission).
Quantitative RT-PCR
Samples were grown as described and total RNA was isolated using RNAprotect Bacteria Reagent and RNeasy purification kits (QIAGEN) according to manufacturer’s instructions. Because the RNAprotect reagent caused lysis of the Δhns/ΔphoPQ strain, RNA was instead isolated from all strains using TRIzol (Thermo Fisher) according to manufacturer’s instructions for the experiments employing this mutant. Following DNase I treatment, cDNA was synthesized using the iScript cDNA synthesis kit (BIO-RAD) and qPCR was conducted using iTaq Universal SYRB Green Supermix (BIO-RAD) and the iCycler IQ system (BIO-RAD). Transcript levels were normalized using the levels of 16S RNA and two-tailed student’s t tests were used to determine the statistical significance of the indicated pairwise comparisons between samples.
Chromatin immunoprecipitation
Chromatin immunoprecipitation experiments were performed using strains that featured C-terminal 3xFLAG epitope-tagged versions of phoP or hns integrated at the native genomic locus. Overnight cultures were washed, diluted 1/20 in 6 ml of defined growth medium containing the indicated concentration of MgCl2 and grown for 4.5 hours at 37° C. Samples were fixed by adding formaldehyde to a final concentration of 1% for 15 minutes, at which time fixation was quenched by adding 125 mM glycine and samples were washed three times with PBS. Bacterial pellets were re-suspended in 1.8 ml of lysis buffer (50 mM Tris-HCl pH 7.5, 1 mM EDTA, 150 mM NaCl, 1% Triton X-100, complete protease inhibitor cocktail [Sigma]), lysed using a One Shot Cell Disruptor (Constant Systems Ltd) and sonicated (15% amplitude, 3 minutes, 15 second pulses) using a Branson Digital Sonifier to fragment genomic DNA to an average size of ~500 bp. Lysates were clarified by centrifugation at 20,000 x g for 15 minutes and a 50 μL aliquot was taken (input DNA). 10 μL of anti-FLAG M2 Affinity Gel (Sigma) was added to the remaining sample, which was incubated for 2 hours at 4°C with agitation. Samples were then washed twice in lysis buffer, twice in LiCl/detergent buffer (20 mM Tris-HCl pH 7.5, 250 mM LiCl, 1 mM EDTA, 0.1% Nonidet P-40, 1% Triton X-100), once in TE (20 mM Tris-HCl pH 7.5, 1 mM EDTA), and eluted in 50 mM Tris-HCl pH 8.0, 10 mM EDTA, 1% SDS (65°C for 15 minutes with agitation). Eluted immunoprecipitates were incubated at 65°C for 9 hours to reverse crosslinks and DNA was purified using silica spin columns. qPCR using iTaq Universal SYRB Green Supermix (Bio-Rad) and the CFX Connect Real- Time PCR Detection System (Bio-Rad) was then used to quantify the promoter regions corresponding to the indicated genes. Fold enrichment values were calculated as: (IPgene/IPrpoD)/(Inputgene/InputrpoD). One-way t-tests were used to determine the statistical significance of the enrichment of the tested promoter regions.
Fluorescence microscopy
To image fluorescent bacteria, Henle-407 cells plated on glass coverslips were infected with the indicated S. Typhi pltB:gfp strains carrying a plasmid that drives constitutive mCherry expression. At the indicated time point post-infection, the samples were washed with PBS, fixed in 4% paraformaldehyde, washed thoroughly with PBS and mounted on slides. Slides were imaged using an Eclipse TE2000 inverted microscope (Nikon) with an Andor Zyla 5.5 sCMOS camera driven by Micromanager software (https://www.micro-manager.org). Selective digitonin permeabilization experiments to visualize cytoplasmic S. Typhi were conducted similarly to previously described methods (Checroun et al., 2006; Knodler et al., 2010). Briefly, cells were plated on coverslips and infected with the indicated pltB:gfp S. Typhi strains as described above. At 12 hours post infection, an optimal time point to capture both high levels of typhoid toxin expression and relatively frequent instances of S. Typhi in the host cell cytosol, cells were washed twice with HBSS, permeabilized using 20 μg/ml digitonin (Sigma) in HBSS for 1 minute, and washed twice with HBSS. Cells were then incubated in a 1:10,000 dilution of rabbit polyclonal anti-S. Typhi LPS antibody (Sifin) and a 1/200 dilution of a mouse anti-GM130 antibody (BD Biosciences) in HBSS for 15 minutes at 37°C (5% CO2 incubator). Coverslips were then washed thoroughly using PBS and fixed using 4% paraformaldehyde. Samples were then stained using Alexa-594 conjugated anti-rabbit antibody (1:2,000 dilution, Thermo Fisher), an Alexa-647 conjugated anti-mouse antibody (1:2,000 dilution, invitrogen) and DAPI (Sigma) to stain DNA for 2 hours at room temperature, washed extensively using PBS, mounted on coverslips, and imaged as described above. The fraction of infected cells containing cytoplasmic bacteria was quantified using this approach, using the GM130 signal to identify permeabilized cells, the DAPI signal to identify infected cells and LPS staining to identify infected cells containing cytoplasmic bacteria. Data shown for each strain represent the average +/− the standard error of the mean for four independent experiments wherein the total number of cells containing cytoplasmic bacteria was determined for at least 100 infected and permeabilized cells. Digitonin concentrations that were sufficient to permeabilize Henle-407 cells displaced the cells from the coverslips; this phenomenon has been described previously for other epithelial cell lines (Knodler et al., 2014). HeLa cells, which are commonly used for experiments to visualize cytoplasmic Salmonellae, were therefore used for these experiments. For all images, brightness and contrast were optimized for each of the individual color channels to maximize visual clarity.
Analytical flow cytometry
For in vitro grown samples, overnight cultures of pltB:gfp were washed twice and re-suspended in the defined medium described above containing the indicated concentrations of MgCl2. Bacteria were then washed twice and re-suspended in PBS to a final concentration of ~106 bacteria/ml for flow cytometry analysis. For samples isolated from infected cells, the indicated pltB:gfp strains carrying a plasmid driving constitutive mCherry expression were used to infect Henle-407 cells as described above. At 18 hours post infection, bacteria were isolated and prepared for flow cytometry as described for the FAST-INSeq screen. For each sample the fluorescence intensity in the GFP channel (488 nm excitation, 515/20 with 505LP emission) was analyzed for 10,000 bacteria using a BD FACS Aria II flow cytometer. For samples isolated from infected cells, only particles with mCherry levels (532 nm excitation, 610/20 with 600LP emission) above the background levels observed for mCherry-negative control samples were analyzed.
Rapid amplification of cDNA ends
An overnight culture of wild-type S. Typhi (ISP2825) was washed twice and diluted 1/20 into fresh defined medium containing 10 μM MgCl2. Following 5 hours of growth at 37°C, total RNA was extracted using TRIzol (Thermo Fisher) according to manufacturer’s instructions. The transcriptional start sites at the typhoid toxin locus were then mapped using previously described methods (Frohman et al., 1988). Briefly, gene-specific cDNA was synthesized using primers that anneal to the coding sequences of pltB, 40 cdtB and ttsA respectively. Homopolymeric tails were added to the 3′ ends of the cDNA using terminal transferase (New England Biolabs), which permitted subsequent PCR amplification of the cDNAs, the products of which were sequenced to identify the transcriptional start sites.
QUANTIFICATION AND STATISTICAL ANALYSIS
Details of the statistical tests used to evaluate the significance of all observations (including the statistical test, precision and dispersion metrics, the n values used as well as how significance is defined), is provided in the corresponding figure legends. The methods of statistical analysis are also described for individual experimental approaches in the Methods Details section above.
DATA AND SOFTWARE AVAILABILITY
The following software was used in this study: Graphpad Prism (plotting data), Micro-Manager (image acquisition), Adobe Illustrator & Adobe Photoshop (image preparation), FlowJo (analysis of flow cytometry data) and the INSeq_pipeline_v2 package provided by the Andrew Goodman laboratory (analysis of INseq data). See Key Resources Table.
Supplementary Material
Table S1: Summary of the results of the FAST-INSeq screen. Related to Figure 1.
Table S2: Genes with fewer than two independent transposon insertions in the library used for the FAST-INSeq screen. Related to Figure 1.
Table S3: Mutants over-represented in the post-infection pool compared to the inoculum pool. Related to Figure 1.
Table S4: Mutants over-represented in the inoculum pool compared to the post-infection pool. Related to Figure 2.
Table S5: Mutants over-represented in the high fluorescence pool compared to the low fluorescence pool. Related to Figure 2.
Table S6: List of strains used in this study (related to Star Methods).
Table S7: List of Plasmids used in this study (related to STAR Methods).
Highlights.
Developed a genetic method to probe the regulation of intracellular typhoid toxin expression
The PhoP/Q two-component system and SlyA activate toxin expression during infection
The histone-like protein H-NS silences toxin expression under non-inducing conditions
Toxin expression requires bacterial localization within Salmonella containing vacuoles
Acknowledgments
We thank members of the Galán laboratory for careful review of this manuscript and Eduardo Groisman for useful suggestions and critical review of the manuscript. C.C.F. was supported in part by a Postdoctoral Fellowship from the Canadian Institutes of Health Research. This work was supported by NIH grant AI079022 (to J.E.G.).
Footnotes
AUTHOR CONTRIBUTIONS
C.C.F. was involved in the design and interpretation of experiments and conducted all experiments shown. J.E.G. was involved in the design, interpretation and supervision of this study. C.C.F and J.E.G. wrote the paper.
Publisher's Disclaimer: This is a PDF file of an unedited manuscript that has been accepted for publication. As a service to our customers we are providing this early version of the manuscript. The manuscript will undergo copyediting, typesetting, and review of the resulting proof before it is published in its final citable form. Please note that during the production process errors may be discovered which could affect the content, and all legal disclaimers that apply to the journal pertain.
References
- Bader MW, Sanowar S, Daley ME, Schneider AR, Cho U, Xu W, Klevit RE, Le Moual H, Miller SI. Recognition of antimicrobial peptides by a bacterial sensor kinase. Cell. 2005;122:461–472. doi: 10.1016/j.cell.2005.05.030. [DOI] [PubMed] [Google Scholar]
- Beuzon CR, Meresse S, Unsworth KE, Ruiz-Albert J, Garvis S, Waterman SR, Ryder TA, Boucrot E, Holden DW. Salmonella maintains the integrity of its intracellular vacuole through the action of SifA. Embo J. 2000;19:3235–3249. doi: 10.1093/emboj/19.13.3235. [DOI] [PMC free article] [PubMed] [Google Scholar]
- Chang SJ, Song J, Galan JE. Receptor-Mediated Sorting of Typhoid Toxin during Its Export from Salmonella Typhi-Infected Cells. Cell Host Microbe. 2016;20:682–689. doi: 10.1016/j.chom.2016.10.005. [DOI] [PMC free article] [PubMed] [Google Scholar]
- Charles R, Harris J, Chase M, Lebrun L, Sheikh A, LaRocque R, Logvinenko T, Rollins S, Tarique A, Hohmann E, et al. Comparative proteomic analysis of the PhoP regulon in Salmonella enterica serovar Typhi versus Typhimurium. PLoS One. 2009;4:e6994. doi: 10.1371/journal.pone.0006994. [DOI] [PMC free article] [PubMed] [Google Scholar]
- Checroun C, Wehrly TD, Fischer ER, Hayes SF, Celli J. Autophagy-mediated reentry of Francisella tularensis into the endocytic compartment after cytoplasmic replication. Proc Natl Acad Sci U S A. 2006;103:14578–14583. doi: 10.1073/pnas.0601838103. [DOI] [PMC free article] [PubMed] [Google Scholar]
- Choi J, Groisman EA. Acidic pH sensing in the bacterial cytoplasm is required for Salmonella virulence. Mol Microbiol. 2016;101:1024–1038. doi: 10.1111/mmi.13439. [DOI] [PMC free article] [PubMed] [Google Scholar]
- Crump JA, Luby SP, Mintz ED. The global burden of typhoid fever. Bull World Health Organ. 2004;82:346–353. [PMC free article] [PubMed] [Google Scholar]
- Dalebroux ZD, Matamouros S, Whittington D, Bishop RE, Miller SI. PhoPQ regulates acidic glycerophospholipid content of the Salmonella Typhimurium outer membrane. Proc Natl Acad Sci U S A. 2014;111:1963–1968. doi: 10.1073/pnas.1316901111. [DOI] [PMC free article] [PubMed] [Google Scholar]
- Dalebroux ZD, Miller SI. Salmonellae PhoPQ regulation of the outer membrane to resist innate immunity. Curr Opin Microbiol. 2014;17:106–113. doi: 10.1016/j.mib.2013.12.005. [DOI] [PMC free article] [PubMed] [Google Scholar]
- Demarre G, Guerout AM, Matsumoto-Mashimo C, Rowe-Magnus DA, Marliere P, Mazel D. A new family of mobilizable suicide plasmids based on broad host range R388 plasmid (IncW) and RP4 plasmid (IncPalpha) conjugative machineries and their cognate Escherichia coli host strains. Res Microbiol. 2005;156:245–255. doi: 10.1016/j.resmic.2004.09.007. [DOI] [PubMed] [Google Scholar]
- Deng L, Song J, Gao X, Wang J, Yu H, Chen X, Varki N, Naito-Matsui Y, Galan JE, Varki A. Host adaptation of a bacterial toxin from the human pathogen Salmonella Typhi. Cell. 2014;159:1290– 1299. doi: 10.1016/j.cell.2014.10.057. [DOI] [PMC free article] [PubMed] [Google Scholar]
- Dougan G, Baker S. Salmonella enterica serovar Typhi and the pathogenesis of typhoid fever. Annu Rev Microbiol. 2014;68:317–336. doi: 10.1146/annurev-micro-091313-103739. [DOI] [PubMed] [Google Scholar]
- Fang FC, Rimsky S. New insights into transcriptional regulation by H-NS. Curr Opin Microbiol. 2008;11:113–120. doi: 10.1016/j.mib.2008.02.011. [DOI] [PMC free article] [PubMed] [Google Scholar]
- Frohman MA, Dush MK, Martin GR. Rapid production of full-length cDNAs from rare transcripts: amplification using a single gene-specific oligonucleotide primer. Proc Natl Acad Sci U S A. 1988;85:8998–9002. doi: 10.1073/pnas.85.23.8998. [DOI] [PMC free article] [PubMed] [Google Scholar]
- Galán J. Typhoid toxin provides a window into typhoid fever and the biology of Salmonella Typhi. Proc Natl Acad Sci U S A. 2016;113:6338–6344. doi: 10.1073/pnas.1606335113. [DOI] [PMC free article] [PubMed] [Google Scholar]
- Galan JE. Salmonella interactions with host cells: type III secretion at work. Annu Rev Cell Dev Biol. 2001;17:53–86. doi: 10.1146/annurev.cellbio.17.1.53. [DOI] [PubMed] [Google Scholar]
- Galan JE. Typhoid toxin provides a window into typhoid fever and the biology of Salmonella Typhi. Proc Natl Acad Sci U S A. 2016;113:6338–6344. doi: 10.1073/pnas.1606335113. [DOI] [PMC free article] [PubMed] [Google Scholar]
- Galán JE, Curtiss R., III Distribution of the invA, -B, -C, and -D genes of Salmonella typhimurium among other Salmonella serovars: invA mutants of Salmonella typhi are deficient for entry into mammalian cells. Infect Immun. 1991;59:2901–2908. doi: 10.1128/iai.59.9.2901-2908.1991. [DOI] [PMC free article] [PubMed] [Google Scholar]
- Galan JE, Curtiss R., 3rd Distribution of the invA, -B, -C, and -D genes of Salmonella typhimurium among other Salmonella serovars: invA mutants of Salmonella typhi are deficient for entry into mammalian cells. Infect Immun. 1991;59:2901–2908. doi: 10.1128/iai.59.9.2901-2908.1991. [DOI] [PMC free article] [PubMed] [Google Scholar]
- Garcia Vescovi E, Soncini FC, Groisman EA. Mg2+ as an extracellular signal: environmental regulation of Salmonella virulence. Cell. 1996;84:165–174. doi: 10.1016/s0092-8674(00)81003-x. [DOI] [PubMed] [Google Scholar]
- Gawronski JD, Wong SM, Giannoukos G, Ward DV, Akerley BJ. Tracking insertion mutants within libraries by deep sequencing and a genome-wide screen for Haemophilus genes required in the lung. Proc Natl Acad Sci U S A. 2009;106:16422–16427. doi: 10.1073/pnas.0906627106. [DOI] [PMC free article] [PubMed] [Google Scholar]
- Gonzalez-Escobedo G, Marshall JM, Gunn JS. Chronic and acute infection of the gall bladder by Salmonella Typhi: understanding the carrier state. Nat Rev Microbiol. 2011;9:9–14. doi: 10.1038/nrmicro2490. [DOI] [PMC free article] [PubMed] [Google Scholar]
- Goodman AL, McNulty NP, Zhao Y, Leip D, Mitra RD, Lozupone CA, Knight R, Gordon JI. Identifying genetic determinants needed to establish a human gut symbiont in its habitat. Cell Host Microbe. 2009;6:279–289. doi: 10.1016/j.chom.2009.08.003. [DOI] [PMC free article] [PubMed] [Google Scholar]
- Goodman AL, Wu M, Gordon JI. Identifying microbial fitness determinants by insertion sequencing using genome-wide transposon mutant libraries. Nat Protoc. 2011;6:1969–1980. doi: 10.1038/nprot.2011.417. [DOI] [PMC free article] [PubMed] [Google Scholar]
- Gopinath S, Carden S, Monack D. Shedding light on Salmonella carriers. Trends Microbiol. 2012;20:320–327. doi: 10.1016/j.tim.2012.04.004. [DOI] [PubMed] [Google Scholar]
- Groisman EA. The pleiotropic two-component regulatory system PhoP-PhoQ. J Bacteriol. 2001;183:1835–1842. doi: 10.1128/JB.183.6.1835-1842.2001. [DOI] [PMC free article] [PubMed] [Google Scholar]
- Guidi R, Levi L, Rouf S, Puiac S, Rhen M, Frisan T. Salmonella enterica delivers its genotoxin through outer membrane vesicles secreted from infected cells. Cell Microbiol. 2013;15:2034–2050. doi: 10.1111/cmi.12172. [DOI] [PubMed] [Google Scholar]
- Guzman LM, Belin D, Carson MJ, Beckwith J. Tight regulation, modulation, and highlevel expression by vectors containing the arabinose PBAD promoter. J Bacteriol. 1995;177:4121–4130. doi: 10.1128/jb.177.14.4121-4130.1995. [DOI] [PMC free article] [PubMed] [Google Scholar]
- Haghjoo E, Galan JE. Salmonella typhi encodes a functional cytolethal distending toxin that is delivered into host cells by a bacterial-internalization pathway. Proc Natl Acad Sci U S A. 2004;101:4614–4619. doi: 10.1073/pnas.0400932101. [DOI] [PMC free article] [PubMed] [Google Scholar]
- Haghjoo E, Galan JE. Identification of a transcriptional regulator that controls intracellular gene expression in Salmonella Typhi. Mol Microbiol. 2007;64:1549–1561. doi: 10.1111/j.1365-2958.2007.05754.x. [DOI] [PubMed] [Google Scholar]
- Hodak H, Galan JE. A Salmonella Typhi homologue of bacteriophage muramidases controls typhoid toxin secretion. EMBO Rep. 2013;14:95–102. doi: 10.1038/embor.2012.186. [DOI] [PMC free article] [PubMed] [Google Scholar]
- Jones BD, Lee CA, Falkow S. Invasion by Salmonella typhimurium is affected by the direction of flagellar rotation. Infect Immun. 1992;60:2475–2480. doi: 10.1128/iai.60.6.2475-2480.1992. [DOI] [PMC free article] [PubMed] [Google Scholar]
- Kato A, Groisman E. The PhoQ/PhoP regulatory network of Salmonella enterica. Adv Exp Med Biol. 2008;631:7–21. 7–21. doi: 10.1007/978-0-387-78885-2_2. [DOI] [PubMed] [Google Scholar]
- Knodler LA, Nair V, Steele-Mortimer O. Quantitative assessment of cytosolic Salmonella in epithelial cells. PLoS One. 2014;9:e84681. doi: 10.1371/journal.pone.0084681. [DOI] [PMC free article] [PubMed] [Google Scholar]
- Knodler LA, Vallance BA, Celli J, Winfree S, Hansen B, Montero M, Steele-Mortimer O. Dissemination of invasive Salmonella via bacterial-induced extrusion of mucosal epithelia. Proc Natl Acad Sci U S A. 2010;107:17733–17738. doi: 10.1073/pnas.1006098107. [DOI] [PMC free article] [PubMed] [Google Scholar]
- Lucchini S, Rowley G, Goldberg MD, Hurd D, Harrison M, Hinton JC. H-NS mediates the silencing of laterally acquired genes in bacteria. PLoS Pathog. 2006;2:e81. doi: 10.1371/journal.ppat.0020081. [DOI] [PMC free article] [PubMed] [Google Scholar]
- Maxson ME, Darwin AJ. Identification of inducers of the Yersinia enterocolitica phage shock protein system and comparison to the regulation of the RpoE and Cpx extracytoplasmic stress responses. J Bacteriol. 2004;186:4199–4208. doi: 10.1128/JB.186.13.4199-4208.2004. [DOI] [PMC free article] [PubMed] [Google Scholar]
- Miller JH. Experiments in Molecular Genetics. Cold Spring Harbor Laboratory Press; 1972. [Google Scholar]
- Navarre WW, Halsey TA, Walthers D, Frye J, McClelland M, Potter JL, Kenney LJ, Gunn JS, Fang FC, Libby SJ. Co-regulation of Salmonella enterica genes required for virulence and resistance to antimicrobial peptides by SlyA and PhoP/PhoQ. Mol Microbiol. 2005;56:492–508. doi: 10.1111/j.1365-2958.2005.04553.x. [DOI] [PubMed] [Google Scholar]
- Navarre WW, Porwollik S, Wang Y, McClelland M, Rosen H, Libby SJ, Fang FC. Selective silencing of foreign DNA with low GC content by the H-NS protein in Salmonella. Science. 2006;313:236–238. doi: 10.1126/science.1128794. [DOI] [PubMed] [Google Scholar]
- Norte VA, Stapleton MR, Green J. PhoP-responsive expression of the Salmonella enterica serovar typhimurium slyA gene. J Bacteriol. 2003;185:3508–3514. doi: 10.1128/JB.185.12.3508-3514.2003. [DOI] [PMC free article] [PubMed] [Google Scholar]
- Park SY, Groisman EA. Signal-specific temporal response by the Salmonella PhoP/PhoQ regulatory system. Mol Microbiol. 2014;91:135–144. doi: 10.1111/mmi.12449. [DOI] [PMC free article] [PubMed] [Google Scholar]
- Parry CM, Hien TT, Dougan G, White NJ, Farrar JJ. Typhoid fever. N Engl J Med. 2002;347:1770–1782. doi: 10.1056/NEJMra020201. [DOI] [PubMed] [Google Scholar]
- Perez JC, Latifi T, Groisman EA. Overcoming H-NS-mediated transcriptional silencing of horizontally acquired genes by the PhoP and SlyA proteins in Salmonella enterica. J Biol Chem. 2008;283:10773–10783. doi: 10.1074/jbc.M709843200. [DOI] [PMC free article] [PubMed] [Google Scholar]
- Prost LR, Daley ME, Le Sage V, Bader MW, Le Moual H, Klevit RE, Miller SI. Activation of the bacterial sensor kinase PhoQ by acidic pH. Mol Cell. 2007;26:165–174. doi: 10.1016/j.molcel.2007.03.008. [DOI] [PubMed] [Google Scholar]
- Shi Y, Latifi T, Cromie MJ, Groisman EA. Transcriptional control of the antimicrobial peptide resistance ugtL gene by the Salmonella PhoP and SlyA regulatory proteins. J Biol Chem. 2004;279:38618–38625. doi: 10.1074/jbc.M406149200. [DOI] [PubMed] [Google Scholar]
- Snavely MD, Gravina SA, Cheung TT, Miller CG, Maguire ME. Magnesium transport in Salmonella typhimurium. Regulation of mgtA and mgtB expression. J Biol Chem. 1991;266:824–829. [PubMed] [Google Scholar]
- Song J, Gao X, Galan JE. Structure and function of the Salmonella Typhi chimaeric A(2)B(5) typhoid toxin. Nature. 2013;499:350–354. doi: 10.1038/nature12377. [DOI] [PMC free article] [PubMed] [Google Scholar]
- Spano S, Liu X, Galan JE. Proteolytic targeting of Rab29 by an effector protein distinguishes the intracellular compartments of human-adapted and broad-host Salmonella. Proc Natl Acad Sci U S A. 2011;108:18418–18423. doi: 10.1073/pnas.1111959108. [DOI] [PMC free article] [PubMed] [Google Scholar]
- Spano S, Ugalde JE, Galan JE. Delivery of a Salmonella Typhi exotoxin from a host intracellular compartment. Cell Host Microbe. 2008;3:30–38. doi: 10.1016/j.chom.2007.11.001. [DOI] [PubMed] [Google Scholar]
- Stoebel DM, Free A, Dorman CJ. Anti-silencing: overcoming H-NS-mediated repression of transcription in Gram-negative enteric bacteria. Microbiology. 2008;154:2533–2545. doi: 10.1099/mic.0.2008/020693-0. [DOI] [PubMed] [Google Scholar]
- Streit WR, Entcheva P. Biotin in microbes, the genes involved in its biosynthesis, its biochemical role and perspectives for biotechnological production. Appl Microbiol Biotechnol. 2003;61:21–31. doi: 10.1007/s00253-002-1186-2. [DOI] [PubMed] [Google Scholar]
- Valdivia R, Falkow S. Bacterial genetics by flow cytometry: rapid isolation of Salmonella typhimurium acid-inducible promoters by differential fluorescence induction. Mol Microbiol. 1996;22:367– 378. doi: 10.1046/j.1365-2958.1996.00120.x. [DOI] [PubMed] [Google Scholar]
- Valdivia R, Falkow S. Fluorescence-based isolation of bacterial genes expressed within host cells. Science. 1997;277:2007–2011. doi: 10.1126/science.277.5334.2007. [DOI] [PubMed] [Google Scholar]
- van Opijnen T, Bodi KL, Camilli A. Tn-seq: high-throughput parallel sequencing for fitness and genetic interaction studies in microorganisms. Nat Methods. 2009;6:767–772. doi: 10.1038/nmeth.1377. [DOI] [PMC free article] [PubMed] [Google Scholar]
- Wang RF, Kushner SR. Construction of versatile low-copy-number vectors for cloning, sequencing and gene expression in Escherichia coli. Gene. 1991;100:195–199. [PubMed] [Google Scholar]
- Will WR, Bale DH, Reid PJ, Libby SJ, Fang FC. Evolutionary expansion of a regulatory network by counter-silencing. Nat Commun. 2014;5:5270–5277. doi: 10.1038/ncomms6270. [DOI] [PMC free article] [PubMed] [Google Scholar]
- Zwir I, Latifi T, Perez J, Huang H, Groisman E. The promoter architectural landscape of the Salmonella PhoP regulon. Mol Microbiol. 2012;84:463–485. doi: 10.1111/j.1365-2958.2012.08036.x. [DOI] [PMC free article] [PubMed] [Google Scholar]
- Zwir I, Yeo W, Shin D, Latifi T, Huang H, Groisman E. Bacterial nucleoid-associated protein uncouples transcription levels from transcription timing. MBio. 2014;5:e01485–01414. doi: 10.1128/mBio.01485-14. [DOI] [PMC free article] [PubMed] [Google Scholar]
Associated Data
This section collects any data citations, data availability statements, or supplementary materials included in this article.
Supplementary Materials
Table S1: Summary of the results of the FAST-INSeq screen. Related to Figure 1.
Table S2: Genes with fewer than two independent transposon insertions in the library used for the FAST-INSeq screen. Related to Figure 1.
Table S3: Mutants over-represented in the post-infection pool compared to the inoculum pool. Related to Figure 1.
Table S4: Mutants over-represented in the inoculum pool compared to the post-infection pool. Related to Figure 2.
Table S5: Mutants over-represented in the high fluorescence pool compared to the low fluorescence pool. Related to Figure 2.
Table S6: List of strains used in this study (related to Star Methods).
Table S7: List of Plasmids used in this study (related to STAR Methods).