

Abstract
Body temperature of endotherms shows substantial within- and between-individual variation, but the sources of this variation are not fully understood in wild animals. Variation in body temperature can indicate how individuals cope with their environment via metabolic or stress-induced effects, both of which may relate to depletion of energy reserves. Body condition can reflect heat production through changes to metabolic rate made to protect energy reserves. Additionally, changes in metabolic processes may be mediated by stress-related glucocorticoid secretion, which is associated with altered blood-flow patterns that affect regional body temperatures. Accordingly, both body condition and glucocorticoid secretion should relate to body temperature. We used thermal imaging, a novel non-invasive method of temperature measurement, to investigate relationships between body condition, glucocorticoid secretion and body surface temperature in wild blue tits (Cyanistes caeruleus). Individuals with lower body condition had lower eye-region surface temperature in both non-breeding and breeding seasons. Eye-region surface temperature was also negatively correlated with baseline circulating glucocorticoid levels in non-breeding birds. Our results demonstrate that body surface temperature can integrate multiple aspects of physiological state. Consequently, remotely-measured body surface temperature could be used to assess such aspects of physiological state non-invasively in free-living animals at multiple life history stages.
Introduction
Endotherms maintain a high and relatively constant body temperature. There is, nonetheless, substantial within- and between-individual variation in body temperature among endotherms1. Body temperature is a key physiological parameter for understanding thermoregulation, physiology, behaviour and responses to environmental change2. Yet, understanding of the factors contributing to body temperature variation in the natural environment remains patchy3–5, partly due to difficulties in measuring body temperature in the wild.
Variation in body temperature can reveal how individuals cope with their environment through two main pathways. Firstly, individuals challenged by environmental conditions may show altered hypothalamic-pituitary-adrenal (HPA) axis activity, and glucocorticoid secretion6. Activation of the HPA axis can also be associated with activation of the sympathetic-adrenal-medullary (SAM) system7. SAM system activity causes rapid release of catecholamines from the adrenal medulla, resulting in a ‘fight or flight’ response. During this response, core body temperature increases8, a phenomenon known as stress-induced hyperthermia9. Stress-induced hyperthermia is widespread amongst endotherms, and has been detected predominantly as a relatively short-lived (<1 h) response to acute stressors10. However, longer term (≥24 h) increases in core body temperature have also been reported in response to social stress11, and with repeated stressor application12–14.
Secondly, body temperature can reflect metabolic effects, which may also relate to glucocorticoid secretion6. For example, chronically lowered core body temperature may be linked to energy reserve depletion, where metabolic rate, and therefore metabolic heat production, is reduced to preserve energy15. Simultaneous decreases in metabolic heat production and body temperature have been reported in individuals experiencing poor feeding conditions16,17. Also, experimentally elevated circulating glucocorticoid concentrations have been shown both to reduce metabolic rate18,19, and increase metabolic rate variability20. Consequently, variation in body temperature is predicted to reflect changes in glucocorticoid levels, SAM system activity, energy reserves and metabolic rate.
Assessing body temperature in free-living animals is technically demanding2. However, new methods of measuring body surface temperature using thermal imaging21 present unique opportunities to determine variation in body temperature (and therefore physiological state), remotely and non-invasively in free living animals. One component of the SAM system response contributing to increased core body temperature during stress-induced hyperthermia is sympathetically-mediated cutaneous vasoconstriction22. Arteriovenous anastomoses at the body periphery act as ‘shunts’, permitting passage of blood between arteries and veins on precapillary blood vessels23. This redirection of blood away from the body surface (presumably to prepare for ‘fight-or-flight’ by diverting blood to regions with the greatest metabolic need, and/or to minimise potential blood loss from injury to vulnerable areas22), lowers body surface temperature24. Body surface temperature is also affected by metabolic processes. For an endotherm to maintain a constant core body temperature, heat production must equal heat loss25. Accordingly, sustained shifts in the amount of heat transferred to the environment from the body surface can indicate changes to metabolic rate26 (although alterations to the insulative capacity of pelage/plumage, may also affect heat loss27,28). Heat transfer to the environment is partly mediated by changes in body surface temperature, which alter the temperature gradient between the body surface and the environment29. Hence, remotely measured body surface temperature may provide useful information regarding a number of aspects of the physiological state of free-living animals.
In this study, we examined the relationship between body surface temperature, measured using thermal imaging from the eye region (Teye), and physiological state in free-living blue tits (Cyanistes caeruleus). Specifically, we tested the hypotheses that lower Teye is associated with lower body condition (indicating reduced energy reserves), and higher circulating glucocorticoid concentrations (indicating HPA axis activity).
Results
Teye ranged from 25.2–33.6 °C (29.6 ± 0.09 °C, n = 372 observations from 14 individuals) in the breeding birds, and was higher than the Teye of 26.5–31.2 °C (28.7 ± 0.23 °C, n = 31) recorded in the overwintering birds (t = 1.98, df = 43, p = 0.05). Additionally, Teye was lower when breeding birds were about to enter the nest box (‘In’, n = 178) than when they left (‘Out’ n = 189), or when they approached, but did not enter (‘No Entry/Exit’ n = 5) (Table 1). Compared to winter Teye measurements, mean individual Teye measured during ‘Out’ events was higher (t = 2.70, df = 42, p = 0.01), whereas Teye measured during ‘In’ events did not differ (t = 0.68, df = 43, p = 0.50).
Table 1.
Summary of statistical models relating body condition index with Teye, accounting for air temperature and humidity in (a) winter (GLM model), and (b) breeding season (GLMM model); r is the parameter effect size. In the breeding season whether birds were entering (Event Type = ‘In’, reference value in GLMM), leaving (Event Type = ‘Out’), or approaching the nest box without entering (Event Type = ‘No Entry/Exit’) was also considered (see Methods).
| Response Variable: Baseline Eye Region Temperature (Teye) | |||||
|---|---|---|---|---|---|
| Fixed Effects | Estimate ± 95% CI | t-value | p-value | r | |
| a. | Intercept | 26.44 ± 1.05 | 49.24 | <0.0001 | |
| Body Condition Index | 0.69 ± 0.66 | 2.05 | 0.05 | 0.37 | |
| Air Temperature | 0.29 ± 0.13 | 4.45 | 0.0001 | 0.65 | |
| Relative Humidity | −0.02 ± 0.02 | 1.61 | 0.12 | 0.30 | |
| Model adjusted R2 = 0.47 | |||||
| b. | Intercept | 25.87 ± 1.39 | 36.52 | <0.0001 | |
| Body Condition Index | 0.86 ± 0.69 | 2.43 | 0.028 | 0.09 | |
| Air Temperature | 0.23 ± 0.09 | 4.76 | <0.0001 | 0.17 | |
| Relative Humidity | −0.02 ± 0.02 | 1.14 | 0.26 | 0.04 | |
| Event Type (Out) | 1.01 ± 0.18 | 11.19 | <0.0001 | ||
| Event Type (No Entry/Exit) | 1.24 ± 0.78 | 3.12 | 0.002 | ||
| Random Effect | Variance | SD | p-value | ||
| Bird ID | 0.77 | 0.88 | <0.0001 | ||
| Model marginal R2 = 0.35 | |||||
Teye increased with body condition in both seasons (Fig. 1) after accounting for a positive effect of Ta on Teye (Table 1). While the winter and breeding season body condition models differ structurally (and so cannot be directly compared), confidence intervals for the body condition index parameter estimates largely overlap (Table 1), indicating similar relationships. The relationship between Teye and CORT was only investigated in winter. Baseline free CORT concentrations varied from 0.007–0.381 ng/ml (0.11 ± 0.02 ng/ml, n = 31), while baseline total CORT concentrations varied between 0.999–18.61 ng/ml (8.29 ± 0.65 ng/ml, n = 31). Of the total CORT concentration, 1.41 ± 0.18% was available as free CORT. Sampling latency was unrelated to baseline free or total CORT (free CORT F1,29 = 0.002, p = 0.97, total CORT F1,29 = 0.93, p = 0.34). After controlling for ambient conditions, Teye during winter was negatively associated with baseline free CORT concentration (Table 2a, Fig. 2), but was not associated with baseline total CORT concentration (Table 2b). Neither baseline free nor total CORT were related to body condition index (free CORT F1,29 = 0.40, p = 0.53, total CORT F1,29 = 2.19, p = 0.15).
Figure 1.
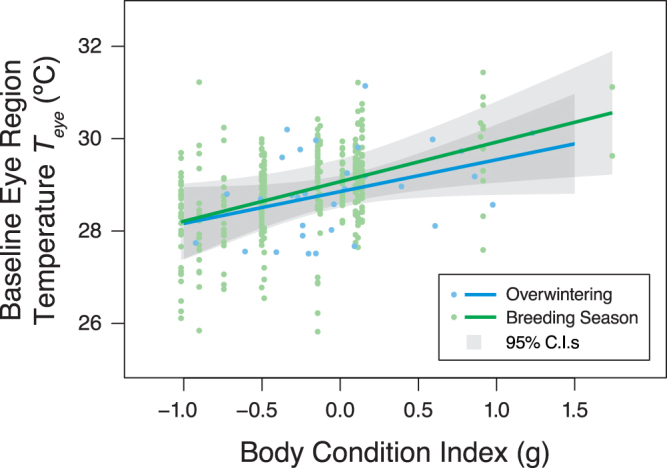
Model predictions of relationships between baseline eye region temperature (Teye) and body condition index. Zero represents mean condition, with positive and negative values indicating body mass above or below average, respectively, for a given wing length. For the breeding season data, the model prediction is conditional on event type being when birds were entering the nest box (event type ‘In’), as opposed to exiting (event type ‘Out’) – see methods. This approach was chosen as Teye measured during ‘In’ events is more comparable to that of overwintering birds, than Teye measured during ‘Out’ events. ‘In’ events share similar activity levels with overwintering birds entering the trap, and do not involve the residual warming effect of the nest box microclimate on Teye during ‘Out’ events (Table 2b and see Discussion).
Table 2.
Summary of GLM models relating air temperature, humidity and (a) baseline free CORT or (b) baseline total CORT with Teye in winter; r is the parameter effect size.
| Response Variable: Baseline Eye Region Temperature (Teye) | |||||
|---|---|---|---|---|---|
| Fixed Effects | Estimate ± 95% CI | t-value | p-value | r | |
| a. | Intercept | 30.70 ± 2.79 | 21.50 | <0.0001 | |
| Baseline free CORT | −4.99 ± 3.84 | 2.55 | 0.017 | 0.44 | |
| Air temperature | 0.19 ± 0.13 | 2.90 | 0.007 | 0.49 | |
| Relative Humidity | −0.034 ± 0.022 | 3.09 | 0.005 | 0.51 | |
| Model adjusted R2 = 0.56 | |||||
| b. | Intercept | 28.71 ± 0.41 | 135.86 | <0.0001 | |
| Baseline total CORT | 0.028 ± 0.098 | 0.55 | 0.586 | 0.11 | |
| Air Temperature | 0.24 ± 0.14 | 3.25 | 0.003 | 0.53 | |
| Relative Humidity | −0.025 ± 0.022 | 2.18 | 0.008 | 0.34 | |
| Model adjusted R2 = 0.48 | |||||
Figure 2.
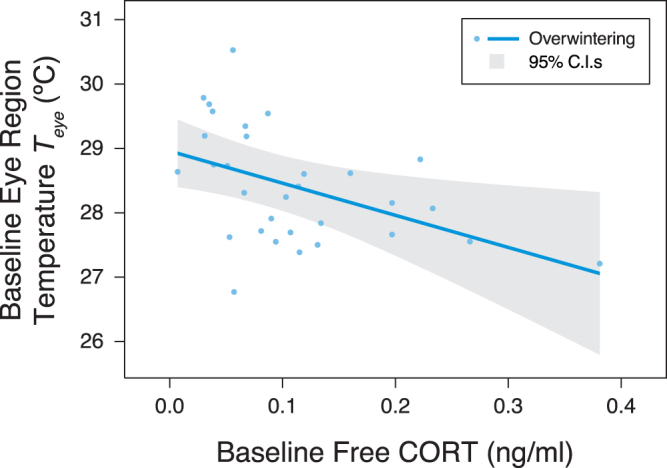
Model prediction of relationship between baseline eye region temperature and baseline free CORT.
Discussion
Baseline eye region surface temperature (Teye) was related both to body condition and baseline glucocorticoid levels in undisturbed wild blue tits. This suggests that individual differences in body surface temperature can reflect physiological state. Reduced metabolic rate in individuals with depleted energy reserves, and/or stress-related vasoconstriction may have brought about the observed between-individual variation in Teye.
The level of variation in Teye observed in this study was comparable in extent to that previously reported for both surface and subcutaneous measures of body temperature in parids4. Teye was influenced by ambient conditions, with Ta and relative humidity explaining a significant proportion of variation. The positive relationship between Teye and Ta is consistent with other studies showing surface temperature in small birds to be sensitive to environmental conditions3,4,30,31. Despite this, high repeatabilities of surface temperature (>0.7) have been reported for periods up to 40 min in great tits (Parus major)4. Yet, even when accounting for these environmental influences on Teye, there remained between-individual variation in Teye that was related to measures of physiological state.
In the breeding season, Teye was also affected by event type, with higher values of Teye being recorded during ‘Out’ and ‘No Entry/Exit’ events. As mean individual Teye from ‘In’ events did not differ from Teye measured in winter, the overall difference in Teye between seasons must relate to the presence of Teye measurements from ‘Out’ and ‘No Entry/Exit’ events in the breeding season data. Differences in Teye between event types in the breeding birds most likely result from a composite of behavioural differences, and the warming effect of having spent time in the nest box microclimate. While birds entering the nest box were rarely stationary, birds leaving the nest box often paused (presumably to check for potential hazards) before exiting. Similarly, birds which entered the field of view of the camera, but did not enter or exit also tended to spend more time stationary than birds entering the nest box. As negative measurement error during thermal imaging of small passerines results predominantly from motion blur21, values of Teye tend to increase with the inactivity of the subject. However, it also remains possible that elevated Teye in ‘No Entry/Exit’ events was a statistical artefact relating to their limited number.
Teye was positively and similarly related to body condition at two stages of the annual cycle. Body condition can be linked to body surface temperature as a result of variation in the insulative capacity of plumage. Anatomical modulation of plumage insulation capacity post-moult is thought to be relatively limited32. Nevertheless, parasite-induced changes to feather mass have been shown to affect heat loss to the environment, metabolic rate, and body condition in feral rock doves (Columba livia)28. Reduced feather mass was associated with increased heat loss and metabolic rate, and a continuous decline in body condition over the course of the nine-month study. The authors attributed these outcomes to the heightened energy cost of maintaining core body temperature in birds with lower feather mass, as core body temperature was similar across all birds sampled regardless of plumage insulation capacity. Increased heat loss caused by reduced insulation occurs due to increased body temperature at the interface with the environment, which steepens the ambient temperature gradient. As a consequence, it seems doubtful that reduced plumage insulation capacity was an important factor in our study, as we found lower body condition was associated with lower body surface temperature.
Instead, the observed relationship between Teye and body condition may indicate a response to environmental challenge. For example, reductions in metabolic rate, and resulting heat production, can occur in individuals experiencing poor feeding conditions16. At low ambient temperatures, reducing body temperature can diminish the temperature gradient by which heat is lost from the body, offsetting thermoregulatory costs5. Both processes can provide energy savings for birds with limited reserves. Environmental challenges may not only reduce body condition and induce changes to metabolic rate, but can also lead to physiological stress, and changes in HPA activity33. Equally, as HPA activity directly affects metabolic rate18,19, circulating glucocorticoid levels may act as mediators of metabolic responses to environmental challenges. We found that after accounting for ambient conditions, Teye was also positively related to free, but not total baseline CORT levels. If free CORT concentrations, body condition and Teye were all indicative of physiological stress in this study, then a relationship between body condition and free CORT might also have been expected, in addition to those observed between Teye and body condition, and Teye and free CORT. We did not find such an association, although this may be a result of the restricted sample sizes achieved in this study, when compared with others reporting relationships between glucocorticoid levels and body condition in birds34–36. It is also possible that physiological stress and energy reserves are independently linked to Teye. Alternatively, a relationship between Teye and baseline free CORT could be mediated by locomotor activity. Increased CORT levels generally stimulate increased locomotor activity37, which would be expected to increase heat production, and therefore surface temperature. However, we found that higher levels of baseline free CORT were associated with lower Teye, indicating that locomotor activity could not have been responsible for the observed relationship. Also, variation in locomotor activity prior to entering the trap (i.e. flight distance/duration) could have influenced Teye, potentially confounding relationships with CORT and/or body condition. The density of the forest in which the fieldwork took place meant it was not possible to meaningfully assess flight distance or duration. Nonetheless, our ability to detect relationships between Teye and CORT/body condition, without taking flight distance/duration into account, suggests their confounding effects were limited.
Free baseline CORT levels observed in this study were within the range of those found elsewhere in small passerines38–40. Despite this, the free proportion of total CORT we report (1.4 ± 1.0%) appears low when compared to the commonly cited 5–10%41. Low proportions of free CORT to total CORT could be a result of two factors. Firstly, tissue glucocorticoid receptors may respond differently between groups or species, perhaps meaning fewer glucocorticoids are necessary to generate the necessary response42. Secondly, relatively high concentrations of total CORT may mean that lower proportions of free CORT are sufficient to trigger desired responses. In this context, it is interesting to note that total CORT levels observed in this study were higher than the majority of values reported for blue tits34,38,43,44.
As sampling latency was unrelated to CORT levels, our values most likely represent true baselines, and were not overestimated due to the acute stress of trapping and handling. Teye in free-living blue tits also responds to acute stress, but on a shorter time scale than CORT21. Teye could potentially be affected by the acute stress of entering the trap. Yet, this is unlikely as the traps were left in place at least one month prior to sampling to encourage habituation. Nevertheless, potential acute stressors experienced shortly before entry into the trap, and/or surface temperature responses to anticipation and consumption of food45 could mask any relationship between Teye and baseline glucocorticoids/body condition. That we found the predicted relationship suggests our results are conservative in both respects. Furthermore, when using baited traps, there is the possibility of sampling bias relating to individual differences in personality46. Shy, neophobic individuals are less likely to enter traps of the kind used in this study, potentially resulting in a sampling bias towards bold individuals. However, shy individuals have been shown to exhibit higher total CORT concentrations47,48. Therefore, given that the mean total CORT concentrations we report were comparatively high34,38,43,44, a bias towards bold individuals in our sample appears unlikely.
Whether free or total CORT concentrations play a greater biological role remains an open question6. If only the free proportion of total CORT is physiologically active49, and HPA axis activity is linked to stress-induced hyperthermia, then only a relationship between Teye and free CORT would be expected, as found in this study. A further possibility could involve alternative mechanisms predicted to be responsible for differential changes in free and total CORT concentrations. Subjecting white crowned sparrows (Zonotrichia leucophrys) to 23 h of fasting resulted in increased free CORT concentrations, but not total CORT50. This was attributed to a drop in CBG binding, related either to CORT release inducing CBG breakdown, or to stress-induced elevations of CORT being overridden by the daily peak in CORT secretion. Both processes could potentially lead to differing relationships between Teye and free/total CORT, although neither seem likely here. If free CORT concentrations increased with CORT secretion, a correlation would be expected between total and free CORT. This was not the case in this study (Spearman’s ρ = 0.29, p = 0.11). Equally, the daily peak in CORT secretion would be expected to occur at/towards the end of the inactive period51. As all sampling during this study took place within the active period, it seems unlikely that the daily peak would have influenced our measurements of CORT. Finally, it may also be possible that while Teye and free CORT appear associated, they are actually only exhibiting synchronized natural variation with circadian rhythms. However, if this were the case, a clear relationship between free CORT and time of day would be expected, but this was not detected (GLM; time of day F1,29 = 0.0003, p = 0.99).
Our study showed that variation in body surface temperature and body condition were similarly associated during both non-breeding and breeding seasons, and that body surface temperature was related to baseline circulating glucocorticoid levels in non-breeding birds. Lower body surface temperature in individuals with lower body condition could relate to reductions in metabolic rate made to conserve energy, or it could be linked with stress responses to poor food intake. The two explanations are not mutually exclusive, but the lack of relationship between CORT and body condition demonstrates that body surface temperature can integrate multiple aspects of physiological state. Hence, remote measurement of body surface temperature using thermal imaging could provide a novel, non-invasive means of assessing the physiological state of free-living animals. Our results highlight important relationships between body temperature and underlying physiology for which mechanistic understanding remains incomplete. Investigations targeting the processes linking body condition, glucocorticoid secretion and body temperature would be of particular value in this respect. Moreover, exploration of relationships between body surface temperature and further biomarkers of physiological state (e.g. plasma protein concentrations, cholinesterase activity, heterophil/lymphocyte ratio, telomere lengths) may not only help distinguish effects of varying energy reserves and physiological stress, but could also yield opportunities to infer additional parameters non-invasively.
Methods
Fieldwork
Data were collected from overwintering and breeding blue tits occupying oak woodland on the eastern shore of Loch Lomond (56.13°N, 4.13°W). Birds were recorded on thermal videos either entering walk-in box traps (winter), or their nest box (breeding season) (see Thermal Imaging section below). In winter, we trapped 31 blue tits. Once a single bird entered the trap it was allowed to feed undisturbed while thermal videos were recorded. The trap was then closed, the bird retrieved and a blood sample taken to measure baseline circulating total and free corticosterone concentrations (see Glucocorticoid Assays section below). During the breeding season, thermal videos were recorded of 14 birds as they repeatedly visited their brood, over a period of 30 min on day 13 after hatching. Birds sampled during the breeding season were not part of the winter study. All fieldwork was approved by the UK Home Office, and carried out in accordance with the Animals (Scientific Procedures) Act 1986.
During the winter of 2013/14, walk-in box traps21 were installed at four locations (inter-trap distance 0.8 ± 0.2 km) across the study site. To habituate visiting birds to the recording set-up and avoid sampling bias towards bold individuals, the traps were continuously baited with granulated peanuts for >1 month before sampling. The distribution of individual body condition index (calculated as the residuals of an ordinary least squares regression of mass against wing chord cubed52) from birds sampled during this study was not significantly different to that from mist-netted birds caught at the same site during the same time of year (first two weeks in March), in three previous years (2011–2013) (Kolmogorov-Smirnov test, D = 0.224, p = 0.225, Fig. 3). This indicated no detectable effect of sampling bias in terms of body condition relating to the use of baited traps in this study, and notably no bias towards birds with particularly low energy reserves.
Figure 3.
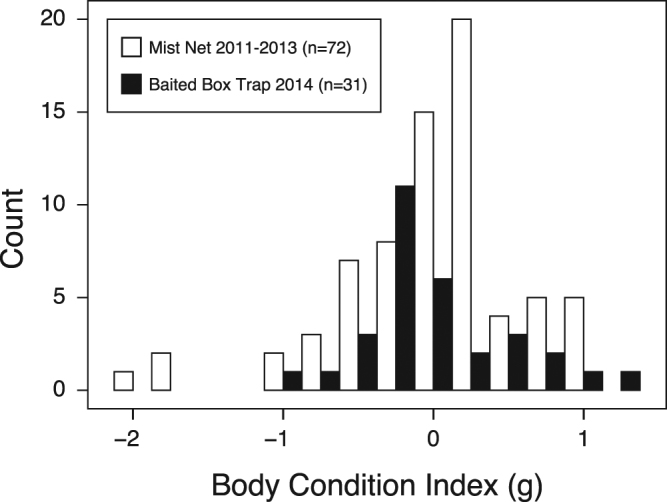
Body condition index distributions for birds caught using baited box traps during the winter of 2014 in this study, and mist-netted birds caught at the same site, during the same time of year (first two weeks in March) in three previous years (2011, 2012, 2013). A body condition index of zero represents mean condition, with positive and negative values indicating body mass above or below average, respectively, for a given wing length.
The 31 blue tits caught in the winter were trapped during 10–13 March 2014 between 08:18 and 16:52 (mean sampling time of day 12:50 ± 32 min). The end of winter was selected as the period in winter when the greatest differences in individual state would be expected, and when relationships between body temperature and state would be most detectable. The relatively short sampling period was chosen to minimise (and control for) environmental variation, as much as possible, as environmental conditions can influence body temperature and physiological processes affecting state53,54. Daytime sampling was chosen to minimise the effect of circadian changes in body temperature55.
Single birds entering the trap were filmed using a thermal imaging camera (see below), while feeding undisturbed for an average of 4.2 ± 0.16 s, before the trap was closed by the experimenter (using a fishing line, from a concealed position). The 4.2 s duration is sufficient to obtain a representative measurement of temperature for that bird21. The bird was then retrieved by hand 17.4 ± 0.75 s after trap closure. Approximately 30 µl of blood was sampled from the jugular vein by venipuncture within 112.3 ± 3.2 s of trap closure, and immediately placed on ice. Blood samples were subsequently separated into plasma and red blood cells by centrifugation (10 min at 2000 rpm), and the plasma used to measure baseline circulating corticosterone (CORT) concentration. Before the birds were released, we identified sex from plumage characteristics56, and measured body mass (to the nearest 0.1 g), and maximal wing chord (to the nearest 0.5 mm). Each bird was sampled only once. Repeated trapping/sampling was avoided by establishing the identity of ringed birds from their colour ring combination, either before shutting the trap, or during handling. Trapped unringed birds were fitted with a uniquely identifying colour ring combination after sampling, prior to being set free.
During the breeding season, breeding parents were filmed while entering or exiting their nest box using a thermal imaging camera mounted in front of the nest box (Schwegler 1B, with 32 mm entrance hole). To habituate the birds to the presence of the camera, a dummy camera was installed at each nest ≥7 days prior to filming, and left in place. The dummy camera was replaced with the actual camera immediately prior to filming on day 13 after hatching (day of hatching = day 0; filming took place during 5–16 June 2015, between 10:09 and 20:31, mean sampling time 13:05 ± 8 min). Daytime sampling was again chosen to minimise the effect of circadian changes in body temperature. Once the camera was installed, thermal video was recorded for 45 minutes. To avoid acute stress-related changes in body temperature resulting from disturbance associated with installation, only body temperature measures from video recorded after the initial 15 minutes were included in the analyses. To distinguish between the two parents at each nest, we caught at least one of them (14 individuals breeding in 12 randomly selected nests) on day 8–9 after hatching (between 01–11 June 2015), and fitted an RFID tag (125 kHz, 2.3 mm, EM4102 Bird Tag, IB Technology Glenfield, Leicestershire) mounted on a leg ring. Parents were then identified on the thermal videos using a combination of the records of the RFID tag logger mounted in the nest box entrance (Nature Counters, Maidstone, Kent; IB Technology Glenfield, Leicestershire; Francis Scientific Instruments, Ltd., Huntingdon, Cambridgeshire; University of Glasgow Bioelectronics Dept., Glasgow), and distinguishing features (e.g. leg rings) visible in the thermal images. During RFID fitting, sex was identified, and body mass/wing chord length taken for calculation of body condition index using the same techniques described above for overwintering birds.
Ambient temperature (Ta) was recorded simultaneously to the thermal imaging using a Tinytag Talk 2 Temperature Logger (Gemini Data Loggers UK, Chichester, West Sussex) mounted on the box trap (winter) or nest box (breeding season). In winter, relative humidity was recorded every 30 min (Minimet, Skye Instruments, Wales) at the centre of the study site. During the breeding season, a weather station malfunction meant that humidity data were instead obtained from the MIDAS MET Office weather station at Bishopton (approximately 25 km from the study site; 55.91°N, −4.53°W). For a short period during the breeding season where data were available from both weather stations, the humidity data were strongly correlated (GLM: F1,15 = 35.68, p < 0.0001, R2 = 0.70). This confirmed that substituting the local weather station data with the MIDAS data was appropriate.
Thermal imaging
During all thermal imaging, the camera (FLIR A65, f = 25 mm, spatial resolution 0.68 mrad, FLIR Systems, Wilsonville, Oregon) was mounted at a distance of 50 cm so birds were recorded passing through the camera’s field of view and within the camera’s zone of focus, either within the trap, or as they entered and left the nest box (detailed description of trapping/filming setup available in21). We measured body surface temperature from the region of exposed skin around the eye, an area comprised of approximately 230 pixels. Maximum eye region temperatures (Teye) were extracted from the thermal video, as the highest temperature measured from the eye region is assumed to be the most accurate21. When thermal imaging small passerines, where the majority of the body is insulated by feathers, the exposed eye region is surrounded by cooler integument. Motion blur (which occurs when activity is too rapid to be captured by the camera’s frame rate) causes data from the small warm eye area of the image to be confounded with that of larger neighbouring cooler areas, resulting in an underestimation of Teye. In contrast, overestimation of Teye requires energy input. This was avoided or accounted for by eliminating/assessing exposure to solar radiation (see below). Accordingly, the maximum temperature measured from the eye region was always likely to be the most accurate measurement recorded. The eye region was chosen as the region of interest, as the periorbital skin is the only area of the body surface where heat transfer to the environment (and therefore surface temperature) is not modulated by insulating feathers or leg scales29,57. Also, the legs play a substantial thermoregulatory role in birds58. Thermoregulatory manipulation of heat transfer to the environment from the legs is likely to obscure relationships between body surface temperature and energy reserves/physiological state. As a consequence, the legs were not considered a suitable site for assessing such relationships.
Baseline Teye was defined as the maximum temperature measured from the eye region of an individual while (i) feeding undisturbed within the trap (winter), (ii) during entry/exit from the nest box (breeding season) and (iii) during periods where the bird was in the camera’s field of view, if it did not enter or leave the nest box (breeding season). The type of event from which Teye was measured during the breeding season could influence the value of Teye due to the microclimate of the nest box (exit) or as a result of exercise during the preceding foraging trip (entry). Therefore, event type was noted and included in the breeding season analysis. Visits to the nest box were defined as ‘In’ when an individual entered the nest box, ‘Out’ when an individual left the nest box, and ‘No Entry/Exit’ when an individual entered the field of view of the camera, but did not enter or exit the nest box. Body temperature may also be influenced by solar radiation59. While the box traps were oriented such that birds within were shielded from the sun, the breeding birds were not always completely in the shade. Therefore, the presence/absence of direct solar radiation falling on the nest box during thermal imaging was recorded as a categorical measure during the breeding season.
Accurate absolute temperatures can be estimated from thermal images by the inclusion of an object of known temperature and emissivity within the field of view, against which the temperature measured from the bird’s surface by the thermal imaging camera can be calibrated. To achieve this, a thermistor probe coated in black insulation tape (Tesa UK, Milton Keynes, Buckinghamshire) was installed onto the front of the trap (winter) or the nest box perch (breeding season), and connected to the temperature logger described above. The logger was set to record at 1 s intervals, and the resulting temperature data used to calibrate the individual frames from which Teye was extracted.
Glucocorticoid assays
Total CORT levels were assessed using a commercial ELISA kit (Enzo Life Sciences, Switzerland), following the manufacturer’s instructions. This ELISA kit had been validated for the European blackbird (Turdus merula), and the great tit (Parus major), a close relative of the blue tit60. One reading was below the detection limit (1 ng/ml), so was set to 0.999 ng/ml. Corticosteroid-binding globulin (CBG) affinity and capacity were assessed, and free CORT levels estimated following the methods described by Breuner et al.61. For individual birds, CBG was estimated using 20 nM [3H] corticosterone. Maximum site binding capacity (Bmax), and the dissociation constant (Kd) from the saturation analysis were calculated using iterative, least-squares curve-fitting (GraphPad Prism, GraphPad Software, US) to fit untransformed data to a single site binding hyperbola (y = Bmax*x/(Kd + x)). Kd was 2.58 nM, whilst Bmax was 321.9 ± 13.27 nM (Supplementary Information Figs 1 and 2). The intra- and inter-assay coefficients of variation were 11.25% and 3.85%, respectively.
Statistical analyses
All statistical analyses were performed using R v3.1.262. Individual Teye measurements were compared between seasons and event types using two sample t-tests. Relationships between Teye (as the response variable) and body condition index, free CORT and total CORT during winter were analysed using separate multivariate general linear models (GLM) for each focal explanatory variable. Associations between free/total CORT (as the response variables) and body condition index were tested for using univariate GLMs. As repeated measures of Teye were taken from breeding birds, the relationship between Teye (response variable), and body condition index during the breeding season was analysed using a multivariate general linear mixed model (GLMM – ‘lme4’ package v1.1–1263) with Bird ID specified as a random effect.
CORT shows circadian rhythms, responds to environmental conditions, and can differ both between sexes6, and with previous experience of trapping/handling64. Also, body temperature fluctuates with a circadian rhythm, is modulated by air temperature (Ta)53, humidity54, and solar radiation65, and may differ between sexes66. Therefore, time of day, Ta, humidity, presence/absence of direct sunlight, sex and whether birds were entering or exiting their nest box (event type) were considered as potential confounding explanatory variables. Potential confounding explanatory variables were included in the full multivariate models only if they were significantly associated with Teye in preliminary univariate tests (critical p = 0.1). In these preliminary analyses, Teye differed between event types, so event type was included in the breeding season analysis. However, Teye did not differ between sexes (F1,29 = 2.57, p = 0.12), or with the presence/absence of direct sunlight (t = 0.81, p = 0.43). Therefore, these variables were not included in the full models. All other potential confounding explanatory variables were related to Teye in the univariate tests (p < 0.017). Time of day was correlated with Ta, so including both variables would result in a collinearity issue that would prevent discrimination between diurnal changes in Teye and environmental effects on Teye. As our primary concern was to account for environmental influences, and we restricted measurement to a relatively short period of the day over which diurnal changes are minimal, we included Ta, but not time of day, in the multivariate models.
Significance of explanatory variables (critical two-tailed p < 0.05) was determined via backwards-stepwise model selection using drop1. P-values for fixed/random effects in the GLMM were calculated using lmerTest/rand (‘lmerTest’ package v1.067). Effect size r for parameters in the final models, and R2 for the GLMM were calculated using equations specified by Nakagawa & Cuthill68, and Nakagawa & Schielzeth69, respectively. Variance inflation factors (vif, ‘car’ package v2.0–2270) calculated post-hoc for explanatory variables included in the GLMs suggested no issue with collinearity. All model assumptions were met. Throughout the results we report means ± standard error.
Data Accessibility
Data available from the Dryad Digital Repository: 10.5061/dryad.1jg00.
Electronic supplementary material
Acknowledgements
We thank Pablo Capilla for field assistance, Ross MacLeod for critical discussions and provision of the 2011–2013 body condition index data from mist netted birds, Matthew Clavey and Nosrat Mirzai for technical support, and Neil Metcalfe, Glenn Tattersall and two anonymous reviewers for helpful comments on the manuscript. P.J. was funded by the Biotechnology and Biological Sciences Research Council (BB/J013854/1).
Author Contributions
P.J., R.G.N., D.McK., D.J.McC., and K.H. contributed to experimental design. P.J. gathered the data. S.J.E. conducted the hormonal assays. P.J. analysed the data and wrote the manuscript. All authors contributed critically to the drafts and gave final approval for publication.
Competing Interests
The authors declare that they have no competing interests.
Footnotes
Electronic supplementary material
Supplementary information accompanies this paper at 10.1038/s41598-018-20240-4.
Publisher's note: Springer Nature remains neutral with regard to jurisdictional claims in published maps and institutional affiliations.
References
- 1.Clarke A, Rothery P. Scaling of body temperature in mammals and birds. Funct. Ecol. 2007;22:58–67. [Google Scholar]
- 2.McCafferty D, Gallon S, Nord A. Challenges of measuring body temperatures of free-ranging birds and mammals. Anim. Biotelemetry. 2015;3:33. doi: 10.1186/s40317-015-0075-2. [DOI] [Google Scholar]
- 3.Adelman J, Córdoba-Córdoba S, Spoelstra K, Wikelski M, Hau M. Radiotelemetry reveals variation in fever and sickness behaviours with latitude in a free-living passerine. Funct. Ecol. 2010;24:813–823. doi: 10.1111/j.1365-2435.2010.01702.x. [DOI] [Google Scholar]
- 4.Nord A, et al. Evaluation of two methods for minimally invasive peripheral body temperature measurements in birds. J. Avian Biol. 2015;46:1–11. doi: 10.1111/jav.00478. [DOI] [Google Scholar]
- 5.Nilsson J, Molokowu M, Olsson O. Body Temperature Regulation in Hot Environments. PLoS One. 2016;11:e0161481. doi: 10.1371/journal.pone.0161481. [DOI] [PMC free article] [PubMed] [Google Scholar]
- 6.Romero, M. & Wingfield, J. Tempests, Poxes, Predators, and People: Stress in Wild Animals and How They Cope. (Oxford University Press, 2015).
- 7.Sapolsky R, Romero L, Munck A. How Do Glucocorticoids Influence Stress Responses? Integrating Permissive, Suppresive, Stimulatory and Preparative Actions. Endocr. Rev. 2000;21:55–89. doi: 10.1210/edrv.21.1.0389. [DOI] [PubMed] [Google Scholar]
- 8.Oka T, Oka K, Hori T. Mechanisms and mediators of psychological stress-induced rise in core temperature. Psychosom. Med. 2001;63:476–486. doi: 10.1097/00006842-200105000-00018. [DOI] [PubMed] [Google Scholar]
- 9.Briese E, Cabanac M. Stress hyperthermia: physiological arguments that it is a fever. Physiol. Behav. 1991;49:1153–7. doi: 10.1016/0031-9384(91)90343-M. [DOI] [PubMed] [Google Scholar]
- 10.Bouwknecht A, Olivier B, Paylor R. The stress-induced hyperthermia paradigm as a physiological animal model for anxiety: a review of pharmacological and genetic studies in the mouse. Neurosci. Biobehav. Rev. 2007;31:41–59. doi: 10.1016/j.neubiorev.2006.02.002. [DOI] [PubMed] [Google Scholar]
- 11.Carere C, Welink D, Drent P, Koolhaas J, Groothuis T. Effect of social defeat in a territorial bird (Parus major) selected for different coping styles. Physiol. Behav. 2001;73:427–33. doi: 10.1016/S0031-9384(01)00492-9. [DOI] [PubMed] [Google Scholar]
- 12.Keeney A, Hogg S, Marsden C. Alterations in core body temperature, locomotor activity, and corticosterone following acute and repeated social defeat of male NMRI mice. Physiol. Behav. 2001;74:177–84. doi: 10.1016/S0031-9384(01)00541-8. [DOI] [PubMed] [Google Scholar]
- 13.Bartolomucci A, et al. Chronic psychosocial stress persistently alters autonomic function and physical activity in mice. Physiol. Behav. 2003;80:57–67. doi: 10.1016/S0031-9384(03)00209-9. [DOI] [PubMed] [Google Scholar]
- 14.Hayashida S, Oka T, Mera T, Tsuji S. Repeated social defeat stress induces chronic hyperthermia in rats. Physiol. Behav. 2010;101:124–31. doi: 10.1016/j.physbeh.2010.04.027. [DOI] [PubMed] [Google Scholar]
- 15.Reinertsen, R. In Living in the cold (eds Heller, H., Musacchia, X. & Wang, L.) 419–426 (Elsevier, 1986).
- 16.MacLeod M, Savory C, McCorquodale C, Boyd A. Effects of long-term food restriction on energy expenditure and thermoregulation in broiler-breeder fowls (Gallus domesticus) Comp. Biochem. Physiol.–Part A Physiol. 1993;106:221–225. doi: 10.1016/0300-9629(93)90503-V. [DOI] [PubMed] [Google Scholar]
- 17.Savory J. Circadian variation in heart rate, blood pressure, body temperature and EEG of immature broiler breeder chickens in restricted-fed and ad libitum-fed states. Br. Poult. Sci. 2006;47:599–606. doi: 10.1080/00071660600939719. [DOI] [PubMed] [Google Scholar]
- 18.Astheimer LB, Buttemer WA, Wingfield JC. Interactions of Corticosterone with Feeding, Activity and Metabolism in Passerine Birds. Ornis Scand. 1992;23:355–365. doi: 10.2307/3676661. [DOI] [Google Scholar]
- 19.Buttemer, W., Astheimer, L. & Wingfield, J. The effect of corticosterone on standard metabolic rates of small passerine birds. J. Comp. Physiol. B 427–431 (1991). [DOI] [PubMed]
- 20.Spencer K, Verhulst S. Post-natal exposure to corticosterone affects standard metabolic rate in the zebra finch (Taeniopygia guttata) Gen. Comp. Endocrinol. 2008;159:250–256. doi: 10.1016/j.ygcen.2008.09.007. [DOI] [PubMed] [Google Scholar]
- 21.Jerem, P., Herborn, K., McCafferty, D., McKeegan, D. & Nager, R. Thermal Imaging to Study Stress Non-invasively in Unrestrained Birds. J. Vis. Exp. 1–10 (2015). [DOI] [PMC free article] [PubMed]
- 22.Blessing W. Lower brainstem pathways regulating sympathetically mediated changes in cutaneous blood flow. Cell. Mol. Neurobiol. 2003;23:527–38. doi: 10.1023/A:1025020029037. [DOI] [PMC free article] [PubMed] [Google Scholar]
- 23.Rimm-Kaufman SE, Kagan J. The psychological significance of changes in skin temperature. Motiv. Emot. 1996;20:63–78. doi: 10.1007/BF02251007. [DOI] [Google Scholar]
- 24.Busnardo C, Tavares R, Resstel L, Elias L, Correa F. Paraventricular nucleus modulates autonomic and neuroendocrine responses to acute restraint stress in rats. Auton. Neurosci. 2010;158:51–7. doi: 10.1016/j.autneu.2010.06.003. [DOI] [PubMed] [Google Scholar]
- 25.Scholander PF, Hock R, Walters V, Irving L. Adaptation to Cold in Arctic and Tropical Mammals and Birds in Relation to Body Temperature, Insulation, and Basal Metabolic Rate. Biol. Bull. 1950;99:259–271. doi: 10.2307/1538742. [DOI] [PubMed] [Google Scholar]
- 26.Ward S, Slater PJB. Heat transfer and the energetic cost of singing by canaries Serinus canaria. J. Comp. Physiol. A. 2005;191:953–64. doi: 10.1007/s00359-005-0022-4. [DOI] [PubMed] [Google Scholar]
- 27.Jofré MB, Caviedes-Vidal E. Seasonal changes in heat transfer in the small mammal Calomys musculinus (Rodentia, Muridae). The role of the skin. J. Therm. Biol. 2003;28:141–147. doi: 10.1016/S0306-4565(02)00051-7. [DOI] [Google Scholar]
- 28.Booth DT, Clayton DH, Block BA. Experimental Demonstration of the Energetic Cost of Parasitism in Free-Ranging Hosts. Proc. R. Soc. B Biol. Sci. 1993;253:125–129. doi: 10.1098/rspb.1993.0091. [DOI] [Google Scholar]
- 29.McCafferty DJ, et al. Estimating metabolic heat loss in birds and mammals by combining infrared thermography with biophysical modelling. Comp. Biochem. Physiol. A. Mol. Integr. Physiol. 2011;158:337–345. doi: 10.1016/j.cbpa.2010.09.012. [DOI] [PubMed] [Google Scholar]
- 30.Hill RW, Beaver DL, Veghte JH. Body Surface Temperatures and Thermoregulation in the Black-Capped Chickadee (Parus atricapillus) Physiol. Zool. 1980;53:305–321. doi: 10.1086/physzool.53.3.30155793. [DOI] [Google Scholar]
- 31.Lane JE, Brigham RM, Swanson DL. Daily Torpor in Free‐Ranging Whip‐Poor‐Wills (Caprimulgus vociferus) Physiol. Biochem. Zool. 2004;77:297–304. doi: 10.1086/380210. [DOI] [PubMed] [Google Scholar]
- 32.Broggi J, Gamero A, Hohtola E, Orell M, Nilsson JA. Interpopulation Variation in Contour Feather Structure Is Environmentally Determined in Great Tits. PLoS One. 2011;6:e24942. doi: 10.1371/journal.pone.0024942. [DOI] [PMC free article] [PubMed] [Google Scholar]
- 33.Johnstone C, Reina R, Lill A. Interpreting indices of physiological stress in free-living vertebrates. J. Comp. Physiol. B Biochem. Syst. Environ. Physiol. 2012;182:861–879. doi: 10.1007/s00360-012-0656-9. [DOI] [PubMed] [Google Scholar]
- 34.Müller C, et al. Circulating corticosterone levels in breeding blue tits Parus caeruleus differ between island and mainland populations and between habitats. Gen. Comp. Endocrinol. 2007;154:128–36. doi: 10.1016/j.ygcen.2007.05.031. [DOI] [PubMed] [Google Scholar]
- 35.Jenni-Eiermann S, Glaus E, Grüebler M, Schwabl H, Jenni L. Glucocorticoid response to food availability in breeding barn swallows (Hirundo rustica) Gen. Comp. Endocrinol. 2008;155:558–565. doi: 10.1016/j.ygcen.2007.08.011. [DOI] [PubMed] [Google Scholar]
- 36.Williams CT, Kitaysky AS, Kettle AB, Buck CL. Corticosterone levels of tufted puffins vary with breeding stage, body condition index, and reproductive performance. Gen. Comp. Endocrinol. 2008;158:29–35. doi: 10.1016/j.ygcen.2008.04.018. [DOI] [PubMed] [Google Scholar]
- 37.Belthoff J, Dufty A. Corticosterone, body condition and locomotor activity: a model for dispersal in screech-owls. Anim. Behav. 1998;55:405–415. doi: 10.1006/anbe.1997.0625. [DOI] [PubMed] [Google Scholar]
- 38.Landys MM, Goymann W, Raess M, Slagsvold T. Hormonal responses to male-male social challenge in the blue tit Cyanistes caeruleus: single-broodedness as an explanatory variable. Physiol. Biochem. Zool. 2007;80:228–40. doi: 10.1086/510564. [DOI] [PubMed] [Google Scholar]
- 39.Fokidis H, Orchinik M, Deviche P. Corticosterone and corticosteroid binding globulin in birds: relation to urbanization in a desert city. Gen. Comp. Endocrinol. 2009;160:259–70. doi: 10.1016/j.ygcen.2008.12.005. [DOI] [PubMed] [Google Scholar]
- 40.Wada H, Hahn TP, Breuner CW. Development of stress reactivity in white-crowned sparrow nestlings: total corticosterone response increases with age, while free corticosterone response remains low. Gen. Comp. Endocrinol. 2007;150:405–13. doi: 10.1016/j.ygcen.2006.10.002. [DOI] [PubMed] [Google Scholar]
- 41.Breuner CW, Delehanty B, Boonstra R. Evaluating stress in natural populations of vertebrates: total CORT is not good enough. Funct. Ecol. 2013;27:24–36. doi: 10.1111/1365-2435.12016. [DOI] [Google Scholar]
- 42.Desantis LM, Delehanty B, Weir JT, Boonstra R. Mediating free glucocorticoid levels in the blood of vertebrates: are corticosteroid-binding proteins always necessary? Funct. Ecol. 2013;27:107–119. doi: 10.1111/1365-2435.12038. [DOI] [Google Scholar]
- 43.Henderson LJ, Heidinger BJ, Evans NP, Arnold KE. Ultraviolet crown coloration in female blue tits predicts reproductive success and baseline corticosterone. Behav. Ecol. 2013;24:1299–1305. doi: 10.1093/beheco/art066. [DOI] [Google Scholar]
- 44.Nord A, Nilsson JF, Sandell MI, Nilsson J-A. Patterns and dynamics of rest-phase hypothermia in wild and captive blue tits during winter. J. Comp. Physiol. B Biochem. Syst. Environ. Physiol. 2009;179:737–45. doi: 10.1007/s00360-009-0357-1. [DOI] [PubMed] [Google Scholar]
- 45.Moe RO, Stubsjøen SM, Bohlin J, Flø A, Bakken M. Peripheral temperature drop in response to anticipation and consumption of a signaled palatable reward in laying hens (Gallus domesticus) Physiol. Behav. 2012;106:527–33. doi: 10.1016/j.physbeh.2012.03.032. [DOI] [PubMed] [Google Scholar]
- 46.Stuber EF, et al. Slow explorers take less risk: a problem of sampling bias in ecological studies. Behav. Ecol. 2013;24:1092–1098. doi: 10.1093/beheco/art035. [DOI] [Google Scholar]
- 47.Cockrem JF. Stress, corticosterone responses and avian personalities. J. Ornithol. 2007;148:169–178. doi: 10.1007/s10336-007-0175-8. [DOI] [Google Scholar]
- 48.Atwell JW, et al. Boldness behavior and stress physiology in a novel urban environment suggest rapid correlated evolutionary adaptation. Behav. Ecol. 2012;23:960–969. doi: 10.1093/beheco/ars059. [DOI] [PMC free article] [PubMed] [Google Scholar]
- 49.Mendel C. The free hormone hypothesis distinction from the free hormone transport hypothesis. J. Androl. 1992;13:107–116. [PubMed] [Google Scholar]
- 50.Lynn S, Breuner C, Wingfield J. Short-term fasting affects locomotor activity, corticosterone, and corticosterone binding globulin in a migratory songbird. Horm. Behav. 2003;43:150–157. doi: 10.1016/S0018-506X(02)00023-5. [DOI] [PubMed] [Google Scholar]
- 51.Breuner C, Wingfield J, Romero L. Diel rhythms of basal and stress-induced corticosterone in a wild, seasonal vertebrate, Gambel’s white-crowned sparrow. J. Exp. Zool. 1999;284:334–342. doi: 10.1002/(SICI)1097-010X(19990801)284:3<334::AID-JEZ11>3.0.CO;2-#. [DOI] [PubMed] [Google Scholar]
- 52.Labocha MK, Hayes JP. Morphometric indices of body condition in birds: A review. J. Ornithol. 2012;153:1–22. doi: 10.1007/s10336-011-0706-1. [DOI] [Google Scholar]
- 53.Aschoff J. Circadian rhythms: influences of internal and external factors on the period measured in constant conditions. Z. Tierpsychol. 1979;49:225–49. doi: 10.1111/j.1439-0310.1979.tb00290.x. [DOI] [PubMed] [Google Scholar]
- 54.Lin H, et al. Thermoregulation responses of broiler chickens to humidity at different ambient temperatures. II. Four weeks of age. Poult. Sci. 2005;84:1173–1178. doi: 10.1093/ps/84.8.1173. [DOI] [PubMed] [Google Scholar]
- 55.Refinetti R, Menaker M. The circadian rhythm of body temperature. Physiol. Behav. 1992;51:613–37. doi: 10.1016/0031-9384(92)90188-8. [DOI] [PubMed] [Google Scholar]
- 56.Svensson, L. Identification guide to European passerines. (British Trust for Ornithology 1992).
- 57.McFarland D, Budgell P. The thermoregulatory role of feather movements in the barbary dove (Streptopelia risoria) Physiol. Behav. 1970;5:763–771. doi: 10.1016/0031-9384(70)90276-3. [DOI] [PubMed] [Google Scholar]
- 58.Martineau L, Larochelle J. The Cooling Power of Pigeon Legs. J. Exp. Biol. 1988;136:193–208. [Google Scholar]
- 59.Lustick S, Talbot S, Fox E. Absorption of Radiant Energy in Redwinged Blackbirds (Agelaius phoeniceus) Condor. 1970;72:471–473. doi: 10.2307/1366396. [DOI] [Google Scholar]
- 60.Ouyang JQ, Hau M, Bonier F. Within seasons and among years: When are corticosterone levels repeatable? Horm. Behav. 2011;60:559–564. doi: 10.1016/j.yhbeh.2011.08.004. [DOI] [PubMed] [Google Scholar]
- 61.Breuner C, et al. Differential mechanisms for regulation of the stress response across latitudinal gradients. Am. J. Physiol. Regul. Integr. Comp. Physiol. 2003;285:R594–600. doi: 10.1152/ajpregu.00748.2002. [DOI] [PubMed] [Google Scholar]
- 62.Team, R. C. R: A language and environment for statistical computing. R Foundation for Statistical Computing, Vienna, Austria. (2016).
- 63.Bates D, Maechler M, Bolker B, Walker S. Fitting Linear Mixed-Effects Models Using lme4. J. Stat. Softw. 2014;67:1–48. [Google Scholar]
- 64.Lynn SE, Prince LE, Phillips MM. A single exposure to an acute stressor has lasting consequences for the hypothalamo-pituitary-adrenal response to stress in free-living birds. Gen. Comp. Endocrinol. 2010;165:337–44. doi: 10.1016/j.ygcen.2009.07.018. [DOI] [PubMed] [Google Scholar]
- 65.Marder J. Body Temperature Regulation in the Brown- Necked Raven (Corvus Corax Ruficollis) - II. Thermal Changes in the Plumage of Ravens Exposed To Solar Radiation. Comp. Biochem. Physiol. 1973;45A:431–440. doi: 10.1016/0300-9629(73)90450-7. [DOI] [PubMed] [Google Scholar]
- 66.Bonier F, et al. Sex-specific consequences of life in the city. Behav. Ecol. 2007;18:121–129. doi: 10.1093/beheco/arl050. [DOI] [Google Scholar]
- 67.Kuznetzova, A., Brockhoff, P. & Christensent, R. lmerTest: Tests in Linear Mixed Effects Models. (2016).
- 68.Nakagawa S, Cuthill I. Effect size, confidence interval and statistical significance: a practical guide for biologists. Biol. Rev. Camb. Philos. Soc. 2007;82:591–605. doi: 10.1111/j.1469-185X.2007.00027.x. [DOI] [PubMed] [Google Scholar]
- 69.Nakagawa S, Schielzeth H. A general and simple method for obtaining R2 from generalized linear mixed-effects models. Methods Ecol. Evol. 2013;4:133–142. doi: 10.1111/j.2041-210x.2012.00261.x. [DOI] [Google Scholar]
- 70.Fox J, Weisberg S. An R Companion to Applied Regression. Second Edition. Thousand Oaks CA: Sage; 2011. [Google Scholar]
Associated Data
This section collects any data citations, data availability statements, or supplementary materials included in this article.
Supplementary Materials
Data Availability Statement
Data available from the Dryad Digital Repository: 10.5061/dryad.1jg00.