Abstract
While flavonoid metabolism’s regulation under light conditions by structural genes and transcription factors is understood, the roles of microRNAs (miRNAs) in this pathway have been rarely reported. In this paper, the accurate control of light was firstly enabled through the specially designed plant growth chamber which ensures consistency and accuracy of the cultivation of longan ECs and the repeatability of the experiments. Then, longan ECs were cultured in this chamber for 25 days. The change of growth rate of longan ECs was compared under different light qualities (dark, blue, green, white, green), intensities (16, 32, 64, 128, 256 μmol ·m-2 ·s-1), and durations (8 h, 12 h, 16 h, 20h, 24h). Results indicated that longan ECs had a high growth rate in the condition of blue or green light, at intensity ranged from 16 μmol·m-2·s-1 to 64 μmol·m-2·s-1, and duration from 8 h to 16 h. In addition, the contents of total flavonoids, rutin, and epicatechin were determined. Results indicated that flavonoid contents of longan ECs reached the highest value under blue light, at 32 μmol·m-2·s-1 and 12h/d. Blue light promoted the accumulation of epicatechin, but inhibited the synthesis of rutin. Finally, the expressions of flavonoid pathway genes, miRNAs and target genes were analyzed by qPCR. These results indicated that miR393 and its target gene DlTIR1-3, miR394 and its target gene DlAlMT12, and miR395 and its target gene DlAPS1 had a negative regulating relationship under blue light in longan ECs. Furthermore, miR393, miR394, and miR395 acted on target genes, which negatively regulated flavonoid key genes DlFLS and positively regulated key genes DlCHS, DlCHI, DlF3′H, DlDFR, DlLAR, and finally affected the accumulation of flavonoids. The treatment of longan ECs under the blue light at the intensity of 32 μmol·m-2·s-1 for 12 h/d inhibited the expression of miR393, miR394 and miR395, which promoted the expression of target genes and the accumulation of flavonoids and epicatechin, but inhibited the synthesis of rutin.
1 Introduction
Longan (Dimocarpus longan Lour.), Sapindaceae, is a tropical/subtropical fruit plant, with high nutritional and medicinal values. The medicinal ingredients in longan are mainly secondary metabolites, including flavonoid substances [1], which have important physiological significances in plants. These compounds control auxin transport, ultraviolet (UV) protection and resistance functions [2]. In addition, flavonoids are biologically strong natural antioxidants, and have anti-cancer and anti-aging effects, as well as other medicinal benefits [2].
The synthesis of flavonoid metabolites in plants is affected by environmental stress [3,4], and light is an important environmental factor that affects cellular physiology. Light exposure leads to broad changes in the flavonoid biosynthesis pathway [5,6].
Research on the light-controlled molecular regulatory mechanisms involved in flavonoid metabolism has progressed [7]. The mechanisms mainly include two kinds of control genes: structural and regulatory. Light treatments can significantly improve the expression levels of litchi flavonoid structural genes, such as chalcone synthase (CHS), chalcone isomerase (CHI), flavanone 3-hydroxylase (F3H) and dihydroxy flavonol reductase (DFR) [8]. The flavonoid contents in plants is closely related to the transcription levels of the structural genes, while the v-myb avian myeloblastosis viral oncogene homolog (MYB) transcription factors can regulate the transcriptional expression levels of flavonoid structural genes [9]. In addition, a number of MYB transcription factors are regulated by the light [7]. The main structural and regulatory genes of flavonoid biosynthesis under different light conditions have been cloned in various plants [2,7]. The regulatory mechanisms of the main structural genes have been elucidated; however, these mechanisms are very complicated in the plant flavonoid biosynthesis pathways, which involve a wide variety of enzymes whose synthesis is also affected by other factors [2,7].
While flavonoid metabolism’s regulation under light conditions by structural genes and transcription factors is understood [7], the roles of microRNAs (miRNAs) in this pathway have been rarely reported. Moreover, their regulatory mechanisms are unclear. The miRNAs have emerged as significant regulators of gene expression in plants and have important regulatory functions in stress responses, development and epigenetic phenomena [10,11]. Some light-responsive miRNAs play important roles in plant stress responses. For example, in some plant species, miR166 is induced under heat, cold stress and UV-B radiation [12]. Here, miR398 was up-regulated by the environmental light conditions, suggesting that the miR398-mediated Cu/Zn superoxide dismutase regulation is involved in a number of responsive pathways [13]. The functional element analysis of longan miRNA promoters also revealed that miR393, miR394 and miR395 contain many light reaction-related components [14] and that they mediate light’s influence on plants. In addition, miRNAs may regulate the secondary metabolism of plants [15]. Arabidopsis’ miR393 can act on auxin response factors 1 and 9, and thus, regulate glucosinolate synthesis [16]. The negative regulation of anthocyanin biosynthesis by a miR156-targeted squamosa promoter-binding protein-like transcription factor (SPL) was described by Gou et al. [17]. The functional element analysis of longan miRNA promoters also found that miR393, miR394 and miR395 contained MYB-binding sites that were involved in flavonoid biosynthetic gene regulation [14]. Thus, we hypothesized that miR393, miR394 and miR395 play important roles in light-related pathways that affect flavonoid metabolism.
In most of the related literatures, the definitions and descriptions of light sources are quite inaccurate, and the illumination inside the growth chambers is generally uneven [18,19]. These problems were solved in our laboratory by improving the light-control technology. Our group has established a longan embryogenic callus (longan EC) culture system to study the influence of light treatments on flavonoid metabolism. This laid an important foundation for the study of the secondary metabolism of longan cells, and we determined it could be accurately regulated by a light source.
Here, we investigated longan ECs cultured using light-control technology. The growth status and flavonoid contents were observed and analyzed. To understand the regulatory mechanism behind miRNAs roles in light-affected flavonoid metabolism in longan ECs, we compared and analyzed their relationships, including miR393 and the target gene transport inhibitor response protein 1 (DlTIR1-3), miR394 and the target gene aluminum-activated malate transporter 12 (DlALMT12), miR395 and the target gene ATP sulfurylase 1 (DlAPS1), and flavonoid biosynthesis related genes DlCHS, DlCHI, flavonol synthase (DlFLS), DlF3′H, DlDFR and leucoanthocyanidin reductase (DlLAR). These studies provided new insights into the molecular mechanisms that allow light to influence plant flavonoid metabolism.
2 Materials and methods
2.1 Equipment improvement and illumination uniformity analysis
Traditional plant growth chambers are often equipped with light sources of unknown or inexact wavelengths that distribute uneven illumination and light intensity levels. Illumination uniformity was achieved through the improvement of plant growth chambers (S1 Fig). The central wavelengths of red, green and blue light were 660, 515 and 457 nm, respectively (S2 Fig). Actual measurements revealed that the illumination uniformity was consistent at the same horizontal plane (S3 Fig). Light quality, light intensity and photoperiod in the chamber were controlled by an intelligent system (S1 Fig). This ensured consistent longan-EC culture conditions, as well as accurate and repeatable experiments.
2.2 Plant material and light treatments
Longan ECs were obtained using previously published methods [20,21]. Longan ECs were alternately kept on Murashige and Skoog (MS, Phytotechnology M519) medium (2% sucrose and 6 g/L agar, pH 5.8) supplemented with 4.5 μM 2,4-Dichlorophenoxyacetic acid (2,4-D) and MS medium supplemented with 4.5 μM 2,4-D, 2.3 μM kinetin and 5 mg/L AgNO3, and were subcultured every 20 d. Based on previous studies of the longan ECs’ flavonoids, the former medium was selected for use with the light treatments [22].
Longan ECs were put into plant growth chamber and control groups were incubated in dark. Three different kinds of treatments were investigated in the experiments. 1) Both intensity and photoperiod were fixed at 32 μmol·m-2·s-1 and 12h/d respectively with light qualities setting at blue (457 nm), green (515 nm), white, and red (660 nm); 2) Both light quality and photoperiod were fixed at blue and 12h/d respectively with light intensities setting at 16, 32, 64, 128, and 256 μmol·m-2·s-1; 3) Both light quality and intensity were fixed at blue and 32 μmol·m-2·s-1 respectively with photoperiods setting at 8, 12, 16, 20, and 24h.
Equal pieces (0.04 g) of longan ECs with diameters of 5–7 mm were placed onto separate bottles (240ml). There were 30 bottles used in each treatment, which lasted for 25 d at 25 ± 2°C with a relative humidity of 55%–60%. Each treatment was repeated for three times. After the treatments, all of the materials were stored at −80°C for later use.
The browned and polluted longan ECs were removed, and 25 bottles of longan ECs of good growth status were chosen. The fresh weights of the longan ECs were determined, and the growth rate of each bottle was calculated. Growth rate = (Final fresh weight–Starting fresh weight)/Starting fresh weight × 100%. Longan ECs were observed using an inverted electron microscope (Leica DM IL).
2.3 Flavonoid determination
The flavonoid contents were determined using the method of Li [23] with some modifications. Longan ECs were freeze-dried for 1 d using a lyophilizer (LGJ-25C), ground into fine powders, and extracted with 10 mL 60% ethanol. The extraction process lasted for 1 h at 60°C in an Ultrasonic Washing Device (KQ-200SPDE). The extracts were centrifuged at 10,000 g for 10 min at 20°C. The supernatant was collected into new tubes. Using the chromogenic reaction method, the flavonoid levels were measured using a DU 640 spectrophotometer.
2.4 Epicatechin extraction and UPLC-MS analyses
The epicatechin contents were determined using the method of Zuo [24] with some modifications. The extraction was carried out using 1.0 g fine longan EC powder dissolved in 10 mL methanol solution and extracted for 60 min at 60°C using an Ultrasonic Washing Device (KQ-200SPDE). The extracts were combined and filtered, and then evaporated to dryness in a rotary evaporator. The dried extracts were dissolved in 5 mL methanol, and all samples were filtered using 0.22-μm syringe filter.
The following chromatographic conditions were used. The mobile phase consisted of water containing 0.1% formic acid (A) and methanol (B). The composition of the mobile phase was 5%–25% (B) for 0–12 min, 25%–35% (B) for 12–15 min, and 35%–5% (B) for 15–18 min. The column temperature was set at 30°C. The injection volume was 5 μL, and the flow rate was 0.2 mL/min. All standards and samples were detected by UPLC (ACQUITY UPLC H-Class) at a wavelength of 280 nm.
2.5 Rutin extraction and UPLC-MS analyses
The rutin contents were determined using the method of You [25] with some modifications. Longan ECs were extracted using the epicatechin method.
The following chromatographic conditions were used. The assay was performed on a Diamonsil C18 (4. 6 mm × 200 mm, 5 μm) column with an isocratic elution in methanol: 0.1% acetic acid (34:66) at a flow rate of 1.0 mL/min. The column temperature was set at 30°C. All standards and samples were detected by UPLC (ACQUITY UPLC H-Class) at a wavelength of 257 nm.
2.6 Expression analysis by quantitative real-time PCR
Total RNAs were extracted from longan ECs grown under different light treatments using the TriPure Isolation Reagent (Roche Diagnostics, Indianapolis, IN, USA). The RNA quantities were determined using an Agilent 2100 bioanalyzer and were checked for denaturation by agarose gel electrophoresis. RNAs were stored at −80°C for later use. Total RNAs from longan ECs were reverse-transcribed and used for qPCR in accordance with previous methods [26,27]. Expression profiles of miRNAs were determined using an NCode Express SYBR GreenER miRNA qPCR kit (Invitrogen), and those of the mRNAs were determined using SYBR® Premix Ex Taq™ II (Tli RNaseH Plus; Takara, Japan) on a LightCycler480 Real-time PCR system. EF -1a, elF-4a and DlFSD1a acted as the reference genes, and the relative gene expression levels were evaluated using the method described by Lin et al. [26]. dlo-miR156c, dlo-miR2089*-1 and 5S rRNA were used as the reference genes for miRNAs, and the relative miRNA expression levels were evaluated using the method described by Lin et al. [27]. Relative expression levels were determined using the 2−ΔΔCt method. The quantitative PCR primers’ information is listed in S1 Table. Each treatment was analyzed using biological and technical triplicates.
2.7 Statistical analysis
Quantitative results of the gene expression and flavonoid contents analyses were presented in terms of means ± SDs of at least three biological replicates. The effect of different light conditions on the flavonoid contents and the gene expression were analysed by one-way analysis of variance (ANOVA) followed by Duncan’s test using SPSS version 19.0. These pictures were made using the GraphPad Prism 6.0 software.
3 Results
3.1 Influence of light quality, intensity, and photoperiod on the growth rate of longan ECs
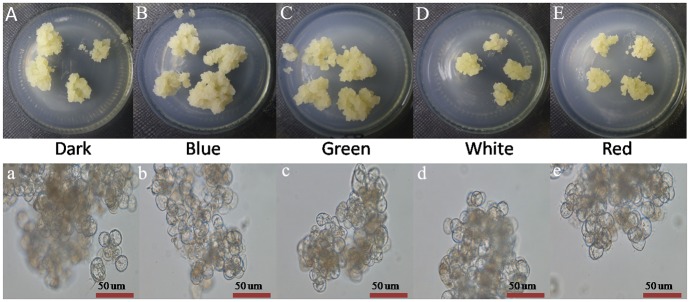
The growth state of longan ECs was affected by light quality. Longan ECs in the dark, and under blue and green light conditions grew well, with a crunchy texture. But the growth status in the white and red light was poor. The texture mixed closely and the longan calli were watery with strong viscosity (Fig 1A–1E). Almost no difference was observed on the longan ECs under the different light qualities from cell microscopic observation (Fig 1a–1e).
Fig 1. Growth state of longan ECs under different light qualities.
A-E, Growth state of longan ECs on the 25 days under different light qualities, at the light intensity of 32 μmol ·m-2 ·s-1 and photoperiod of 12h; a-e, Growth situation of longan ECs on the 25 days under different light qualities by microscopic observation (Bar = 50nm).
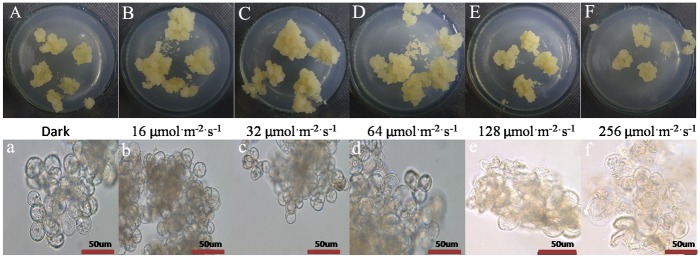
The growth state of longan ECs was affected by different light intensities. The longan ECs under the dark, 16 μmol·m-2·s-1 to 64 μmol·m-2·s-1 were thrivinge, but the growth status under 128 μmol·m-2·s-1 to 256 μmol·m-2·s-1 was very poor and the structure was wet and sticky (Fig 2A–2F). The longan cytoplasm under the dark and 16 μmol·m-2·s-1 to 64 μmol·m-2·s-1 was all active. However, some cells under 128 μmol·m-2·s-1 to 256 μmol·m-2·s-1 showed cracking and deformation (Fig 2a–2f).
Fig 2. Growth state of longan ECs under blue light of different intensities.
A-F, Growth state of longan ECs on the 25 days under blue light of different intensities, at photoperiod of 12h; a-f, Growth situation of longan ECs on the 25 days under blue light of different intensities by microscopic observation (Bar = 50nm).
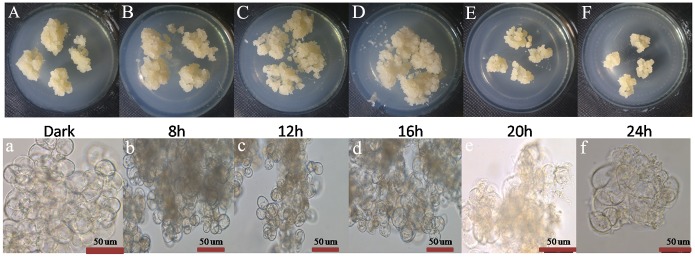
The growth state of longan ECs had significantly changed under different photoperiods. Compared to the growth in dark condition, longan ECs under dark, 8h, 12h, and 16h illumination were all thrive, but the growth state under 20h and 24h illumination were bad with waterish (Fig 3A–3F). Longan cytoplasm under dark and 8h to 16h illumination flow actively, but the cytoplasm under 20 h and 24 h illumination had poor fluidity, even some cracking and deformation were found in some cells (Fig 3a–3f).
Fig 3. Growth state of longan ECs under blue light of different photoperiods.
A-F, Growth state of longan ECs on the 25 days under blue light of different photoperiods, at light intensity of 32 μmol ·m-2 ·s-1; a-f, Growth situation of longan ECs on the 25 days under blue light of different photoperiods by microscopic observation (Bar = 50nm).
The growth rate of longan ECs was affected by light quality, intensity, and photoperiod. The growth rate of the longan ECs under blue and green light illumination was higher than that under the dark, but that under white and red light was even lower than that under the dark (Fig 4A and S2 Table). Longan ECs under 16 μmol·m-2·s-1 to 64 μmol·m-2·s-1 were higher than that under darkness. However, it was reduced significantly under 256 μmol·m-2·s-1 (Fig 4B and S3 Table). The grown rate of longan ECs under duration from 8 h to 16 h were higher than other treatment (Fig 4C and S4 Table). Generally, from the results above, longan ECs had a high growth rate in the condition of blue or green light, light intensity ranging from 16 μmol·m-2·s-1 to 64 μmol·m-2·s-1 and photoperiod ranging from 8 to 16 h.
Fig 4. Growth rate of longan ECs under different lighting conditions.
A, Growth rate of each bottle of Longan ECs on the 25 days under different light qualities; B, Growth rate of each bottle of Longan ECs on the 25 days under blue light of different intensities; C, Growth rate of each bottle of Longan ECs on the 25 days under blue light of different photoperiods; Values represent means ± SDs of three replicates. Different upper/lower case letters indicate statistically significant difference at 0.01/0.05 levels by one-way ANOVA analysis in the duncan’s test.
3.2 Influence of light quality, intensity, and photoperiod on the flavonoid metabolism of longan ECs
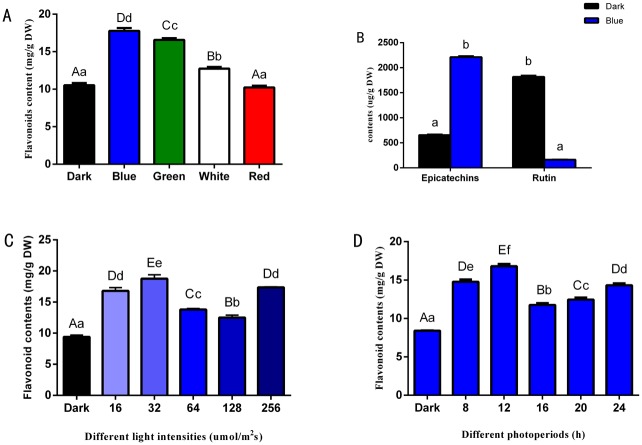
In our lab’s previous study, we compared flavonoid contents in longan ECs in different periods, and found that flavonoid contents peaked on 25th day. [22]. Here, the flavonoid contents were determined in the longan ECs under different light qualities on 25th day in this study. The highest content of flavonoids was 17.77 mg/g under blue light treatment, followed by the green light and a minimum value of 10.23 mg/g was measured under red light (Fig 5A and S5 Table). This indicated that blue light promoted the accumulation of epicatechin, but inhibited the synthesis of rutin (Fig 5B, S4 and S5 Figs, S6 and S7 Tables). Using the blue light of different intensities to cultivate longan ECs, flavonoid contents reached its highest at 18.77 mg/g when the light intensity was 32 μmol·m-2·s-1. Then the flavonoid contents was observed 12.51 mg/g, and 17.36 mg/g when the intensity was 256 μmol·m-2·s-1 (Fig 5C and S8 Table). When longan ECs were cultured under blue light at different photoperiods, the flavonoid contents was 16.81 mg/g in the photoperiod of 12 h/d. Then the flavonoid contents had a small rebound when the illumination lasted for 24 h (Fig 5D and S9 Table). In addition, flavonoid contents had a rebound under the light intensity of 256 μmol·m-2·s-1 (Fig 5C) and the illumination duration of 24 h/d (Fig 5D). These light conditions might have caused certain damage to longan ECs, which made they produce more flavonoids to respond to light stress by changing their physiological and metabolic mechanisms. In addition, the growth rate of red light treatment was lower compared with the control group (Fig 4A), whereas the flavonoid contents was not increased (Fig 5A). These reflected that red light conditions were not adverse to longan ECs, although red light was not suitable for longan ECs.
Fig 5. Flavonoid metabolites of longan ECs under different lighting conditions.
A, Flavonoid contents in longan ECs under different light qualities, at the light intensity of 32 μmol ·m-2 ·s-1 and photoperiod of 12h; B, Flavonoid compound contents of longan ECs under different light qualities, light intensity of 32 μmol ·m-2 ·s-1, at photoperiod of 12h/d; C, Flavonoid contents in longan ECs under blue light of different intensities, at photoperiod of 12h/d; D, Flavonoid contents in longan ECs under blue light of different photoperiods, at light intensity of 32 μmol ·m-2 ·s-1; Values represent means ± SDs of three replicates. Different upper/lower case letters indicate statistically significant difference at 0.01/0.05 levels by one-way ANOVA analysis in the duncan’s test.
3.3 Flavonoid pathway genes expression level changes of longan ECs
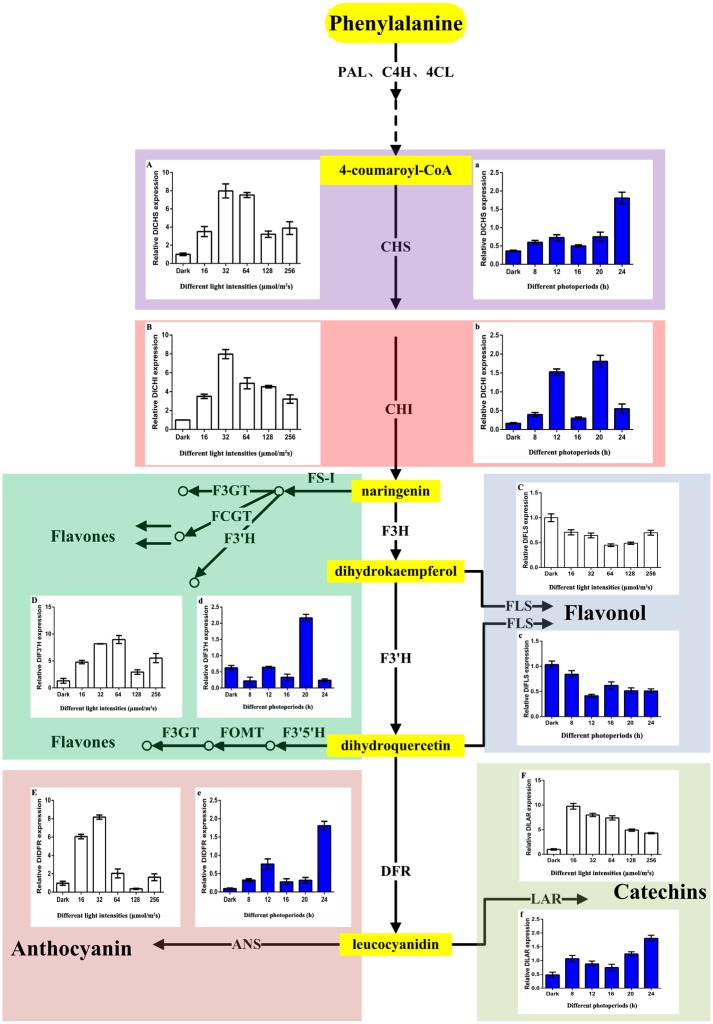
Real-time fluorescence quantitative analyses of the longan ECs flavonoid metabolic pathway genes under different blue light treatments were conducted. Six key genes were chosen from the flavonoid synthesis pathway: CHS and CHI are the first and second key genes, respectively, of the flavonoid synthesis pathway; FLS regulates flavonol compounds; F3′H has 35 family members in longan, which is the most members among the flavonoid pathway genes [14]; DFR is the key enzyme of anthocyanin synthesis; and LAR is the key gene of catechin synthesis [28] (Fig 6).
Fig 6. Flavonoid metabolic pathway genes of longan ECs under blue light.
A-E, Flavonoid metabolic pathway genes of longan ECs under blue light of different intensities, at photoperiod of 12h/d; a-e, Flavonoid metabolic pathway genes of longan ECs under blue light of different photoperiods, at light intensity of 32 μmol ·m-2 ·s-1.
Flavonoids metabolic pathway genes of longan ECs were affected by blue light of different intensities, DlCHS, DlCHI and DlDFR reached their peak value under blue light of 32 μmol·m-2·s-1. However, the expression of DlFLS had maximum value under the dark treatment, and the expression of DlFLS was suppressed under blue light treatment (Fig 6 and S10 Table). Flavonoid metabolic pathway genes of longan ECs had significant changes under blue light of different photoperiods. DlCHS, DlDFR and DlLAR had the highest expression under photoperiod of 24h/d. This may be because longan EC was affected by adversity. The expression of DlCHS, DlCHI and DlDFR was the second under photoperiod of 12h/d. In addition, DlFLS had the highest expression under the dark treatment (Fig 6 and S11 Table). The results of flavonoid contents were confirmed through qPCR analysis by the key gene expression of flavonoid pathway (Figs 5 and 6).
3.4 Regulation of flavonoid metabolism in longan ECs by miR393, miR394 and miR395 under blue light conditions
To further understand the regulatory roles of miRNAs in light-affected flavonoid metabolism in longan ECs, their expression levels, including those of miR393, miR394 and miR395, and their target genes DlTIR1-3, DlALMT12 and DlAPS1, respectively, as well as flavonoid pathway genes, were compared and analyzed. miR393, miR394 and miR395 are likely involved in the influence of light on longan ECs flavonoid metabolism. A psRNAtarget software-based analysis showed that miR393, miR394 and miR395 regulated DlTIR1-3, DlALMT12 and DlAPS1, respectively. In addition, CHS, CHI, FLS, F3′H, DFR and LAR were the key genes of flavonoid pathway.
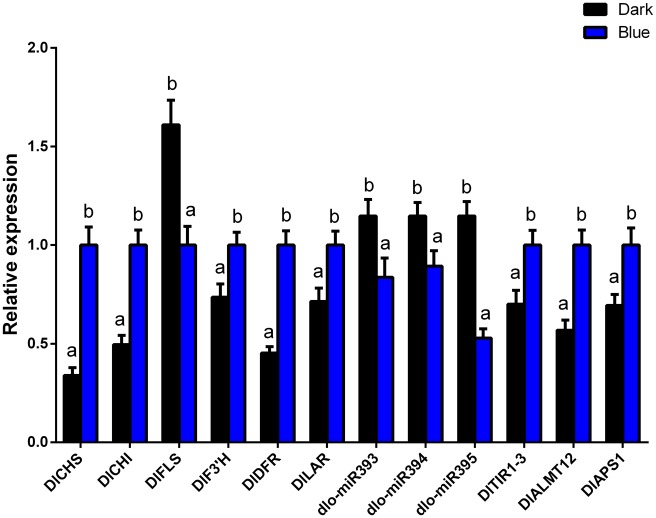
These key genes of flavonoid metabolism by qPCR analysis, compared with the dark group, flavonoid related key genes DlCHS, DlCHI, DlF3′H, DlDFR, DlLAR and target genes DlTIR1-3, DlALMT12, DlAPS1 all showed up-regulated trend under blue light treatment. However, miR393, miR394, miR395 and flavonoid key genes DlFLS all showed down-regulated trend (Fig 7 and S12 Table). Here, we speculated that miR393, miR394, and miR395 acted on target genes, which negatively regulated flavonoid key genes DlFLS and positively regulated key genes DlCHS, DlCHI, DlF3′H, DlDFR, DlLAR under blue light (Fig 7 and S12 Table). The expression of anthocyanin and catechin synthetic related genes were increased, resulting in the decreased conversion of dihydrokaempferol to kaempferol by FLS and the content of flavonols (Figs 6 and 7). Therefore, when blue light was the most appropriate, it might promote the accumulation of anthocyanin, catechins, inhibite the synthesis of flavonols.
Fig 7. miRNAs and flavonoid metabolish related genes of longan ECs under blue light.
Both light intensity and photoperiod were fixed at 32 μmol·m-2·s-1 and 12h/d respectively; Values represent means ± SDs of three replicates. Different lower case letters indicate statistically significant difference at 0.05 levels by one-way ANOVA analysis in the duncan’s test.
3.5 Analysis of miRNAs and target genes expression patterns under blue light of different intensities
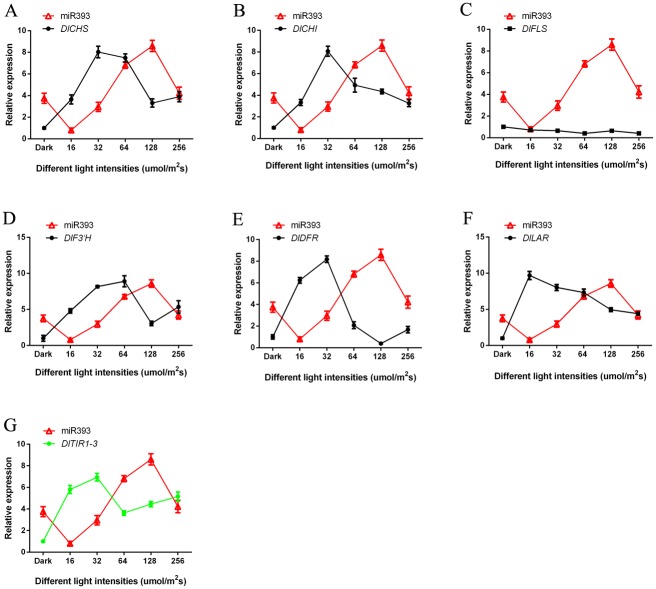
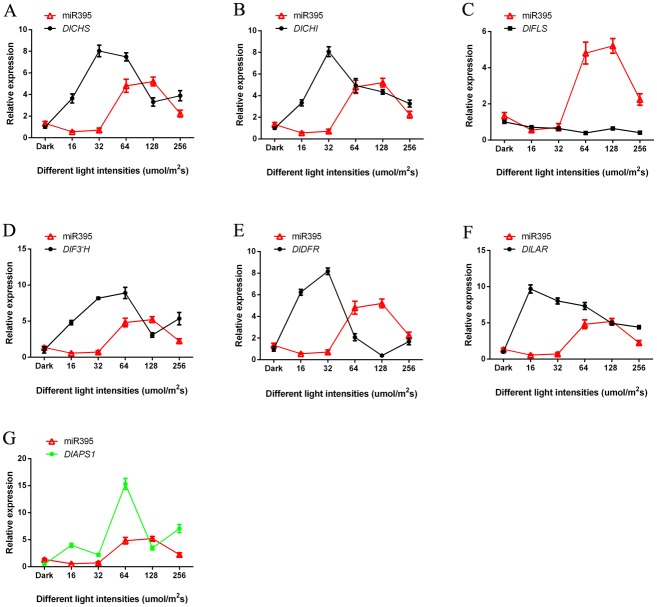
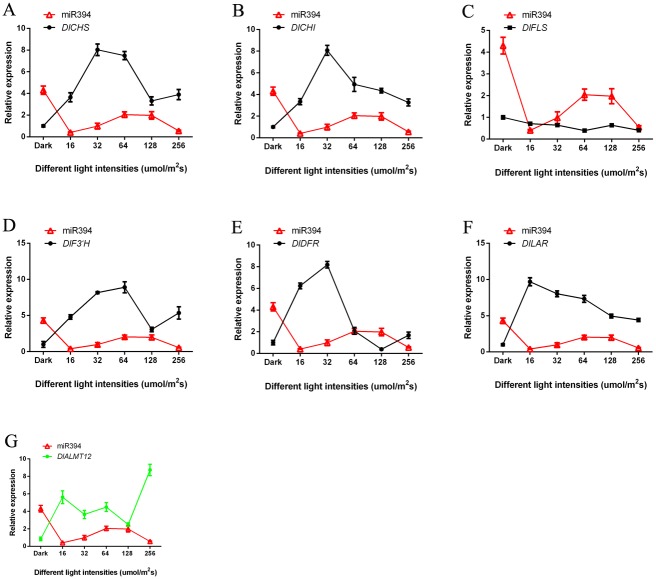
Flavonoid key genes of longan ECs under blue light of different intensities were analysised by qPCR. With the increase of the light intensity, the expression trend of miR393, miR394 and miR395 was basically the same (Figs 8–10 and S13 Table). The expression of miR393 under light intensity of 16 and 32 μmol·m-2·s-1 was lower than that under the dark. The expression of another intensity treatment was higher than dark treatment (Fig 8). However, the expression of miR394, miR395 under dark treatment was higher than that under blue light (Figs 9 and 10). This may be caused by the fact that different miRNAs had different expression patterns in response to blue light of different intensities.
Fig 8. The relationship of miR393 and flavonoid metabolish related genes under blue light of different intensities.
A, miR393 and DlCHS; B, miR393 and DlCHI; C, miR393 and DlFLS; D, miR393 and DlF3′H; E, miR393 and DlDFR; F, miR393 and DlLAR; G, miR393 and its target gene DlTIR1-3.
Fig 10. The relationship of miR395 and flavonoid metabolish related genes under blue light of different intensities.
A, miR395 and DlCHS; B, miR395 and DlCHI; C, miR395 and DlFLS; D, miR395 and DlF3′H; E, miR395 and DlDFR; F, miR395 and DlLAR; G, miR395 and its target gene DlAPS1.
Fig 9. The relationship of miR394 and flavonoid metabolish related genes under blue light of different intensities.
A, miR394 and DlCHS; B, miR394 and DlCHI; C, miR394 and DlFLS; D, miR394 and DlF3′H; E, miR394 and DlDFR; F, miR394 and DlLAR; G, miR394 and its target gene DlALMT12.
In this study, the trend of their expressions (miR393 and target gene DlTIR1-3, miR394 and target gene DlAlMT12, miR395 and target gene DlAPS1) presented negative correlation under blue light of different intensities in longan ECs (Figs 8–10 and S13 Table). This also confirmed that miR393, miR394, miR395 and target genes had a negative regulating relationship under blue light of different intensities in longan ECs. However, individual stages of the expression of miRNAs and target genes showed the same trend under blue light of different intensities. For example, miR393 target DlTIR1-3 during 16 μmol·m-2·s-1 to 32 μmol·m-2·s-1 and 64 μmol·m-2·s-1 to 128 μmol·m-2·s-1 (Fig 8). This might be the reason that a target gene was regulated by different members of the miRNAs family or other miRNAs in plant response to different light conditions. These miRNAs had their own role under blue light at different intensities. While some miRNA members could not regulate the expression of mRNA, other members complemented their functions and finally regulate the target genes.
The miR393, miR394, miR395 and DlFLS basically presented positive correlation, but the other flavonoid pathway gene DlCHS, DlCHI, DlF3′H, DlDFR and DlLAR basically presented a negative correlation under the blue light of different intensities treatment (Figs 8–10 and S13 Table). This indicated that miRNAs had different regulation methods for different genes in the pathway of flavonoids. So, as was shown in Fig 2B, the miR393, miR394, and miR395 promoted the synthesis of epicatechin, but inhibited the synthesis of rutin.
3.6 Analysis of miRNAs and target genes expression patterns under blue light of different photoperiods
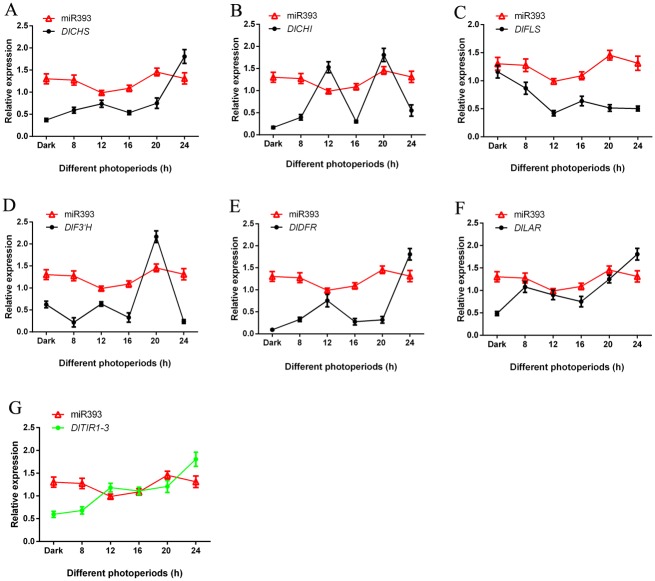
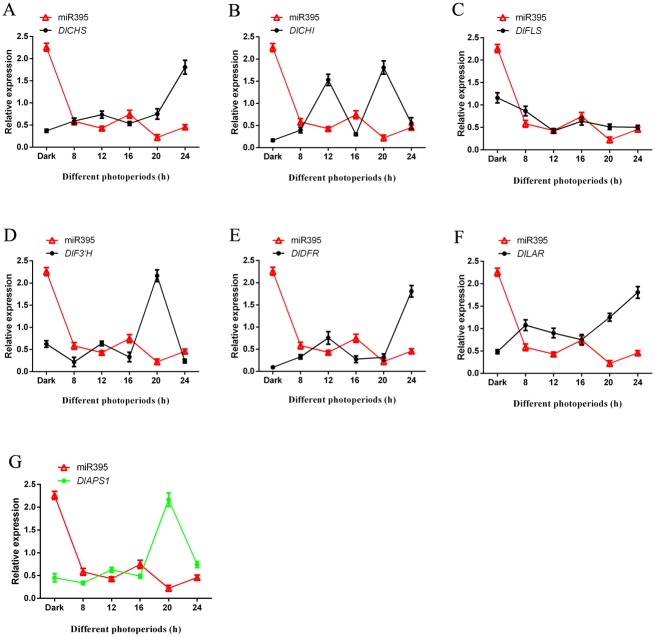
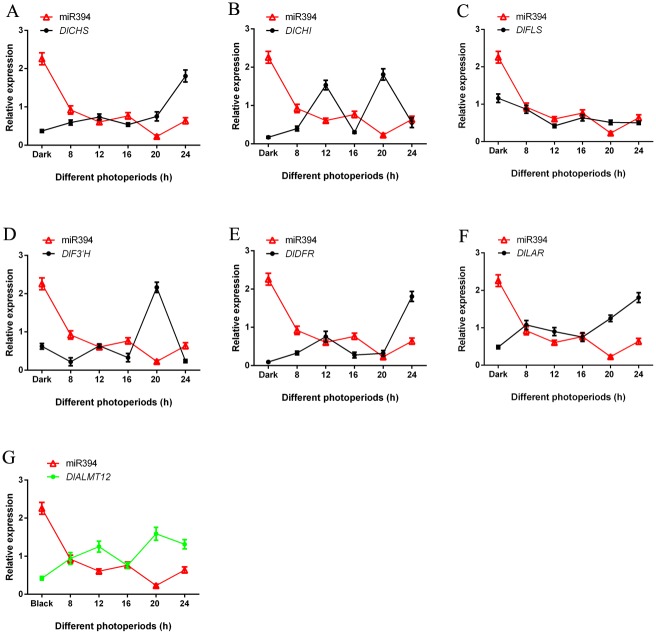
Flavonoid key genes of longan ECs under blue light of different photoperiods were analyzed by qPCR. With the extension of photoperiod, the expression trend of miR393, miR394 and miR395 was basically the same (Figs 11–13 and S14 Table). The expression of miR393 had small difference in the dark and blue light treatment (Fig 11). However, the expression of miR394, miR395 under dark treatment was much higher than that under blue light of different photoperiods (Figs 12 and 13).
Fig 11. The relationship of miR393 and flavonoid metabolish related genes under blue light of different photoperiods.
A, miR393 and DlCHS; B, miR393 and DlCHI; C, miR393 and DlFLS; D, miR393 and DlF3′H; E, miR393 and DlDFR; F, miR393 and DlLAR; G, miR393 and its target gene DlTIR1-3.
Fig 13. The relationship of miR395 and flavonoid metabolish related genes under blue light of different photoperiods.
A, miR395 and DlCHS; B, miR395 and DlCHI; C, miR395 and DlFLS; D, miR395 and DlF3′H; E, miR395 and DlDFR; F, miR395 and DlLAR; G, miR395 and its target gene DlAPS1.
Fig 12. The relationship of miR394 and flavonoid metabolish related genes under blue light of different photoperiods.
A, miR394 and DlCHS; B, miR394 and DlCHI; C, miR394 and DlFLS; D, miR394 and DlF3′H; E, miR394 and DlDFR; F, miR394 and DlLAR; G, miR394 and its target gene DlALMT12.
In this study, the trend of their expression (miR393 and target gene DlTIR1-3, miR394 and target gene DlAlMT12, miR395 and target gene DlAPS1) presented negative correlation under blue light of different photoperiods in longan ECs (Figs 11–13 and S14 Table). This also confirmed that miR393, miR394 and miR395 and target genes had a negative regulating relationship under blue light of different photoperiods in longan ECs. In addition, individual stages of the expression of miR393, miR394, miR395 and target genes also showed the same trend under blue light of different photoperiods.
In this treatment, the expression of miR393, miR394, miR395 and flavonoid key genes DlFLS had basically the same trend. However, the other flavonoid pathway gene DlCHS, DlCHI, DlF3’ H, DlDFR and DlLAR basically presented an opposite trend (Figs 11–13 and S14 Table). The expression trends of the longan flavonoids pathway gene and miR393, miR394, and miR395 were not exactly the same. This may be the reason that the longan flavonoid pathway gene contained multiple family members. For example, DlCHS had 14 family members and DlDFR had 4 family members and so on [14]. In this study, while some family members were unable to express at one stage of blue light, other family members might complement each other.
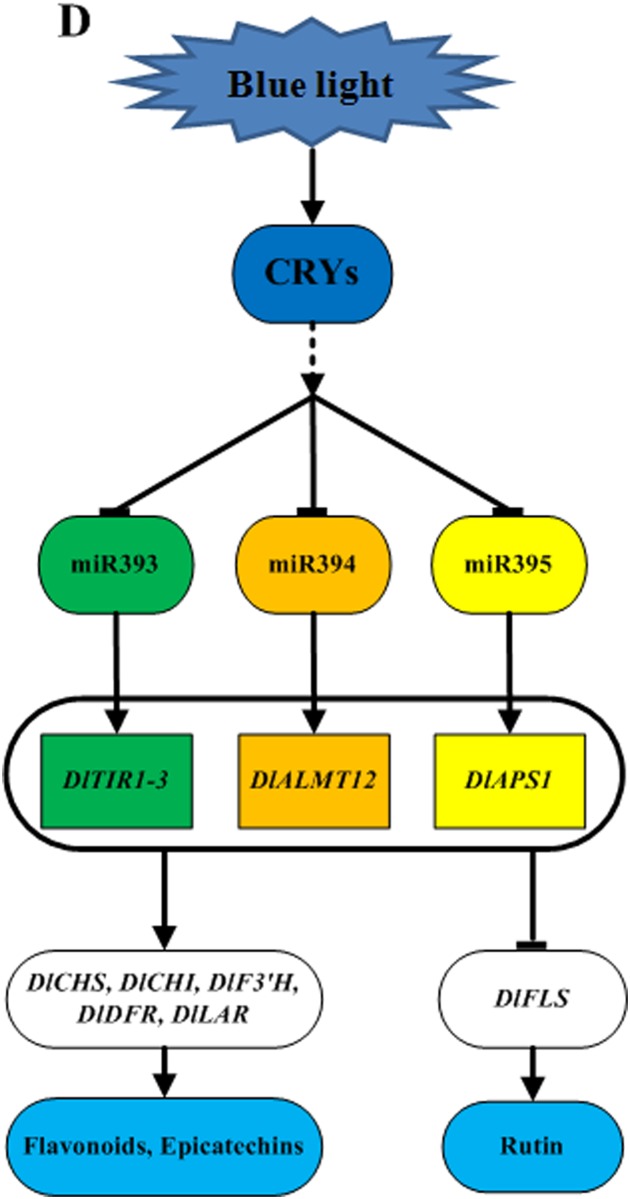
In conclusion, these results indicated that miR393 and its target gene DlTIR1-3, miR394 and its target gene DlAlMT12, and miR395 and its target gene DlAPS1 had a negative regulating relationship under blue light in longan ECs. Furthermore, miR393, miR394, and miR395 acted on target genes, which negatively regulated flavonoid key genes DlFLS and positively regulated key genes DlCHS, DlCHI, DlF3′H, DlDFR, DlLAR, and finally affected the accumulation of flavonoids. The treatment of longan ECs under the blue light at the intensity of 32 μmol·m-2·s-1 for 12 h/d inhibited the expression of miR393, miR394 and miR395, which promoted the expression of target genes and the accumulation of flavonoids and epicatechin, but inhibited the synthesis of rutin (Fig 14). This kind of regulation mechanism may need a further verification using genetic transformations.
Fig 14. The relationship of miR393, miR394, miR395 and flavonoid metabolism under blue light.
Flavonoid metabolic pathway genes: DlCHS, DlCHI, DlFLS, DlF3′H, DlDFR, DlLAR; Target genes: DlTIR1-3, DlALMT12, DlAPS1.
4 Discussion
4.1 Blue light was conducive to flavonoid accumulation in longan ECs
Controlling the quality of light is an effective means of secondary metabolites synthesis [18]. Changes in flavonoid contents are related to different light qualities and can be promoted by blue light or inhibited by red light in cell cultures of Saussurea medusa ‘Maxim’ [29]. Other studies on Saccharina japonica [30] and lettuce [31] also indicate that blue light promotes flavonoid synthesis. Thus, shorter wavelength conditions are more conducive to the accumulation of flavonoids [7]. Here, the longan EC flavonoid contents’ trend was blue light > green light > dark > white light > red light. The results also indicated that flavonoid synthesis was related to blue-light induction and connected to the absorption spectra of flavonoid substances in longan ECs. Moreover, metabolic-related gene expression levels were significantly higher than under other light-quality treatments. This supports the conclusion that short wavelength light is more efficient for flavonoid synthesis.
Different light qualities can be effectively used on plants under the appropriate optical density, termed photosynthetic photon flux density, conditions [32]. Thus, the secondary metabolism of plant cells can be controlled by the photosynthetic photon flux density. In the determination of flavonoid contents under different intensities of blue light, 32 μmol·m−2·s−1 was the most beneficial to the growth of, and flavonoid accumulation in, longan ECs. These results were in accordance with the flavonoid key gene expression results. Based on the different plant growth needs and characteristics, an appropriate light intensity can be selected for culturing. The carotenoid contents are higher under medium light intensity (270 μmol·m−2·s−1) followed by low (175 μmol·m−2·s−1) and high (450 μmol·m−2·s−1) in orchid tissue-cultured seedlings [33]. In tropical mangosteen (Garcinia mangostana) fruit [34], anthocyanin accumulation is not stimulated by light, and light can even decrease anthocyanin biosynthesis in pears [35]. Thus, the light intensity range is important, especially in plant cultivation, and even affects the repeatability and accuracy of experiments. In general, longan ECs are cultured in the dark. Therefore, the weak light intensity of 32 μmol·m−2·s−1 was adopted to study light effects on longan ECs.
The circadian rhythms of plant cells are affected by photoperiod, which effects the synthesis of secondary metabolites [36]. For the determination of flavonoid contents in longan ECs under different photoperiods of blue light, a photoperiod of 12 h/d was found most effective for the growth of, and flavonoid accumulation in, longan ECs. Flavonoid contents and key gene expression levels showed increasing trends with a photoperiod of 24 h/d. However, a significant reduction in the longan EC’s growth was observed owing to light stress. Almost all metabolic pathways include at least one enzyme that is under circadian transcriptional control [37]. Therefore, appropriately shortened or extended photoperiod for plants can change the contents of their secondary metabolites [38].
4.2 Regulatory miRNA-mediated mechanisms of flavonoid biosynthesis under blue light
Genes related to light-inducible flavonoid metabolic pathways have been widely reported [7]. However, investigations into the roles of miRNAs in light-mediated flavonoid metabolism are still lacking. Recently, ‘Omics’ analyses of the relevant miRNAs revealed that light affected secondary metabolic pathways. Integrated RNA seq and sRNA seq analyses have indicated that the regulation of miRNAs is closely linked to light-affected secondary metabolites in potato [39]. In agarwood, genes related to secondary metabolism were regulated under red light/far-red conditions, which are associated with the regulation of miRNAs and DNA methylation [40]. The results of this study were also confirmed that miR393, miR394 and miR395 acted on target genes and affected the accumulation of flavonoids under blue light condition in longan ECs.
In previous studies, researchers found that both miR393 [16] and TIR1[41] could regulate plant’s secondary metabolism. TIR1 was a key factor in the plant auxin signal transduction pathway[42]. The synthesis rate of flavonoids was improved by auxin, and there was a feedback effect between flavonoids and auxin [43]. Meanwhile, DlTIR1 promoter contained a lot of light reaction-related components [44] and flavonoid metabolism was regulated by DlTIR1 in light response. In addition, the fact of miR393 regulated target gene DlTIR1-3 and the model of the negative correlation between their expressions were confirmed by Lai et al [43]. In conclusion, miR393 acted on DlTIR1-3, then affected the accumulation of flavonoids under blue light conditions.
In our studies, the fact of miR394 regulated target gene DlALMT12 was also proved through psRNAtarget software analysis. As the blue light changes, miR394 and DlALMT12 present a negative correlation. In addition, ALMT have important regulation function in the synthesis of malic acid in the TCA [45]. In higher plants, secondary metabolism is intermediate product derived from primary metabolism tricarboxylic acid cycle (TCA), glycolysis system (EMP), pentose phosphate pathway (PPP) et al [46]. In short, miR394 acted on DlALMT12 and then further influenced the accumulation of flavonoids under blue light.
It was reported that miR395 could shear APS1 specifically. The over-expression of miR395 results in the APS1 unable to receive external signal stimulation [47]. The miR395 regulated target gene DlAPS1 was also proved through psRNAtarget software analysis in longan EC. As the blue light changes, miR395 and DlAPS1 present a negative regulatory correlation. Sulfate assimilation is a key component in both primary and secondary metabolisms. An essential step in this pathway is the activation of sulfate through adenylation by the enzyme ATP sulfurylase (ATPS), forming adenosine 5’-phosphosulfate (APS) [48]. In brief, miR395 targeted DlAPS1, then influenced flavonoid synthesis under blue light conditions.
The miRNAs can act on the genes encoding its rate-limiting enzyme, and also act on transcription factors, then regulate the secondary metabolism of plants [49]. Degradome sequencing of the tea (Camellia sinensis) miRNA target genes indicates that Csn-miR167a targets CHI and Csn-miR2593e targets ANR then regulates the accumulation of flavonoids [50]. However, miR393, miR394, and miR395 acted on transcription factors and regulated flavonoid synthesis in this study. Transcription factors can be used as target genes of miRNAs, and the function of some transcription factors involves the transduction of plant hormone signals. Secondary metabolism is closely related to hormone signal transduction [51]. Arabidopsis miR393 can act on auxin response factors 1 and 9, and thus, regulates glucosinolate synthesis [19]. The negative regulation of anthocyanin biosynthesis by a miR156-targeted SPL transcription factor (SPL involves the transduction of hormone signals) was described by Gou et al [20]. Another type of transcription factor may directly participate in the blue light signal network, thus affecting the synthesis of flavonoids. The blue light signal network has been drawn in the study of Arabidopsis [52]. Therefore, it is further verified that the target gene of miRNAs may participate in the blue light signal network and thus regulates the metabolism of flavonoids.
The miRNAs may affect the expression levels of multiple structural genes in the flavonoid pathways, and the effects of miRNAs may be more obvious than those of certain flavonoid-related genes [15]. miRNAs are important regulatory factors in plants and help mediate the influence of light signals on flavonoid metabolism.
Thus, miR393, miR394, and miR395 played an important role in the flavonoid metabolism of longan ECs under blue light conditions, which needed to be further verification using genetic transformations.
5. Conclusion
In our study, miR393 and its target gene DlTIR1-3, miR394 and its target gene DlAlMT12, and miR395 and its target gene DlAPS1 had a negative regulating relationship under blue light in longan ECs. Furthermore, miR393, miR394, and miR395 acted on target genes, which negatively regulated flavonoid key genes DlFLS and positively regulated key genes DlCHS, DlCHI, DlF3′H, DlDFR, DlLAR, and finally affected the accumulation of flavonoids. The miRNAs played an important role in the flavonoids metabolism of longan ECs regulated by blue light, which showed that light regulated the molecular mechanism of flavonoids metabolism in plants.
Supporting information
(TIF)
(TIF)
(TIF)
A, dark treatment; B, blue light treatment; 1, epicatechin.
(TIF)
A, dark treatment; B, blue light treatment; 2, rutin.
(TIF)
(DOCX)
(DOCX)
(DOCX)
(DOCX)
(DOCX)
(DOCX)
(DOCX)
(DOCX)
(DOCX)
(DOCX)
(DOCX)
(DOCX)
(DOCX)
(DOCX)
Acknowledgments
This work was funded by the National Natural Science Foundation of China (31572088, 3167212), the Science and Technology Plan Major Projects of Fujian Province (2015NZ0002-1), the Natural Science Funds for Distinguished Young Scholar in Fujian Province (2015J06004), the program for New Century Excellent Talents in Fujian Province University (20151104) and the Program for High-level University Construction of the Fujian Agriculture and Forestry University (612014028).
We thank Lesley Benyon, PhD, from Liwen Bianji, Edanz Group China (http://www.liwenbianji.cn/ac), for editing the English text of a draft of this manuscript.
Data Availability
All relevant data are within the paper and its Supporting Information files.
Funding Statement
This work was funded by the National Natural Science Foundation of China (31572088,3167212), the Science and Technology Plan Major Projects of Fujian Province (2015NZ0002-1), the Natural Science Funds for Distinguished Young Scholar in Fujian Province (2015J06004), the program for New Century Excellent Talents in Fujian Province University (20151104) and the Program for High-level University Construction of the Fujian Agriculture and Forestry University (612014028).
References
- 1.Sudjaroen Y, Hull WE, Erben G, Würtele G, Changbumrung S, Ulrich CM, et al. Isolation and characterization of ellagitannins as the major polyphenolic components of Longan (Dimocarpus longan Lour) seeds. Phytochemistry. 2012; 77: 226–237. doi: 10.1016/j.phytochem.2011.12.008 [DOI] [PubMed] [Google Scholar]
- 2.Xia T, Gao LP. Advances in biosynthesis pathways and regulation of flavonoids and catechins. Scientia Agricultura Sinica. 2009; 2899–2908. [Google Scholar]
- 3.Jiang C, Gao X, Liao L, Harberd NP, Fu X. Phosphate starvation root architecture and anthocyanin accumulation responses are modulated by the gibberellin-DELLA signaling pathway in Arabidopsis. Plant Physiology. 2007; 145: 1460 doi: 10.1104/pp.107.103788 [DOI] [PMC free article] [PubMed] [Google Scholar]
- 4.Qiao X, Jiang S, Li X, Li F, Zhao D. Effects of phytohormones on plant regeneration and production of flavonoids in transgenic Saussurea involucrata hairy roots. Chinese Journal of Biotechnology. 2011; 27: 69 [PubMed] [Google Scholar]
- 5.Wang YS, Gao LP, Wang ZR, Liu YJ, Sun ML, Yang DQ, et al. Light-induced expression of genes involved in phenylpropanoid biosynthetic pathways in callus of tea (Camellia sinensis (L.) O. Kuntze). Scientia Horticulturae. 2012; 133: 72–83. [Google Scholar]
- 6.Åman O. The effect of different light spectra on berry callus pigment accumulation, lipid composition and secondary metabolism. 2014.
- 7.Zoratti L, Karppinen K, Luengo Escobar A, Haggman H, Jaakola L. Light-controlled flavonoid biosynthesis in fruits. Front Plant Sci. 2014; 5: 534 doi: 10.3389/fpls.2014.00534 [DOI] [PMC free article] [PubMed] [Google Scholar]
- 8.Wei YZ, Hu FC, Hu GB, Li XJ, Huang XM, Wang HC. Differential expression of anthocyanin biosynthetic genes in relation to anthocyanin accumulation in the pericarp of litchi chinensis sonn. Plos One. 2011; 6: e19455 doi: 10.1371/journal.pone.0019455 [DOI] [PMC free article] [PubMed] [Google Scholar]
- 9.Docimo T, Francese G, Ruggiero A, Batelli G, Palma MD, Bassolino L, et al. Phenylpropanoids accumulation in eggplant fruit: characterization of biosynthetic genes and regulation by a MYB transcription factor. Front Plant Sci. 2015; 6: 1233 doi: 10.3389/fpls.2015.01233 [DOI] [PMC free article] [PubMed] [Google Scholar]
- 10.Kruszka K, Pieczynski M, Windels D, Bielewicz D, Jarmolowski A, Szweykowska-Kulinska Z, et al. Role of microRNAs and other sRNAs of plants in their changing environments. Journal of Plant Physiology. 2012; 169: 1664–1672. doi: 10.1016/j.jplph.2012.03.009 [DOI] [PubMed] [Google Scholar]
- 11.Li J, Reichel M, Li Y, Millar AA. The functional scope of plant microRNA-mediated silencing. Trends in Plant Science. 2014; 19: 750–756. doi: 10.1016/j.tplants.2014.08.006 [DOI] [PubMed] [Google Scholar]
- 12.Sunkar R, Li YF, Jagadeeswaran G. Functions of microRNAs in plant stress responses. Trends in Plant Science. 2012; 17: 196 doi: 10.1016/j.tplants.2012.01.010 [DOI] [PubMed] [Google Scholar]
- 13.Zhu C, Ding Y, Liu H. MiR398 and plant stress responses. Physiol Plant. 2011; 143: 1 doi: 10.1111/j.1399-3054.2011.01477.x [DOI] [PubMed] [Google Scholar]
- 14.Lin Y, Min J, Lai R, Wu Z, Chen Y, Yu L, et al. Genome-wide sequencing of longan (Dimocarpus longan Lour.) provides insights into molecular basis of its polyphenol-rich characteristics. Gigascience. 2017; 6: 1. [DOI] [PMC free article] [PubMed] [Google Scholar]
- 15.Bulgakov VP, Avramenko TV. New opportunities for the regulation of secondary metabolism in plants: focus on microRNAs. Biotechnology Letters. 2015; 37: 1719–1727. doi: 10.1007/s10529-015-1863-8 [DOI] [PubMed] [Google Scholar]
- 16.Robertseilaniantz A, Maclean D, Jikumaru Y, Hill L, Yamaguchi S, Kamiya Y, et al. The microRNA miR393 re-directs secondary metabolite biosynthesis away from camalexin and towards glucosinolates. Plant Journal. 2011; 67: 218–231. doi: 10.1111/j.1365-313X.2011.04591.x [DOI] [PubMed] [Google Scholar]
- 17.Gou JY, Wang JW. Negative regulation of anthocyanin biosynthesis in Arabidopsis by a miR156-targeted SPL transcription factor. Plant Cell. 2011; 23: 1512–1522. doi: 10.1105/tpc.111.084525 [DOI] [PMC free article] [PubMed] [Google Scholar]
- 18.Lin K, Xu Y. Effect of LED illumination on the accumulation of functional chemicals in plants. Chinese Bulletin of Botany. 2015; 50: 263. [Google Scholar]
- 19.Lin K, Xu Y. Application of LED light control technology in lettuce factory cultivation. Northern Horticulture. 2016; (22): 198–203. [Google Scholar]
- 20.Lai Z. Somatic embryogenesis of high frequency from longan embryogenic calli. Journal of Fujian Agricultural University. 1997; 26(3): 271–276. [Google Scholar]
- 21.Lai Z, Chen C, Zeng L, Chen Z. Somatic embryogenesis in longan [Dimocarpus longan Lour.]: Springer; Netherlands: 2000; 415–431 p. [Google Scholar]
- 22.Dong HX, Zhou YR, Tian QL, Lai GD, Lin YL, Lai ZX. Effects of different light qualities on the contents of flavonoids of embryonic callus in Dimocarpus longan Lour. Chinese Journal of Tropical Crops. 2014; 35(12): 2374–2377. [Google Scholar]
- 23.Kun LI, Zhang DC, Shan You-Xi. The quantitation of flavonoids in leaf and stalk of different celery cultivars and the correlation with antioxidation activity. Acta Horticulturae Sinica. 2011; 57: 133–139. [Google Scholar]
- 24.Zuo W, Xu J, Zhou C, Gan L. Simultaneous determination of five flavonoid compounds in leaves of Adinandra nitida by HPLC-PAD. China Journal of Chinese Materia Medica. 2010; 35(18): 2406 [PubMed] [Google Scholar]
- 25.Pei XP, Du CH, Yan Y, Shen JX, Pei MR, Bai Y. Determination of rutin from leaves of Ziziphus jujuba gathered in different areas and different periods by HPLC-UV. Chinese Journal of Experimental Traditional Medical Formulae. 2011; 17(21): 94–96. [Google Scholar]
- 26.Lin YL, Lai ZX. Reference gene selection for qPCR analysis during somatic embryogenesis in longan tree. Plant Science. 2010; 178: 359–365. [Google Scholar]
- 27.Yu LL, Zhong XL. Evaluation of suitable reference genes for normalization of microRNA expression by real-time reverse transcription PCR analysis during longan somatic embryogenesis. Plant Physiology & Biochemistry Ppb. 2013; 66: 20. [DOI] [PubMed] [Google Scholar]
- 28.Tohge T, Watanabe M, Hoefgen R, Fernie AR. Shikimate and phenylalanine biosynthesis in the green lineage. Frontiers in Plant Science. 2013; 4: 62 doi: 10.3389/fpls.2013.00062 [DOI] [PMC free article] [PubMed] [Google Scholar]
- 29.Zhao D, Li M, Xing J, Tong Z. Effects of light on cell growth and flavonoids biosynthesis in callus cultures of Saussurea medusa Maxim. Acta Photophysiologica Sinica. 1999; 25(2): 127–132. [Google Scholar]
- 30.Deng Y, Yao J, Wang X, Guo H, Duan D. Transcriptome sequencing and comparative analysis of Saccharina japonica (Laminariales, Phaeophyceae) under blue light induction. Plos One. 2012; 7: e39704 doi: 10.1371/journal.pone.0039704 [DOI] [PMC free article] [PubMed] [Google Scholar]
- 31.Son KH, Oh MM. Leaf shape, growth, and antioxidant phenolic compounds of two lettuce cultivars grown under various combinations of blue and red light-emitting diodes. Hortscience A Publication of the American Society for Horticultural Science. 2013; 48: 988–995. [Google Scholar]
- 32.Hai-Yang LU, Liu XY, Cong-Cong SI, Jiao XL, Zhi-Gang XU. Effects of different PPFD on growth and quality of non-heading chinese cabbages. Plant Physiology Journal. 2015; (6): 909–915. [Google Scholar]
- 33.Jeon MW, Ali MB, Hahn EJ, Paek KY. Effects of photon flux density on the morphology, photosynthesis and growth of a CAM orchid, Doritaenopsis during post-micropropagation acclimatization. Plant Growth Regulation. 2005; 45: 139–147. [Google Scholar]
- 34.Palapol Y, Ketsa S, Linwang K, Ferguson IB, Allan AC. A MYB transcription factor regulates anthocyanin biosynthesis in mangosteen (Garcinia mangostana L.) fruit during ripening. Planta. 2009; 229: 1323–1334. doi: 10.1007/s00425-009-0917-3 [DOI] [PubMed] [Google Scholar]
- 35.Zhang X, Allan AC, Yi Q, Chen L, Li K, Shu Q, et al. Differential gene expression analysis of yunnan red pear, Pyrus Pyrifolia, during fruit skin coloration. Plant Molecular Biology Reporter. 2011; 29: 305–314. [Google Scholar]
- 36.Fukushima A, Kusano M, Nakamichi N, Kobayashi M, Hayashi N, Sakakibara H, et al. Impact of clock-associated Arabidopsis pseudo-response regulators in metabolic coordination. Proceedings of the National Academy of Sciences of the United States of America. 2009; 106: 7251–7256. doi: 10.1073/pnas.0900952106 [DOI] [PMC free article] [PubMed] [Google Scholar]
- 37.Farré EM, Weise SE. The interactions between the circadian clock and primary metabolism. Current Opinion in Plant Biology. 2012; 15: 293 doi: 10.1016/j.pbi.2012.01.013 [DOI] [PubMed] [Google Scholar]
- 38.Kanazawa K, Hashimoto T, Yoshida S, Sungwon P, Fukuda S. Short photoirradiation induces flavonoid synthesis and increases its production in postharvest vegetables. Journal of Agricultural & Food Chemistry. 2012; 60: 4359. [DOI] [PubMed] [Google Scholar]
- 39.Qiao Y, Zhang J, Zhang J, Wang Z, Ran A, Guo H, et al. Integrated RNA-seq and sRNA-seq analysis reveals miRNA effects on secondary metabolism in Solanum tuberosum L. Molecular Genetics and Genomics. 2017; 292: 37–52. doi: 10.1007/s00438-016-1253-5 [DOI] [PubMed] [Google Scholar]
- 40.Kuo TC, Chen CH, Chen SH, Lu IH, Chu MJ, Huang LC, et al. The effect of red light and far-red light conditions on secondary metabolism in agarwood. BMC Plant Biology. 2015; 15: 139 doi: 10.1186/s12870-015-0537-y [DOI] [PMC free article] [PubMed] [Google Scholar]
- 41.Chen Z, Hu L, Han N, Hu J, Yang Y, Xiang T, et al. Overexpression of a miR393-resistant form of transport inhibitor response protein 1 (mTIR1) enhances salt tolerance by increased osmoregulation and Na+ exclusion in Arabidopsis thaliana. Plant & Cell Physiology. 2015; 56: 73. [DOI] [PubMed] [Google Scholar]
- 42.Nishimura TN, Hitomi, Hayashi KI, Niwa C, Koshiba T. Differential downward stream of auxin synthesized at the tip has a key role in gravitropic curvature via TIR1/AFBs-mediated auxin signaling pathways. Plant & Cell Physiology. 2009; 50: 1874–1885. [DOI] [PubMed] [Google Scholar]
- 43.Hectors K, Van Oevelen S, Guisez Y, Prinsen E, Jansen MAK. The phytohormone auxin is a component of the regulatory system that controls UV-mediated accumulation of flavonoids and UV-induced morphogenesis. Physiologia Plantarum. 2012; 145: 594 doi: 10.1111/j.1399-3054.2012.01590.x [DOI] [PubMed] [Google Scholar]
- 44.Lai R, Lin Y, Lai Z. Cloning of auxin receptor gene TIR1 and its interaction with miR393 in Dimocarpus longan Lour. Chinese Journal of Applied & Environmental Biology. 2016; 22: 95–102. [Google Scholar]
- 45.Chen ZC, Zhao XQ, Shen RF. Extraction of total RNA and cloning and expression of ALMT gene fragment in Lespedeza bicolor. Soils. 2011; 43(3): 433–438. [Google Scholar]
- 46.Wang CL, Liang ZS. Research progress of signal transduction pathway and regulation of secondary metabolism in plant induced by exogenous stimulus. Acta Botanica Boreali-Occidentalia Sinica. 2009; 29(5): 1055–1065. [Google Scholar]
- 47.Kim JY, Lee HJ, Jung HJ, Maruyama K, Suzuki N, Kang H. Overexpression of microRNA395c or 395e affects differently the seed germination of Arabidopsis thaliana under stress conditions. Planta. 2010; 232: 1447 doi: 10.1007/s00425-010-1267-x [DOI] [PubMed] [Google Scholar]
- 48.Mougous JD, Dong HL, Hubbard SC, Schelle MW, Vocadlo DJ, Berger JM, et al. Molecular basis for G protein control of the prokaryotic ATP sulfurylase. Molecular Cell. 2006; 21: 109 doi: 10.1016/j.molcel.2005.10.034 [DOI] [PubMed] [Google Scholar]
- 49.Zhou FM, Bai ZC, Lu SF. MicroRNA in medicinal plants. Chinese Traditional & Herbal Drugs. 2013; 44: 232–237. [Google Scholar]
- 50.Sun P, Cheng C, Lin Y, Zhu Q, Lin J, Lai Z, et al. Combined small RNA and degradome sequencing reveals complex microRNA regulation of catechin biosynthesis in tea (Camellia sinensis). Plos One. 2017; 12: e0171173 doi: 10.1371/journal.pone.0171173 [DOI] [PMC free article] [PubMed] [Google Scholar]
- 51.Xi YU, Zhao H, Miao MA. Effect of hormone on content of total flavonoids in callus of Glycyrrhiza glabra L. Journal of Shihezi University. 2011; 29(4): 416–419. [Google Scholar]
- 52.Jiao Y, Lau OS, Deng XW. Light-regulated transcriptional networks in higher plants. Nature Reviews Genetics. 2007; 8: 217–230. doi: 10.1038/nrg2049 [DOI] [PubMed] [Google Scholar]
Associated Data
This section collects any data citations, data availability statements, or supplementary materials included in this article.
Supplementary Materials
(TIF)
(TIF)
(TIF)
A, dark treatment; B, blue light treatment; 1, epicatechin.
(TIF)
A, dark treatment; B, blue light treatment; 2, rutin.
(TIF)
(DOCX)
(DOCX)
(DOCX)
(DOCX)
(DOCX)
(DOCX)
(DOCX)
(DOCX)
(DOCX)
(DOCX)
(DOCX)
(DOCX)
(DOCX)
(DOCX)
Data Availability Statement
All relevant data are within the paper and its Supporting Information files.


