

In this study, we demonstrated the feasibility of a deep learning–based approach for MR imaging–based attenuation correction (MRAC) that performs better than current clinical approaches, with deep MRAC producing a PET reconstruction error that is lower than 1% in most brain regions.
Abstract
Purpose
To develop and evaluate the feasibility of deep learning approaches for magnetic resonance (MR) imaging–based attenuation correction (AC) (termed deep MRAC) in brain positron emission tomography (PET)/MR imaging.
Materials and Methods
A PET/MR imaging AC pipeline was built by using a deep learning approach to generate pseudo computed tomographic (CT) scans from MR images. A deep convolutional auto-encoder network was trained to identify air, bone, and soft tissue in volumetric head MR images coregistered to CT data for training. A set of 30 retrospective three-dimensional T1-weighted head images was used to train the model, which was then evaluated in 10 patients by comparing the generated pseudo CT scan to an acquired CT scan. A prospective study was carried out for utilizing simultaneous PET/MR imaging for five subjects by using the proposed approach. Analysis of covariance and paired-sample t tests were used for statistical analysis to compare PET reconstruction error with deep MRAC and two existing MR imaging–based AC approaches with CT-based AC.
Results
Deep MRAC provides an accurate pseudo CT scan with a mean Dice coefficient of 0.971 ± 0.005 for air, 0.936 ± 0.011 for soft tissue, and 0.803 ± 0.021 for bone. Furthermore, deep MRAC provides good PET results, with average errors of less than 1% in most brain regions. Significantly lower PET reconstruction errors were realized with deep MRAC (−0.7% ± 1.1) compared with Dixon-based soft-tissue and air segmentation (−5.8% ± 3.1) and anatomic CT-based template registration (−4.8% ± 2.2).
Conclusion
The authors developed an automated approach that allows generation of discrete-valued pseudo CT scans (soft tissue, bone, and air) from a single high-spatial-resolution diagnostic-quality three-dimensional MR image and evaluated it in brain PET/MR imaging. This deep learning approach for MR imaging–based AC provided reduced PET reconstruction error relative to a CT-based standard within the brain compared with current MR imaging–based AC approaches.
© RSNA, 2017
Introduction
Simultaneous positron emission tomography (PET)/magnetic resonance (MR) imaging has been developed to combine the soft-tissue contrast of MR imaging with the molecular sensitivity and specificity of PET. However, a remaining challenge lies in obtaining a reliable photon attenuation correction (AC) map, which is crucial for accurate PET quantitation. The lack of direct bone estimation from conventional MR imaging–based AC (MRAC) approaches has led to a variety of novel strategies being applied (1–3), including atlas-based methods, image segmentation–based methods (particularly those using ultrashort echo time and zero echo time approaches), and methods based on joint estimation of activity and attenuation with use of time-of-flight PET. Although each of these proposed solutions has specific merits and limitations (3), the development of rapid and robust MRAC is still currently an unmet need. A summary of current approaches used for MRAC is included in Appendix E1 (online).
Deep learning approaches with convolutional neural networks have recently been applied to medical imaging (4), with successful implementations showing promising results segmenting brain structures (5), brain tumors (6), cardiac structures (7), and bone and cartilage (8) on MR images. The purpose of this study was to develop and evaluate the feasibility of deep learning approaches for MRAC (termed deep MRAC) in brain PET/MR imaging.
Materials and Methods
This study was partially supported by GE Healthcare (Waukesha, Wis) through equipment provided to the authors’ department. The authors had control of study data and any information submitted for publication at all times.
Convolutional Auto-Encoder Architecture
The critical component of the deep MRAC method is a deep convolutional auto-encoder (CAE) network, which is capable of providing robust tissue labeling. The CAE framework was built on the basis of network structures that have been used in studies for natural image object recognition (9) and for MR imaging segmentation for musculoskeletal tissues (8). An illustration of this CAE network is shown in Figure 1. The entire network consists of a connected encoder network and a decoder network. The encoder uses the same 13 convolutional layers applied from the VGG16 network (10) designed for object recognition. Each layer in the encoder consists of two-dimensional convolution with a set of filters for detecting image features, batch normalization for accelerating network convergence (11), and rectified linear unit activation (12), followed by max pooling for reduction of data dimensions. By repeating the encoder layer multiple times, the network can achieve efficient data compression while probing robust and spatial invariant image features. To reconstruct pixelwise tissue labels, a decoder network is applied after the encoder network. This decoder network is the reverse process of the encoder and consists of mirrored layers of the encoder network. The max pooling in the decoder is substituted by means of an upsampling process, where image features are consistently resampled to fully recover the original image size. The final layer of the decoder network is a multiclass softmax classifier (13), which produces class probabilities for each pixel.
Figure 1:

Schematic illustration of deep MRAC. Process consists of training phase and reconstruction (Recon) phase. BN = batch normalization, ReLu = rectified-linear unit.
Deep MRAC Network Training Procedure
The training data for deep MRAC consists of raw MR images as input and reference tissue labels for air, bone, and soft tissue obtained by processing coregistered unenhanced CT data. CT images were coregistered to MR images by using a rigid Euler transformation followed by nonrigid B-spline transformation with use of existing image registration tools (14). For each training dataset, the three-class tissue reference mask was created by means of pixel intensity–based thresholding (>600 HU for bone, less than −500 HU for air, and otherwise soft tissue) of the coregistered CT scan as shown in Figure 2. For the training procedure, three-dimensional MR and CT volume data were input into the model as a stack of two-dimensional axial images. All two-dimensional input images were normalized by using local contrast normalization (15) and resampled to a 340 × 340 matrix size by using bilinear interpolation before being used as input to the CAE. The encoder and decoder network weights were initialized by using an initialization scheme described by He et al (16) and updated by using stochastic gradient descent (17) with a fixed learning rate of 0.01 and momentum of 0.9. The CAE network iteratively estimates output tissue labels and compares them to the reference mask generated from CT data. Reference CT data ensure that network learns the relationship between MR image contrast and reference tissue labels. The network was trained by using multiclass cross-entropy loss (18) as an objective function, where the loss is calculated in a mini-batch of four images in each iteration. The network training was performed with 60 000 iteration steps, which correspond to 33 epochs for our training data to achieve training loss convergence. The training data were shuffled before each epoch to create randomization in batch training. Other network parameters include an increased number of convolutional filters from 64 to 512 from the first layer to the last in the encoder network. The max pooling layer used a 2 × 2 window with a stride of 2, which leads to an image reduction factor of 2. The upsampling process in the decoder network used a nearest-neighbor interpolation, which increases image size by a factor of 2 through each layer. Once the training phase was complete, the CAE network structure was fixed and used for labeling of bone, air, and soft tissue for new MR images, which were subsequently processed into pseudo CT images.
Figure 2a:
Example of training data for deep MRAC. (a) T1-weighted BRAVO MR image obtained at 1.5 T, (b) real CT image spatially registered to MR image, and (c) tissue reference mask generated from spatially registered CT image. Pixel intensity–based thresholding is performed to create tissue reference mask (three classes: air, bone, and soft tissue) for training data.
Figure 2b:
Example of training data for deep MRAC. (a) T1-weighted BRAVO MR image obtained at 1.5 T, (b) real CT image spatially registered to MR image, and (c) tissue reference mask generated from spatially registered CT image. Pixel intensity–based thresholding is performed to create tissue reference mask (three classes: air, bone, and soft tissue) for training data.
Figure 2c:
Example of training data for deep MRAC. (a) T1-weighted BRAVO MR image obtained at 1.5 T, (b) real CT image spatially registered to MR image, and (c) tissue reference mask generated from spatially registered CT image. Pixel intensity–based thresholding is performed to create tissue reference mask (three classes: air, bone, and soft tissue) for training data.
In this study, the deep MRAC framework was implemented in a hybrid computing environment involving Python, MATLAB, and C/C++. The CAE network was modified and fine-tuned based on the Caffe implementation with GPU parallel computing support (13).
Image Datasets for Training
Our study was performed in compliance with Health Insurance Portability and Accountability Act regulations and with approval from our institutional review board. All prospective subjects provided written informed consent before their participation in the study. All retrospective subject data were obtained with a waiver of consent under institutional review board approval. Training and evaluation of the proposed deep MRAC method was carried out by performing an institutional review board–approved retrospective analysis of head images from 40 subjects who underwent both high-spatial-resolution T1-weighted contrast material–enhanced three-dimensional MR imaging and unenhanced CT on the same day for the evaluation of acute stroke. Subjects had a median age of 61 years (range, 21–91 years), and there were 22 men and 18 women. Gadobenate dimeglumine (MultiHance; Bracco Diagnostics, Princeton, NJ) was administered at 0.1 mmol/kg. The postcontrast T1-weighted image was chosen as the input to our model because this protocol best captures the whole head of the subject (not just the brain) compared with other MR imaging series used at our institution. Note that future models should use prospectively optimized MR imaging acquisitions; however, the capability of using retrospective data is a significant strength of deep learning approaches. The MR images used to train and test the model were obtained with a 1.5-T unit (Signa HDxt or MR450w, GE Healthcare) by using an eight-channel receive-only head coil with the following parameters: T1-weighted BRAVO pulse sequence, 0.46–0.52-mm transaxial voxel dimensions, 1.2-mm-thick sections, 450-msec inversion time, 8.9–10.4-msec repetition time, 3.5–3.8-msec echo time, and 13° flip angle. Likewise, CT images were obtained with three scanners (Optima CT 660, Discovery CT750HD, or Revolution GSI; GE Healthcare) with the following acquisition and/or reconstruction settings: 0.43–0.46-mm transaxial voxel dimensions, 1.25–2.5-mm-thick sections, 120 kVp, automatic exposure control with GE noise index of 2.8–12.4, and helical pitch of 0.53.
The CAE network was trained by using 30 randomly selected subjects and evaluated in the 10 remaining subjects. All training and testing was performed with a desktop computer running a 64-bit Linux operating system with an Intel Xeon W3520 quad-core CPU, 12 GB DDR3 RAM, and a Nvidia Quadro K4200 graphic card (1344 CUDA cores, 4GB GDDR5 RAM).
Pseudo CT Scan Generation
The output of the CAE, which are class probabilities for each pixel of the image, were then converted into pseudo CT scans. For simplicity, pixels were assigned a Hounsfield unit value corresponding to the tissue class with the highest probability. Assigned values were −1000 HU, 42 HU, and 939 HU for air, soft tissue, and bone, respectively, which is consistent with values used in other studies (19–21).
Evaluation of Deep MRAC Tissue Labeling Accuracy
Evaluation of the accuracy of pseudo CT scans was performed in 10 subjects that were not included in the training phase of the CAE network. The Dice coefficient, a similarity measure ranging from 0 to 1 that describes the overlap between two labels, was calculated for soft tissue, bone, and air segments, where labels detected from deep MRAC and the ground truth (segmented CT image) were compared. A higher Dice coefficient is indicative of better labeling accuracy.
Prospective PET Evaluation
Five additional subjects were recruited to undergo additional PET/MR imaging with a 3.0-T PET/MR imaging unit (Signa, GE Healthcare) after their clinical oncologic PET/CT or PET/MR imaging examination under an institutional review board–approved protocol. Subjects had a median age of 58 years (range, 57–69 years). There were four men and one woman. None of the subjects had tumors in the brain. Imaging consisted of an additional 5- or 10-minute fluorodeoxyglucose PET scan of the head and simultaneous contrast-ehanced T1-weighted, inversion-prepared, spoiled gradient-recalled imaging (with parameters matching those given earlier, except with an inversion time of 400 msec). Gadobenate dimeglumine was administered at 0.1 mmol/kg. To evaluate reconstructed PET image quality, an offline PET reconstruction (PET Toolbox, GE Healthcare) was performed by using the system default MRACs (Dixon-based soft-tissue and air segmentation and anatomic CT-based template registration [atlas-based AC]), CT-based AC (CT image spatially registered to MR image), and the proposed deep MRAC. The CT image was coregistered to the in-phase LAVA-Flex image (two-point Dixon sequence [GE Healthcare]) used for Dixon-based soft-tissue and air segmentation. PET reconstruction parameters were as follows: 256 × 256 matrix, 300 × 300-mm2 field of view, time-of-flight ordered subsets expectation maximum reconstruction algorithm, 28 iterations, four subsets, SharpIR application, and 4-mm post filter.
Image Analysis
PET images reconstructed with Dixon-based soft-tissue and air segmentation, anatomic CT-based template registration, and deep MRAC were compared with those reconstructed by using the coregistered CT data. Pixelwise error maps were obtained by calculating the PET image intensity difference value between MRAC and CT-based AC after normalizing to PET image intensity from CT-based AC, that is, the percentage error of PET image intensity. Region-of-interest (ROI) analysis was performed by using the IBASPM parcellation software with a brain atlas to compute ROI-level errors (22). Error measurements were transformed by using the Box-Cox transform to ensure normality for statistical testing. Analysis of covariance was used to compare errors within all ROIs for Dixon-based soft-tissue and air segmentation, anatomic CT-based template registration, and deep MRAC. Subject and ROI were included as factors, and lesion size was included as a continuous covariate to account for variability in sizes between the different ROIs. Paired-sample t tests were used for pairwise comparison between deep MRAC and Dixon-based soft- tissue and air segmentation techniques and between deep MRAC and anatomic CT-based template registration techiques. Statistical analysis was performed with software (Matlab, version 2013a [MathWorks, Natick, Mass], and R [R Development Core Team, Vienna, Austria; https://www.R-project.org]), with a statistically significant difference defined as P < .05 with Bonferroni correction for minimizing type I error.
Results
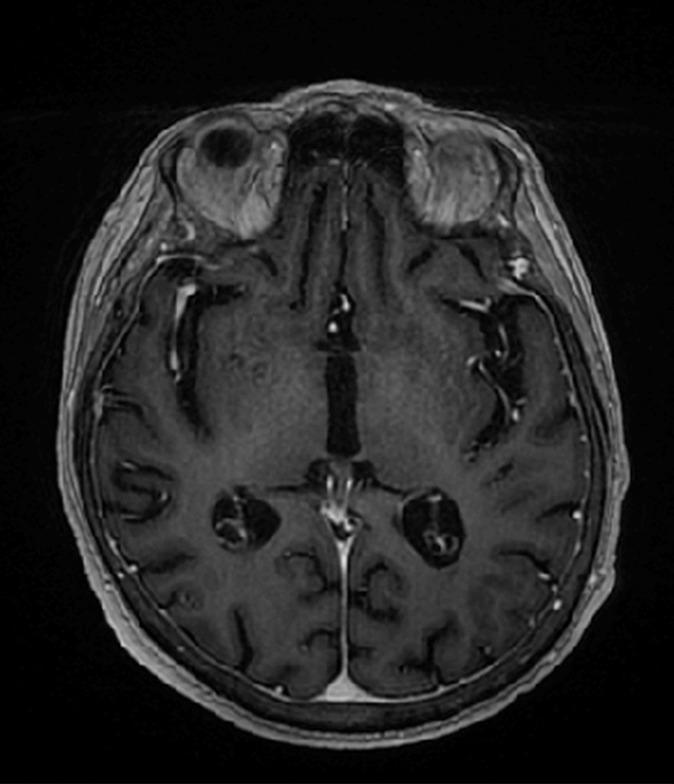
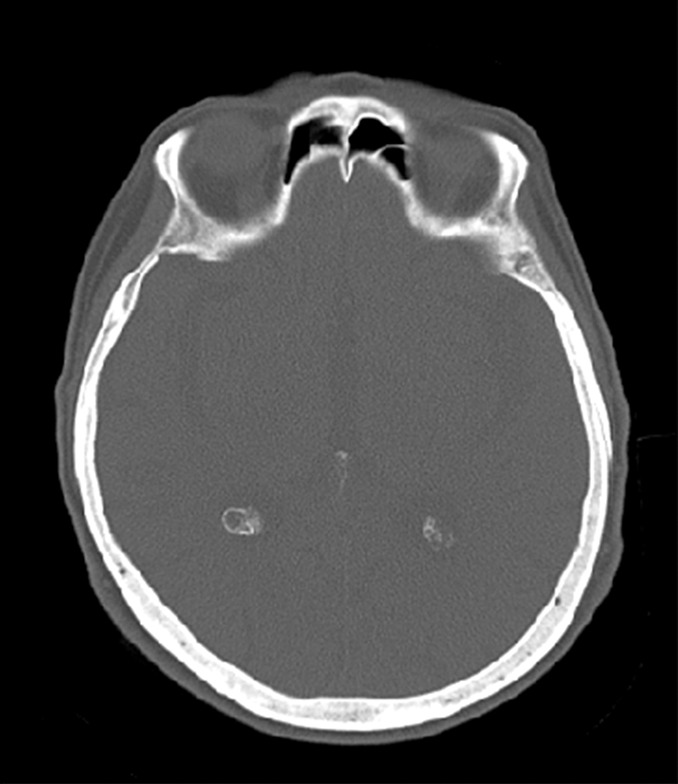
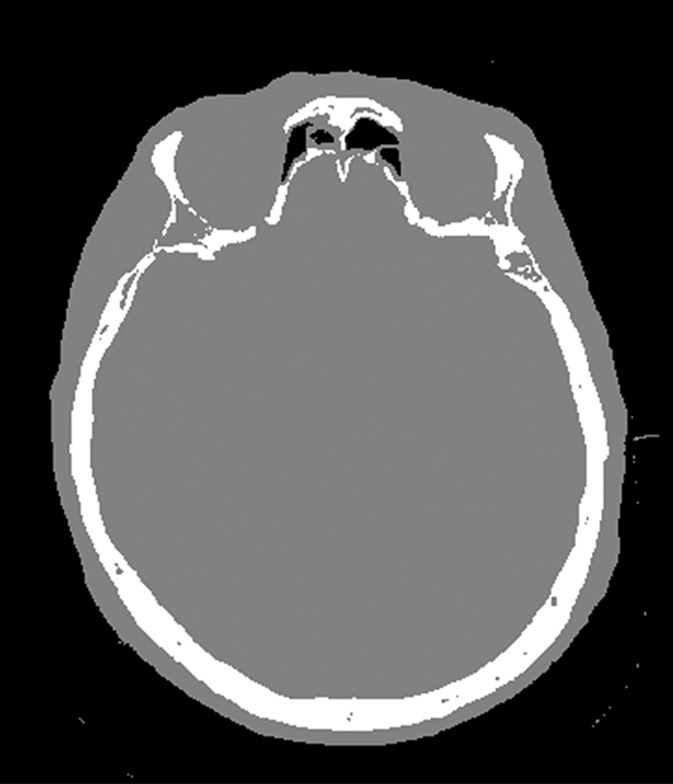
Examples of 3.0-T MR images, actual CT scans, and deep MRAC pseudo CT scans are shown in Figure 3. The training stage necessitated approximately 34 hours, whereas labeling a single input image by using the trained model required approximately 0.5 minute (which is suitable for clinical workflows). As shown, deep MRAC was able to accurately depict air, skull, and bone in the MR images.
Figure 3a:

Examples of pseudo CT images obtained with deep MRAC. Multiple sections from (a) input 3.0-T T1-weighted BRAVO MR image, (b) acquired CT scan, and (c) pseudo CT scan generated with deep MRAC.
Figure 3b:

Examples of pseudo CT images obtained with deep MRAC. Multiple sections from (a) input 3.0-T T1-weighted BRAVO MR image, (b) acquired CT scan, and (c) pseudo CT scan generated with deep MRAC.
Figure 3c:

Examples of pseudo CT images obtained with deep MRAC. Multiple sections from (a) input 3.0-T T1-weighted BRAVO MR image, (b) acquired CT scan, and (c) pseudo CT scan generated with deep MRAC.
The Dice coefficient for the evaluation subset (n = 10) comparing the output tissue label mask to the reference mask was high for air (mean ± standard deviation, 0.971 ± 0.005), soft tissue (mean, 0.936 ± 0.011), and bone (mean, 0.803 ± 0.021). Note that both the MR and CT images included in this study had limited coverage at the level of the jaw and below, which limited the ability to properly train the algorithm below this level.
Results of PET reconstruction from each respective approach are shown in Figure 4, which includes the various CT scans for reconstruction, PET image using identical reconstruction parameters, and pixelwise error map relative to the co-registered actual CT approach. As seen in Figure 4, deep MRAC performed better than the other MRAC approaches. The Table provides the average errors and standard deviations with the three approaches within different brain regions. There was a significant difference among Dixon-based soft-tissue and air segmentation, anatomic CT-based template registration, and deep MRAC for errors in brain ROIs (P < .00001). Paired t testing on the ROI level showed that deep MRAC provided significantly lower PET errors than did Dixon-based soft-tissue and air segmentation for 10 of 23 regions with Bonferroni correction (P < .001) and for 21 of 23 regions without Bonferroni correction (P < .05). Deep MRAC provided significantly lower PET errors than anatomic CT-based template registration for six of 23 regions with Bonferroni correction (P < .001) and 20 of 23 regions without Bonferroni correction (P < .05). The Table also shows P values from paired testing for each ROI.
Figure 4:

Comparison of PET reconstruction by using Dixon-based soft-tissue and air segmentation (MRAC-1), anatomic CT-based template registration (MRAC-2), deep MRAC, and acquired CT-based AC (CTAC). Relative error was calculated by using PET image reconstructed with CT-based AC.
Image Error with Three Approaches within Different Brain Regions
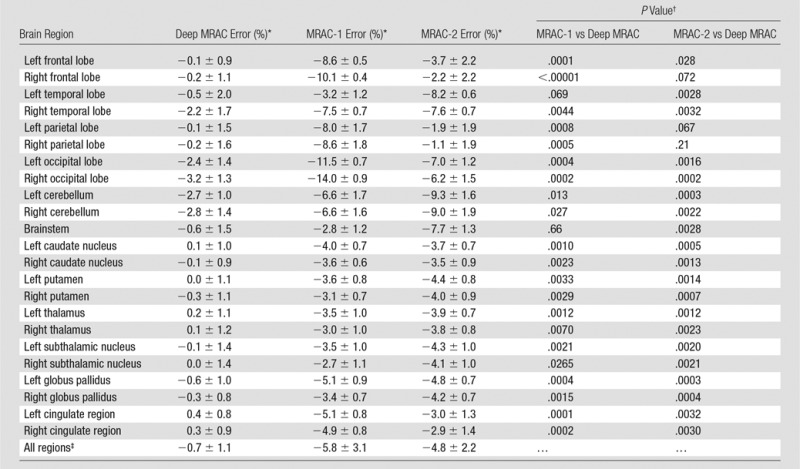
Note.—MRAC-1 = Dixon-based soft-tissue and air segmentation, MRAC-2 = anatomic CT-based template registration.
*Data are means ± standard deviations.
†P < .001 is defined as the Bonferroni-corrected significance level.
‡Overall P value was obtained with analysis of covariance F test and was <.00001.
Discussion
In this study, we demonstrated the feasibility of a deep learning–based approach for MRAC (deep MRAC), using a single MR acquisition that performs better than current clinical approaches (Dixon-based soft-tissue and air segmentation and anatomic CT-based template registration), where deep MRAC has a reconstruction error that is lower than 1% in most regions. Furthermore, we demonstrated that a deep learning model trained by using retrospective analysis of 1.5-T MR images is applicable to data acquired at 3.0 T, demonstrating the strength, flexibility, and promise of deep learning approaches. Note that we used a contrast-enhanced three-dimensional gradient-echo acquisition at 1.5 T solely because this type of acquisition provided the greatest number of subjects and best covered the whole head with sufficiently high spatial resolution that best matched the acquired CT scans for our retrospective analysis. Despite these potential limitations, deep MRAC performs very well with extremely strong capability to estimate bone, as demonstrated with reported high Dice coefficient. Note that while the results of this study are highly promising, a major opportunity for future improvement is the development of MR acquisitions that are prospectively optimized for deep MRAC pseudo CT scan generation.
One promising technique for prospective acquisition is the use of ultrashort echo time and/or zero echo time imaging (23–25). Recently, ultrashort echo time– and/or zero echo time–based MRAC has been highlighted owing to its capability to generate positive image contrast from bone. However, ultrashort echo time– and/or zero echo time–based MRAC acquisitions can have a long acquisition time (2–5 minutes, depending on imaging parameters) and typically have little diagnostic value, which impedes the workflow of simultaneous PET/MR imaging, especially for whole-body imaging, where very limited imaging time is available for MR imaging in each station. However, given the likely complementary value of ultrashort echo time and zero echo time sequences in identifying bone in relation to CT, future studies using prospective (and accelerated) ultrashort echo time and/or zero echo time MR acquisitions for deep MRAC are warranted.
This study has several limitations. First, the evaluation of the proposed techniques relied on intrasubject coregistration of CT and MR imaging datasets. Given the different head positioning during the respective acquisitions and inherently different orientations of the neck and jaw, it is possible that some residual misregistration remains even when using nonrigid registration techniques. Although this problem is likely small in the brain regions studied herein, it is possible that the coregistered CT scan does not reflect a true standard of reference for quantitative reconstruction. Second, the current technique was evaluated in patients undergoing a clinical PET examination, but without any specific neurologic abnormality. Further evaluation of deep MRAC in disease states and abnormal anatomy is necessary to determine its robustness to anatomic and functional variability. This includes evaluation in cases such as dementia (where subjects typically have normal brain anatomy but distinct PET patterns) and epilepsy (where subjects may have abnormal skull and significant structural brain defects). We also recognize that improvements in the evaluation of PET reconstruction error could be made to more accurately assess errors near air, bone, and soft-tissue interfaces. In the ROI approach used herein, reconstruction error is averaged within the entire volume of the ROI, whereas the actual error may be larger near the interfaces. Additional assessment of smaller cortical-only regions or spatial normalization of all datasets into a single atlas space to facilitate pixel-wise error estimates may further highlight the performance of the respective MRAC approaches in various regions of the brain, where critical mislabeling of air and bone results in increased quantitative error.
In addition to the very fast computational time (0.5 minute) needed to generate a pseudo CT scan from the trained model, a major advantage of the proposed deep MRAC approach is that spatial normalization to a template space is not required. Atlas-based MRAC approaches estimate bone and air structure in images by spatially registering to templates that are representative of the specific anatomy being studied. These require an assumption of mostly normal anatomy in every subject, which is often not true in clinical practice. Thus, in subjects with anatomic abnormality, these methods can be challenged. For a deep learning approach, the only limitation is the diversity of data used to train the model. For the model to account for abnormal anatomy, training datasets representative of these patterns of abnormality (but not necessarily spatially specific patterns) are necessary. Therefore, given sufficient training data, a deep learning approach would be expected to perform better than approaches based on a single atlas or a few atlases. In particular, deep MRAC may be a more feasible approach to realize robust MRAC acquisitions outside of the head, such as in the chest, where substantial population variability in anatomy would greatly complicate atlas-based approaches.
In conclusion, we have demonstrated that deep learning–based approaches applied to MRAC have the potential to produce robust and reliable quantitative PET/MR images. The flexibility of deep MRAC is limited primarily by the available training and input MR data, suggesting that such approaches will have a substantial effect on future work in quantitative PET/MR imaging in the brain and potentially throughout the body.
Advances in Knowledge
■ A PET/MR imaging attenuation correction (AC) pipeline is proposed that uses a deep learning approach to generate pseudo CT scans from MR images, yielding accurate and robust bone, air, and soft-tissue classification in PET/MR brain imaging.
■ A deep learning–based approach for MR imaging–based AC (MRAC) that uses a single MR acquisition performs better than current clinical approaches, where deep MRAC has a reconstruction error of −0.7% ± 1.1, compared with −5.8% ± 3.1 and −4.8% ± 2.2 for soft-tissue only and atlas-based approaches, respectively.
Implication for Patient Care
■ Deep learning–based approaches applied to MRAC have the potential to produce robust and reliable quantitative PET/MR images and have a substantial effect on future work in quantitative PET/MR imaging.
Received March 25, 2017; revision requested May 22; revision received June 6; accepted June 27; final version accepted July 13.
Supported by National Institute of Arthritis and Musculoskeletal and Skin Diseases (R01-AR068373).
Disclosures of Conflicts of Interest: F.L. Activities related to the present article: institution received equipment from GE Healthcare. Activities not related to the present article: disclosed no relevant relationships. Other relationships: disclosed no relevant relationships. H.J. disclosed no relevant relationships. R.K. Activities related to the present article: disclosed no relevant relationships. Activities not related to the present article: received a grant from GE Healthcare. Other relationships: disclosed no relevant relationships. T.B. disclosed no relevant relationships. A.B.M. Activities related to the present article: institution received equipment from GE Healthcare. Activities not related to the present article: disclosed no relevant relationships. Other relationships: disclosed no relevant relationships.
Abbreviations:
- AC
- attenuation correction
- CAE
- convolutional auto-encoder
- MRAC
- MR imaging–based AC
- ROI
- region of interest
References
- 1.Hofmann M, Pichler B, Schölkopf B, Beyer T. Towards quantitative PET/MRI: a review of MR-based attenuation correction techniques. Eur J Nucl Med Mol Imaging 2009;36(Suppl 1):S93–S104. [DOI] [PubMed] [Google Scholar]
- 2.Beyer T, Lassen ML, Boellaard R, et al. Investigating the state-of-the-art in whole-body MR-based attenuation correction: an intra-individual, inter-system, inventory study on three clinical PET/MR systems. MAGMA 2016;29(1):75–87. [DOI] [PubMed] [Google Scholar]
- 3.Ladefoged CN, Law I, Anazodo U, et al. A multi-centre evaluation of eleven clinically feasible brain PET/MRI attenuation correction techniques using a large cohort of patients. Neuroimage 2017;147:346–359. [DOI] [PMC free article] [PubMed] [Google Scholar]
- 4.Greenspan H, van Ginneken B, Summers RM. Guest editorial: deep learning in medical imaging—overview and future promise of an exciting new technique. IEEE Trans Med Imaging 2016;35(5):1153–1159. [Google Scholar]
- 5.Moeskops P, Viergever MA, Mendrik AM, de Vries LS, Benders MJ, Isgum I. Automatic segmentation of MR brain images with a convolutional neural network. IEEE Trans Med Imaging 2016;35(5):1252–1261. [DOI] [PubMed] [Google Scholar]
- 6.Pereira S, Pinto A, Alves V, Silva CA. Brain tumor segmentation using convolutional neural networks in MRI images. IEEE Trans Med Imaging 2016;35(5):1240–1251. [DOI] [PubMed] [Google Scholar]
- 7.Avendi MR, Kheradvar A, Jafarkhani H. A combined deep-learning and deformable-model approach to fully automatic segmentation of the left ventricle in cardiac MRI. Med Image Anal 2016;30:108–119. [DOI] [PubMed] [Google Scholar]
- 8.Liu F, Zhou Z, Jang H, Samsonov A, Zhao G, Kijowski R. Deep convolutional neural network and 3D deformable approach for tissue segmentation in musculoskeletal magnetic resonance imaging. Magn Reson Med doi: 10.1002/mrm.26841. Published online July 21, 2017. [DOI] [PMC free article] [PubMed]
- 9.Badrinarayanan V, Kendall A, Cipolla R. SegNet: a deep convolutional encoder-decoder architecture for image segmentation. IEEE Trans Pattern Anal Mach Intell doi: 10.1109/TPAMI.2016.2644615. Published online January 2, 2017. [DOI] [PubMed]
- 10.Simonyan K, Zisserman A. Very deep convolutional networks for large-scale image recognition. arXiv Prepr. 2014; 1–10. [Google Scholar]
- 11.Ioffe S, Szegedy C. Batch normalization: accelerating deep network training by reducing internal covariate shift. ArXiv e-prints 2015; 1502. [Google Scholar]
- 12.Nair V, Hinton GE. Rectified linear units improve restricted Boltzmann machines. In: Proceedings of the 27th International Conference on Machine Learning 2010; 807–814. [Google Scholar]
- 13.Jia Y, Shelhamer E, Donahue J, Karayev S, Long J, Girshick R, Guadarrama S, Darrell T. Caffe: convolutional architecture for fast feature embedding. ArXiv e-prints 2014; 1408. [Google Scholar]
- 14.Klein S, Staring M, Murphy K, Viergever MA, Pluim JPW. Elastix: a toolbox for intensity-based medical image registration. IEEE Trans Med Imaging 2010;29(1):196–205. [DOI] [PubMed] [Google Scholar]
- 15.Jarret K, Kavukcuoglu K, Ranzato M, LeCun Y. What is the best multi-stage architecture for object recognition? In: Proceedings of the 12th IEEE International Conference on Computer Vision, Kyoto, Japan, 2009:216–2153. [Google Scholar]
- 16.He K, Zhang X, Ren S, Sun J. Delving deep into rectifiers: surpassing human-level performance on Imagenet classification. ArXiv e-prints 2015; 1502. [Google Scholar]
- 17.Bottou L. Large-scale machine learning with stochastic gradient descent. In: Proceedings of the 19th International Conference on Computational Statistics. City, State: Publisher, 2010; 177–186. [Google Scholar]
- 18.Long J, Shelhamer E, Darrell T. Fully convolutional networks for semantic segmentation. ArXiv e-prints 2014; 1411. [DOI] [PubMed] [Google Scholar]
- 19.Catana C, van der Kouwe A, Benner T, et al. Toward implementing an MRI-based PET attenuation-correction method for neurologic studies on the MR-PET brain prototype. J Nucl Med 2010;51(9):1431–1438. [DOI] [PMC free article] [PubMed] [Google Scholar]
- 20.Martinez-Möller A, Souvatzoglou M, Delso G, et al. Tissue classification as a potential approach for attenuation correction in whole-body PET/MRI: evaluation with PET/CT data. J Nucl Med 2009;50(4):520–526. [DOI] [PubMed] [Google Scholar]
- 21.Kops ER, Herzog H. Alternative methods for attenuation correction for PET images in MR-PET scanners. IEEE Nuclear Science Symposium Conference Record, 2007;6:4327–4330. [Google Scholar]
- 22.Alemán-Gómez Y, Melie-García L, Valdés-Hernandez P. IBASPM: toolbox for automatic parcellation of brain structures. Presented at the 12th Annual Meeting of the Organization for Human Brain Mapping, Florence, Italy, 2006. [Google Scholar]
- 23.Roy S, Wang W-T, Carass A, Prince JL, Butman JA, Pham DL. PET attenuation correction using synthetic CT from ultrashort echo-time MR imaging. J Nucl Med 2014;55(12):2071–2077. [DOI] [PMC free article] [PubMed] [Google Scholar]
- 24.Ladefoged CN, Benoit D, Law I, et al. Region specific optimization of continuous linear attenuation coefficients based on UTE (RESOLUTE): application to PET/MR brain imaging. Phys Med Biol 2015;60(20):8047–8065. [DOI] [PubMed] [Google Scholar]
- 25.Sekine T, Ter Voert EE, Warnock G, et al. Clinical evaluation of zero-echo-time attenuation correction for brain 18F-FDG PET/MRI: comparison with atlas attenuation correction. J Nucl Med 2016;57(12):1927–1932. [DOI] [PubMed] [Google Scholar]