The results of this study provide insights into how much subjects of different ages and with different conditions move during imaging and how this affects the B0 field; moreover, they show the effect on data quality when real-time correction is applied.
Abstract
Purpose
To compare the involuntary head motion, frequency and B0 shim changes, and effects on data quality during real-time–corrected three-dimensional γ-aminobutyric acid−edited magnetic resonance (MR) spectroscopic imaging in subjects with mild cognitive impairment (MCI), patients with Parkinson disease (PD), and young and older healthy volunteers.
Materials and Methods
In this prospective study, MR spectroscopic imaging datasets were acquired at 3 T after written informed consent was obtained. Translational and rotational head movement, frequency, and B0 shim were determined with an integrated volumetric navigator. Head motion patterns and imager instability were investigated in 33 young healthy control subjects (mean age ± standard deviation, 31 years ± 5), 34 older healthy control subjects (mean age, 67 years ± 8), 34 subjects with MCI (mean age, 72 years ± 5), and 44 patients with PD (mean age, 64 years ± 8). Spectral quality was assessed by means of region-of-interest analysis. Group differences were evaluated with Bonferroni-corrected Mann-Whitney tests.
Results
Three patients with PD and four subjects with MCI were excluded because of excessive head motion (ie, > 0.8 mm translation per repetition time of 1.6 seconds throughout >10 minutes). Older control subjects, patients with PD, and subjects with MCI demonstrated 1.5, 2, and 2.5 times stronger head movement, respectively, than did young control subjects (1.79 mm ± 0.77) (P < .001). Of young control subjects, older control subjects, patients with PD, and subjects with MCI, 6%, 35%, 38%, and 51%, respectively, moved more than 3 mm during the MR spectroscopic imaging acquisition of approximately 20 minutes. The predominant movements were head nodding and “sliding out” of the imager. Frequency changes were 1.1- and 1.4-fold higher in patients with PD (P = .007) and subjects with MCI (P < .001), respectively, and B0 shim changes were 1.3-, 1.5-, and 1.9-fold higher in older control subjects (P = .005), patients with PD (P < .001), and patients with MCI (P < .001), respectively, compared with those of young control subjects (12.59 Hz ± 2.49, 3.61 Hz · cm−1 ± 1.25). Real-time correction provided high spectral quality in all four groups (signal-to-noise ratio >15, Cramér-Rao lower bounds < 20%).
Conclusion
Real-time motion and B0 monitoring provides valuable information about motion patterns and B0 field variations in subjects with different predispositions for head movement. Immediate correction improves data quality, particularly in patients who have difficulty avoiding movement.
© RSNA, 2017
Introduction
Subject motion is the most common source of artifacts in magnetic resonance (MR) imaging and typically is manifested by the presence of image blurring and ghosting. This motion and the rapid switching of imaging gradients causes additional changes in B0 stability, which are harmful to the data fidelity of phase-sensitive MR imaging methods (1). In MR spectroscopy, the effects of movement and imager instability are less obvious (2); nevertheless, they are present and affect both localization accuracy and spectral quality (ie, line broadening, lipid contamination, and spectral peak splitting). The development of methods that eliminate motion and imager instability–related artifacts is, therefore, critical for high-quality clinical MR imaging and MR spectroscopy. Among methods for motion and imager instability correction, real-time correction methods are the most technically challenging but offer the ability not only to monitor changes for retrospective correction but also to apply the necessary corrections during acquisitions immediately (3).
Motion artifacts are common in certain groups of patients, including children and older adult subjects (1,4,5). This complicates examination of these subjects, particularly with motion-sensitive MR imaging methods. Mescher-Garwood−edited MR spectroscopy is one such method that is especially susceptible to subject motion and imager instability (6). The rapid spatiospectral encoding that makes three-dimensional (3D) MR spectroscopic imaging clinically feasible introduces additional B0 field drifts (7). Mescher-Garwood editing is designed to quantify overlapping resonances of low abundance, such as the major inhibitory neurotransmitter γ-aminobutyric acid (GABA) (8,9). GABA is essential to the development and function of the healthy brain (10) and is of primary interest in several neurologic and psychiatric disorders, such as Parkinson disease (PD), Alzheimer disease, mild cognitive impairment (MCI), epilepsy, and schizophrenia (9,11,12).
To plan studies involving such patients, it is mandatory to know how much these patients move and to evaluate strategies to minimize quantification bias. Multishot, echo-planar imaging–based volumetric navigators (13) were recently proposed to track head pose (position and orientation) frequency and B0 shim changes to enable real-time correction for robust 3D GABA-edited MR spectroscopic imaging (8). In our study, we aimed to monitor and compare the involuntary head motion, frequency and B0 shim changes, and effects on data quality during real-time–corrected 3D GABA-edited MR spectroscopic imaging in patients with MCI and PD, as well as in young and older healthy volunteers.
Materials and Methods
Subjects
In this prospective study, institutional review board approval was obtained, and written informed consent was collected from all subjects. There were a total of 152 datasets available for this study, subdivided into four groups on the basis of age and condition: (a) 33 young healthy control subjects, (b) 34 older healthy control subjects, (c) 44 patients with PD, and (d) 34 subjects with MCI. Characteristics of groups, cognitive test scores (Mini-Mental State Examination, or MMSE; Montreal Cognitive Assessment, or MoCA; Addenbrooke’s Cognitive Examination–Revised, or ACE-R; and Movement Disorder Society Unified Parkinson’s Disease Rating Scale, or MDS-UPDRS) of patients with PD examined by a neurologist are detailed in Table 1.
Table 1.
Characteristic and Clinical Data of Patients with PD, Subjects with MCI, and Young and Older Healthy Control Subjects
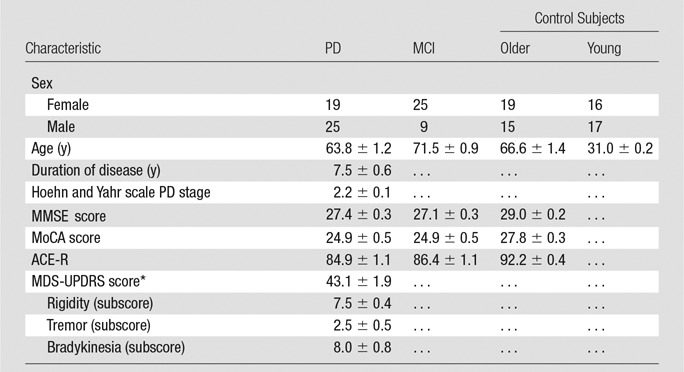
Note.—Data are means ± standard error of the mean. Clinical test scores for young healthy control subjects were not assessed.
*Determined when patients were taking medication for PD.
Volunteers were recruited in collaboration with neurologists and centers for individuals with memory impairment. The maximum admissible age for the young control group was 35 years and the minimum admissible age for the older control group was 60 years. The inclusion criterion for the MCI group was ACE-R score lower than 88. Only patients with early-stage PD (stages 1–3 on the Hoehn and Yahr scale, or those who were physically independent) were included. General exclusion criteria for all groups were severe chronic medical conditions, history of brain injury, liver and kidney dysfunction, neurologic disorders, psychiatric illnesses, or metal implants. Seven examinations (three in patients with PD, four in subjects with MCI) were excluded because of excessive movement (ie, > 0.8 mm translation per repetition time of 1.6 seconds throughout > 10 minutes) or if the subject interrupted the imaging and did not want to continue. Patients with PD were taking medication before the examination. Standard therapy for PD was used (Table E1 [online]).
MR Imaging Protocol
All brain MR imaging sequences were performed at 3 T (TIM Trio; Siemens Healthcare, Erlangen, Germany) by using a 32-channel head coil (Siemens). Subjects were instructed to keep their heads as still as possible during the measurement. Foam pillow pads were placed between the head and the coil to minimize head movement. Each measurement session began with an automated alignment localizer sequence (14) to ensure the same alignment of the volume of interest and field of view for all subjects. T1-weighted MR imaging with a 3D magnetization-prepared rapid gradient-echo sequence (0.9 × 0.9 × 0.9 mm3 spatial resolution) was performed and resectioned to guide accurate placement of the spectroscopic volume of interest (ie, positioned parallel to the bicommissural line covering the centrum semiovale and basal ganglia [Fig 1a]). Subsequently, a Localization by Adiabatic Selective Refocusing, or LASER−localized, 3D GABA-edited MR spectroscopic imaging sequence (repetition time msec/echo time msec, 1600/68; field of view, 200 × 200 × 170 mm3; volume of interest, 80 × 85 × 60 mm3; matrix, 14 × 14 × 12 interpolated to 16 × 16 × 16; nominal resolution, 3 cm3; 16 acquisition-weighted averages; spectral bandwidth, 1.25 kHz) was performed, with a standard acquisition time of 19 minutes 44 seconds (8). A volumetric echo-planar imaging–based navigator sequence was performed interleaved to guide real-time correction of motion, frequency, and B0 shim (15). Reacquisition of corrupted data was triggered if translation or rotation was greater than or equal to 0.8 mm or greater than or equal to 0.8° per repetition time, respectively (8). All motion estimates (translation, rotation), frequency, and B0 shim update logs were recorded.
Figure 1a:

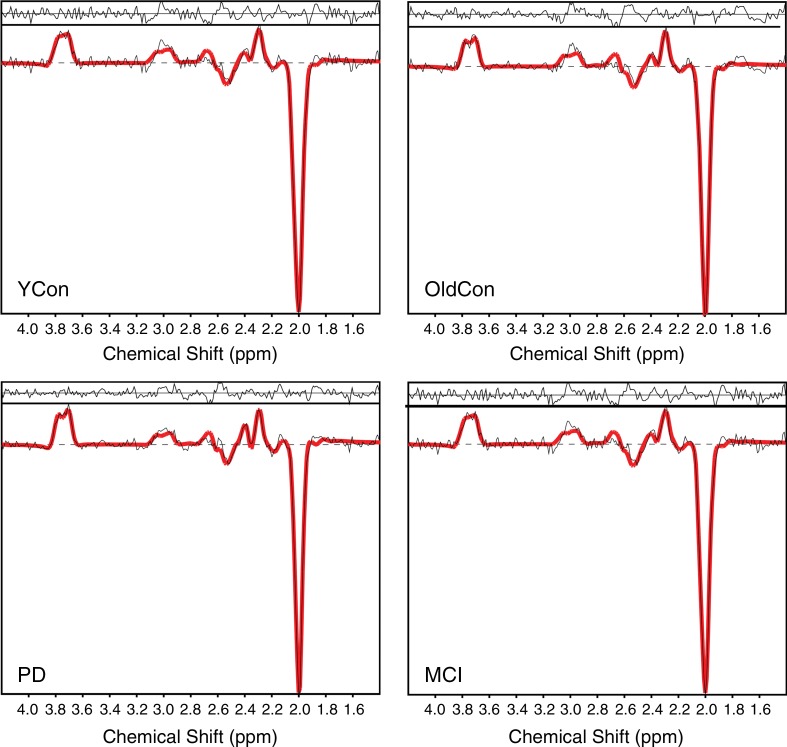
(a) Transverse (Tra), sagittal (Sag), and coronal (Cor) MR spectroscopic images show localization of the spectroscopic measurement and region of interest (blue square) for spectral quality assessment, and (b) graphs show examples of difference spectra obtained with 3D GABA-edited MR spectroscopic imaging sequence from the same location in the occipital lobe for each group. YCon = young control group, OldCon = older control group.
Data Evaluation and Statistical Analysis
Software developed in-house was used for automated data processing and display (16). The difference spectra (ie, created by means of subtraction of subspectra with and without application of the editing pulsesand containing only metabolite peaks that were affe cted by the editing pulse: GABA plus macromolecules (hereafter, GABA+), glutamate plus glutamine (hereafter, Glx), N-acetyl aspartate (NAA) were quantified with software (LCModel version 6.3-1; http://s-provencher.com/lcmodel.shtml) with a simulated basis set. For quantitative analysis of the spectral quality, a region of interest consisting of 12 voxels was drawn in the occipital lobe (Fig 1a). Mean values of the Cramér-Rao lower bounds (CRLB) of NAA (hereafter, CRLB-NAA); GABA+ (hereafter, CRLB-GABA), and Glx (hereafter, CRLB-Glx), together with linewidth measured as the full width at half maximum, or FWHM, and the signal-to-noise ratio (SNR) of NAA reported in LCModel were calculated.
The amount of head motionx, frequency changes, and B0 shim changes during MR spectroscopic imaging acquisitions was summarized in the following way: (a) the extent of motion as the difference between the minimal and maximal translation (hereafter, MAX-trans) in the X, Y, and Z directions and rotation (hereafter, MAX-rot) on the coronal, sagittal, and transverse planes; (b) a summary of regularly repeated motion (eg, caused by deep breathing) for each direction and plane as the average translation or rotation per repetition time (hereafter, REP-trans and REP-rot, respectively); (c) B0 frequency and first-order B0 shim changes on the sagittal, coronal, and transverse planes, respectively, as the difference between the minimal and maximal values (hereafter, MAX-freq and MAX-B0-shim, respectively); (d) to simplify the interpretation of changes in three linear shim gradients and three head directions and orientations, the Euclidean norms were also calculated and expressed as absolute translation, absolute rotation, and absolute B0-shim, (hereafter, ABS-trans, ABS-rot, and ABS-B0-shim, respectively). Statistical analysis was performed by using software (SPSS, version 21; IBM, Chicago, Ill). Kruskal-Wallis tests were used for intergroup comparisons, followed by Bonferroni-corrected Mann-Whitney post hoc tests.
Results
Motion Estimation
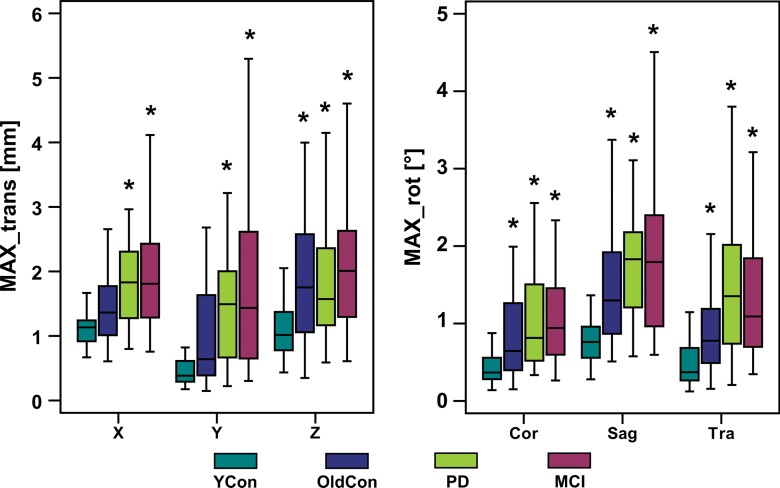
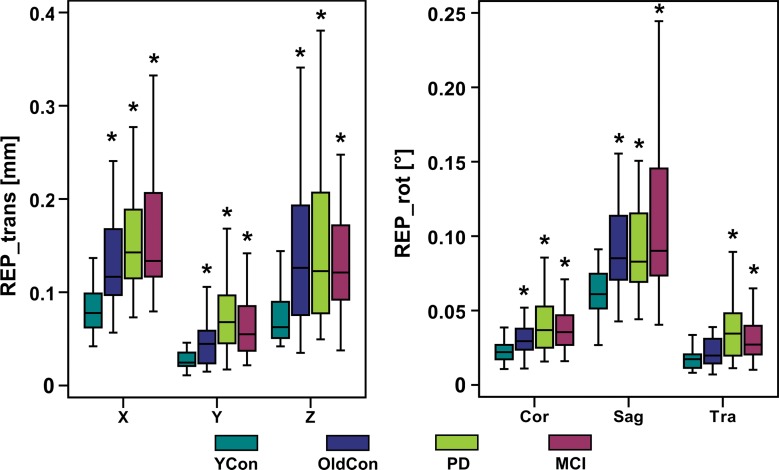
Representative records of head translation and rotation measured during MR spectroscopic imaging sequences are displayed in Figure 2. Boxplots in Figure 3a show the MAX-trans and MAX-rot, and Figure 3b shows the REP-trans and REP-rot in each direction for all 145 analyzed MR spectroscopic imaging datasets. The predominant direction of translation was along the z-axis in the older control group and PD group and the x-axis in the young control group and MCI group. The most prevalent direction of rotation was on the sagittal plane in all four groups. There was 1.5-,2.0-, and 2.5-fold larger ABS-trans and 1.8-, 2.6-, and 3.1-fold larger ABS-rot in the older control, PD, and MCI groups, respectively, than in the young control group (P < .001 for all) (Table 2, Table E2 [online]). The MAX-trans ranged from 0.95 mm to 17.9 mm, and the MAX-rot ranged from 0.35° to 16.6° between the young control group and the MCI and PD groups. During MR spectroscopic imaging measurement, 6% of young control subjects, 35% of older control subjects, 38% of patients with PD, and 51% of subjects with MCI moved their heads more than 3 mm, and 3% of young control subjects, 21% of older control subjects, 17% of patients with PD, and 35% of subjects with MCI rotated their heads more than 3°.
Figure 2a:
Graphs for (a) young and (b) older control groups, (c) patients with PD, and (d) subjects with MCI show representative records of translational and rotational movement measured with a volumetric navigator during an approximately 20-minute 3D MR spectroscopic imaging sequence. Due to selective reacquisition of corrupted data, the measurement was prolonged in the older control (approximately 7 minutes), PD (approximately 2 minutes), and MCI (approximately 4 minutes) groups. Thoracic breathing is more common in older people and causes more head movement than does diaphragmatic breathing, which is more common in young people (17). This is represented by repeated extensive motion, particularly in the X translation, Z translation, and sagittal (Sag) rotation directions. The axes correspond to the following: X = anterior-posterior, Y = left-right, and Z = superior-inferior directions. Cor = coronal, Tra = transverse.
Figure 3a:
Boxplots show the amount of motion in each of six measured directions (X, Y, and Z translation; coronal [Cor], sagittal [Sag], and transverse [Tra] rotation) for all four groups; (a) MAX-trans and MAX-rot during the MR spectroscopic measurement, and (b) REP-trans and REP-rot. * = significant difference when compared with the young control subject group (YCon) at significance level of P ≤ .008 (Bonferroni-corrected Mann-Whitney posthoc test). OldCon = older control group.
Figure 3b:
Boxplots show the amount of motion in each of six measured directions (X, Y, and Z translation; coronal [Cor], sagittal [Sag], and transverse [Tra] rotation) for all four groups; (a) MAX-trans and MAX-rot during the MR spectroscopic measurement, and (b) REP-trans and REP-rot. * = significant difference when compared with the young control subject group (YCon) at significance level of P ≤ .008 (Bonferroni-corrected Mann-Whitney posthoc test). OldCon = older control group.
Table 2.
Motion Estimation, B0 Shim Estimation, and Spectral Quality of Young and Older Control Subjects, Patients with PD, and Subjects with MCI
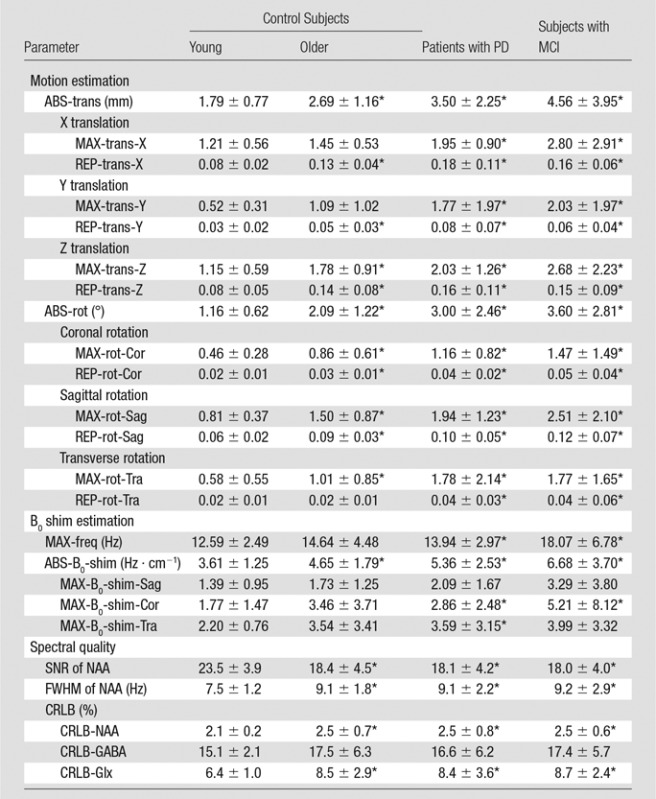
Note.—Data are means ± standard deviation.
*Indicates a significant difference compared with young control subjects, at a significance level of P ≤ .008 (Bonferroni-corrected Mann-Whitney post hoc test).
Figure 2b:
Graphs for (a) young and (b) older control groups, (c) patients with PD, and (d) subjects with MCI show representative records of translational and rotational movement measured with a volumetric navigator during an approximately 20-minute 3D MR spectroscopic imaging sequence. Due to selective reacquisition of corrupted data, the measurement was prolonged in the older control (approximately 7 minutes), PD (approximately 2 minutes), and MCI (approximately 4 minutes) groups. Thoracic breathing is more common in older people and causes more head movement than does diaphragmatic breathing, which is more common in young people (17). This is represented by repeated extensive motion, particularly in the X translation, Z translation, and sagittal (Sag) rotation directions. The axes correspond to the following: X = anterior-posterior, Y = left-right, and Z = superior-inferior directions. Cor = coronal, Tra = transverse.
Figure 2c:
Graphs for (a) young and (b) older control groups, (c) patients with PD, and (d) subjects with MCI show representative records of translational and rotational movement measured with a volumetric navigator during an approximately 20-minute 3D MR spectroscopic imaging sequence. Due to selective reacquisition of corrupted data, the measurement was prolonged in the older control (approximately 7 minutes), PD (approximately 2 minutes), and MCI (approximately 4 minutes) groups. Thoracic breathing is more common in older people and causes more head movement than does diaphragmatic breathing, which is more common in young people (17). This is represented by repeated extensive motion, particularly in the X translation, Z translation, and sagittal (Sag) rotation directions. The axes correspond to the following: X = anterior-posterior, Y = left-right, and Z = superior-inferior directions. Cor = coronal, Tra = transverse.
Figure 2d:
Graphs for (a) young and (b) older control groups, (c) patients with PD, and (d) subjects with MCI show representative records of translational and rotational movement measured with a volumetric navigator during an approximately 20-minute 3D MR spectroscopic imaging sequence. Due to selective reacquisition of corrupted data, the measurement was prolonged in the older control (approximately 7 minutes), PD (approximately 2 minutes), and MCI (approximately 4 minutes) groups. Thoracic breathing is more common in older people and causes more head movement than does diaphragmatic breathing, which is more common in young people (17). This is represented by repeated extensive motion, particularly in the X translation, Z translation, and sagittal (Sag) rotation directions. The axes correspond to the following: X = anterior-posterior, Y = left-right, and Z = superior-inferior directions. Cor = coronal, Tra = transverse.
B0 Shim Estimation
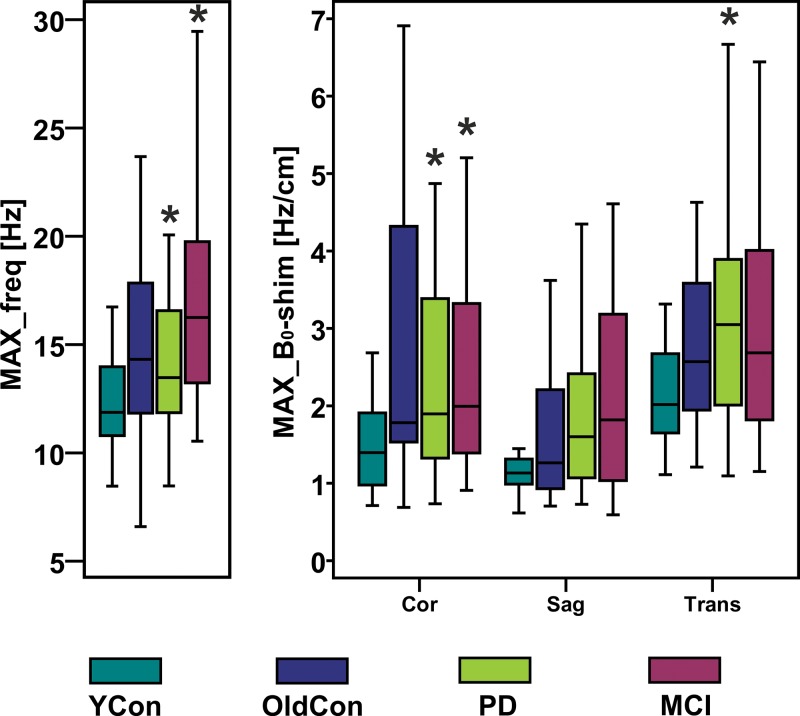
Figure 4 shows representative records of MAX-freq and MAX-B0-shim applied during acquisitions, and they are plotted in Figure 5. The frequency offsets increased 1.1-fold in the PD group and 1.4-fold in the MCI group compared with that in the young control group (P = .007, P < .001), ranging from 8.5 Hz in the young control group to 36.1 Hz in the MCI group. ABS-B0-shim were 1.3-, 1.5-, and 1.9-fold higher in the older control, PD, and MCI groups, respectively, than in the young control group (P = .005, P < .001, P < .001), ranging from 2.4 Hz · cm−1 in the young control group to 35.7 Hz · cm−1 in the MCI group (Table 2, Table E2 [online]).
Figure 4a:
Graphs show representative records of MAX-freq and MAX-B0-shim for (a) young control subject, (b) older control subject, (c) PD, and (d) MCI groups associated with motion records from Figure 2. Frequency changes show combined effect of head motion and frequency drifts partially introduced by spiral encoding of the 3D GABA-edited MR spectroscopic imaging. MAX-freq and MAX-B0-shim are higher in subjects who performed more extensive movement (ie, older control subject, PD, and MCI groups). Larger left-to-right head rotation (on transverse plane) performed by subject with PD caused less B0 field distortion in c than did rotation in other directions performed by subject with MCI in d.
Figure 5:
Boxplots show MAX-freq and MAX-B0-shim on coronal (Cor), sagittal (Sag), and transverse (Tra) planes, with higher values in groups in which subjects performed more extensive movement during acquisition. * = significant difference compared with young control subject group (YCon) at a significance level of P ≤ .008 (Bonferroni-corrected Mann-Whitney post hoc test). OldCon = older control subject group.
Figure 4b:
Graphs show representative records of MAX-freq and MAX-B0-shim for (a) young control subject, (b) older control subject, (c) PD, and (d) MCI groups associated with motion records from Figure 2. Frequency changes show combined effect of head motion and frequency drifts partially introduced by spiral encoding of the 3D GABA-edited MR spectroscopic imaging. MAX-freq and MAX-B0-shim are higher in subjects who performed more extensive movement (ie, older control subject, PD, and MCI groups). Larger left-to-right head rotation (on transverse plane) performed by subject with PD caused less B0 field distortion in c than did rotation in other directions performed by subject with MCI in d.
Figure 4c:
Graphs show representative records of MAX-freq and MAX-B0-shim for (a) young control subject, (b) older control subject, (c) PD, and (d) MCI groups associated with motion records from Figure 2. Frequency changes show combined effect of head motion and frequency drifts partially introduced by spiral encoding of the 3D GABA-edited MR spectroscopic imaging. MAX-freq and MAX-B0-shim are higher in subjects who performed more extensive movement (ie, older control subject, PD, and MCI groups). Larger left-to-right head rotation (on transverse plane) performed by subject with PD caused less B0 field distortion in c than did rotation in other directions performed by subject with MCI in d.
Figure 4d:
Graphs show representative records of MAX-freq and MAX-B0-shim for (a) young control subject, (b) older control subject, (c) PD, and (d) MCI groups associated with motion records from Figure 2. Frequency changes show combined effect of head motion and frequency drifts partially introduced by spiral encoding of the 3D GABA-edited MR spectroscopic imaging. MAX-freq and MAX-B0-shim are higher in subjects who performed more extensive movement (ie, older control subject, PD, and MCI groups). Larger left-to-right head rotation (on transverse plane) performed by subject with PD caused less B0 field distortion in c than did rotation in other directions performed by subject with MCI in d.
Spectral Quality
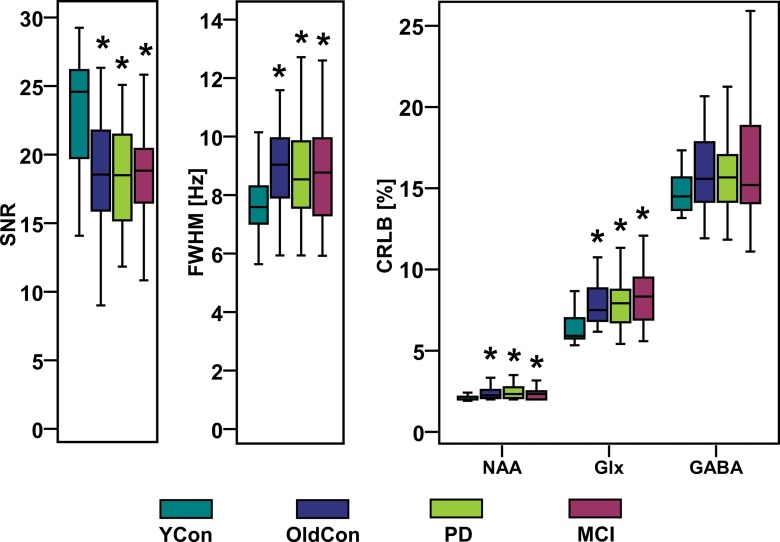
Representative spectra for each group are shown in Figure 1b. Boxplots in Figure 6 summarize the spectral quality parameters. We observed a 1.3-fold higher mean SNR of NAA in the young control group compared with that in the older control, PD, and MCI groups (P < .001 for all), and a 1.2-fold higher mean FWHM of NAA in the older control (P < .001), PD (P = .001), and MCI (P = .008) groups than in the young control group (Table 2, Table E2 [online]). CRLB-NAA, CRLB-GABA, and CRLB-Glx were less than 20% in the majority of the 145 eligible examinations. In only 14 examinations (five from the older control group, two from the PD group, and seven from the MCI group) was CRLB-GABA between 20% and 30% and in only three examinations (one from the older control group, one from the PD group, and one from the MCI group) was CRLB-GABA between 30% and 50%. CRLB-NAA was 1.2-fold lower in the young control group than it was in the older control group (P = .002), PD group (P < .001), and MCI group (P = .001). CRLB-Glx was 1.3-fold lower in the younger control group than it was in all three other groups (P < .001) (Table E2 [online]).
Figure 1b:
(a) Transverse (Tra), sagittal (Sag), and coronal (Cor) MR spectroscopic images show localization of the spectroscopic measurement and region of interest (blue square) for spectral quality assessment, and (b) graphs show examples of difference spectra obtained with 3D GABA-edited MR spectroscopic imaging sequence from the same location in the occipital lobe for each group. YCon = young control group, OldCon = older control group.
Figure 6:
Boxplots with SNR, linewidth (FWHM) of NAA, and CRLB-NAA, CRLB-Glx, and CRLB-GABA calculated with LCModel show high spectral quality of all groups. * = significant difference when compared with young control group (YCon) at a significance level of P ≤ .008 (Bonferroni-corrected Mann-Whitney posthoc test). OldCon = older control group.
Discussion
In our work, we monitored and compared the intra-acquisition head movement, frequency changes, and B0 shim changes in patients with PD, subjects with MCI, and young and older control subjects during an approximately 20-minute 3D GABA-editing MR spectroscopic imaging sequence with real-time artifact correction. The effects on data quality were also assessed. Spectral editing is particularly sensitive to motion-induced artifacts and imager instability, which cause overestimation and variability of edited metabolites (7,9,18). Similarly to that in conventional MR spectroscopy and MR imaging, motion also constitutes a substantial source of measurement bias (1). Knowledge of its extent is important in any MR-based examination, especially in older patients with a high predisposition for motion artifacts. Our results provide insights into how much subjects of different ages and with different conditions move and how this affects the B0 field; moreover, they show the effect on data quality when real-time correction is applied.
We observed 1.5–2.5 times stronger overall head translation and 1.8–3.1 times larger rotation in the older control, PD, and MCI groups than in the young control group, with the predominant directions corresponding to head nodding (X translation, sagittal rotation) and “sliding” out of the magnet (Z translation). Such movement is harder to restrict than, for example, head shaking, which can be minimized by using dedicated foam pads. Similar results were observed in pediatric patients, where the intra-acquisition motion was evaluated during diffusion-tensor imaging sequences of approximately 6 minutes (5) and single-voxel MR spectroscopic sequences of approximately 2 minutes (4). In both cases, the predominant movement directions were Z translation and Y (sagittal) rotation. The monitoring and real-time correction of intra-acquisition head motion of older subjects (ie, older control, PD, and MCI groups) has, to our knowledge, not been well established in the literature.
Changes in position and imager instability result in spatially dependent B0 variations (13). This result is in agreement with our findings. The observed frequency and linear B0 shim changes were larger in patients with PD and subjects with MCI, who were also the most restless subjects compared with young control subjects. The frequency changes observed in subjects without substantial movement (ie, < 2 mm, 26 Hz per hour) were comparable to the imager–related frequency drifts observed previously for spiral-accelerated 3D LASER MR spectroscopic imaging (15–24 Hz per hour) (15), but lower than those recorded for 3D echo-planar spectroscopic imaging (40–50 Hz per hour) (19) on the same type of MR imager. According to Hess et al (13), up-down head movement gives rise to substantially higher B0 field distortions (ie, frequency and first-order B0 shims) than does head shaking. Changes in first-order B0 shims were most prominent in the Z (transverse) direction for all subjects. In our study, the most significant differences between the young control subjects and patients with PD or MCI were in Y (coronal) B0 shims. Zaitsev et al (20) found the largest B0 shim changes in the Y direction for head up-down movement of greater than 3°. Changes in the B0 field due to incidental head movement, to our knowledge, have not been reported in patients so far. Therefore, our results are important to judge the clinical effect of corrections for B0-sensitive MR imaging techniques (eg, echo-planar imaging used in functional MR imaging or diffusion-weighted imaging).
The positive effect of real-time position and B0 correction on spectral quality was demonstrated previously in volunteers with deliberate head movement for single-voxel spectroscopy (20,21), two-dimensional MR spectroscopic imaging (13,22), and 3D MR spectroscopic imaging (8). We assessed the spectral quality according to three parameters: linewidth, SNR, and CRLBs. Although position and B0 shim updates with selective reacquisition of corrupted data pairs provided high data quality (SNR > 15, CRLBs < 20%) in all four groups, the SNR ratio, linewidth, and the CRLB-NAA and CRLB-Glx were still better in the young control subjects than in the older control subjects, patients with PD, and subjects with MCI. CRLBs were comparable with previously published values when GABA-edited, Mescher-Garwood LASER 3D MR spectroscopic imaging was performed in young healthy volunteers (23) and lower spectral quality was observed previously in older subjects (24). This may be partially a result of incomplete real-time motion correction. However, increased iron content in older people, in particular in patients with PD and Alzheimer disease, is known to decrease T2* (25,26). This degrades spectral quality, even with perfect motion correction.
Our study had limitations. In comparison with that of retrospective corrections, the efficiency of real-time motion and B0 shim correction cannot be easily compared, simply because the updates are applied immediately during acquisition and cannot be turned off or reversed in postprocessing. An additional uncorrected examination would have taken another 20 minutes, with no guarantee that the amount of motion in the compared measurements would be the same. Such a comparison would have been especially problematic in our patient groups. Even after real-time motion correction, the spectral quality was still worse in subjects with more head movement. Higher-order B0 shim updates could further reduce subtraction artifacts, and threshold parameters for triggering reacquisition could be defined more strictly (eg, ≥ 0.4 mm translation or ≥ 0.4° rotation per repetition time) (8). In addition, continuously repeated movement such as breathing is difficult to correct.
In conclusion, the characteristics of unprompted head motion, frequency changes, and B0 shim changes in restless subjects is of value for MR imaging techniques susceptible to motion or B0 errors. Real-time motion and B0 field correction by means of volumetric navigators proved to be a powerful tool for quality assurance in clinical MR spectroscopy, even in motion-sensitive, spectral-editing methods and challenging subject populations.
Advances in Knowledge
■ The extent of unprompted head movement during MR spectroscopic imaging by older healthy individuals, patients with Parkinson disease, and subjects with mild cognitive impairment was larger (1.5- to 2.5-fold) than that for young healthy control subjects (P < .001) and caused increased frequency offsets and B0 shim changes.
■ Head nodding (ie, sagittal rotation) was the most prevalent motion direction in 70% of subjects.
■ The signal-to-noise ratio of N-acetyl aspartate was 1.3-fold higher for young healthy control subjects compared with that forolder healthy individuals, patients with Parkinson disease, and subjects with mild cognitive impairment (P < .001).
■ The Cramér-Rao lower bounds of N-acetyl aspartate were 1.2-fold lower (P ≤ .002) and the Cramér-Rao lower bounds of glutamate plus glutamine were 1.3-fold lower (P < .001) in young healthy control subjects than in older healthy control subjects, patients with Parkinson disease, and subjects with mild cognitive impairment.
Implication for Patient Care
■ Real-time motion and B0 correction with volumetric navigators provides high data quality even in patient populations with increased head motion; this reduces the number of MR imaging examinations that must be repeated because of inconclusive results.
Received March 30, 2017; revision requested June 2; revision received June 12; accepted July 13; final version accepted July 13.
W.B. supported by the Austrian National Bank (16133), the Austrian Science Fund (KLI-61), and the Austrian Research Promotion Agency Bridge Early Stage Grant (846505). O.C.A. supported by the National Cancer Institute R01CA211080.
Disclosures of Conflicts of Interest: E.H. disclosed no relevant relationships. M.P. disclosed no relevant relationships. B.S. disclosed no relevant relationships. P.K. disclosed no relevant relationships. P.H. disclosed no relevant relationships. G.J.H. disclosed no relevant relationships. P.A.M. disclosed no relevant relationships. O.C.A. Activities related to the present article: disclosed no relevant relationships. Activities not related to the present article: nonfinancial support from Agios Pharmaceuticals and Novartis. Other relationships: Patent issued for part of imaging method. A.J.v.d.K. disclosed no relevant relationships. P.V. disclosed no relevant relationships. B.U. disclosed no relevant relationships. S.T. disclosed no relevant relationships. W.B. disclosed no relevant relationships. X.X.X. Activities related to the present article: disclosed no relevant relationships. Activities not related to the present article: disclosed no relevant relationships. Other relationships: disclosed no relevant relationships.
Abbreviations:
- CRLB
- Cramér-Rao lower bounds
- GABA
- γ-aminobutyric acid
- MCI
- mild cognitive impairment
- NAA
- N-acetyl aspartate
- PD
- Parkinson disease
- SNR
- signal-to-noise ratio
- 3D
- three-dimensional
References
- 1.Zaitsev M, Maclaren J, Herbst M. Motion artifacts in MRI: A complex problem with many partial solutions. J Magn Reson Imaging 2015;42(4):887–901. [DOI] [PMC free article] [PubMed] [Google Scholar]
- 2.Kreis R. Issues of spectral quality in clinical 1H-magnetic resonance spectroscopy and a gallery of artifacts. NMR Biomed 2004;17(6):361–381. [DOI] [PubMed] [Google Scholar]
- 3.Maclaren J, Herbst M, Speck O, Zaitsev M. Prospective motion correction in brain imaging: a review. Magn Reson Med 2013;69(3):621–636. [DOI] [PubMed] [Google Scholar]
- 4.Hess AT, van der Kouwe AJW, Mbugua KK, Laughton B, Meintjes EM. Quality of 186 child brain spectra using motion and B0 shim navigated single voxel spectroscopy. J Magn Reson Imaging 2014;40(4):958–965. [DOI] [PMC free article] [PubMed] [Google Scholar]
- 5.Alhamud A, Taylor PA, Laughton B, van der Kouwe AJ, Meintjes EM. Motion artifact reduction in pediatric diffusion tensor imaging using fast prospective correction. J Magn Reson Imaging 2015;41(5):1353–1364. [DOI] [PMC free article] [PubMed] [Google Scholar]
- 6.Mescher M, Merkle H, Kirsch J, Garwood M, Gruetter R. Simultaneous in vivo spectral editing and water suppression. NMR Biomed 1998;11(6):266–272. [DOI] [PubMed] [Google Scholar]
- 7.Harris AD, Glaubitz B, Near J, et al. Impact of frequency drift on gamma-aminobutyric acid-edited MR spectroscopy. Magn Reson Med 2014;72(4):941–948. [DOI] [PMC free article] [PubMed] [Google Scholar]
- 8.Bogner W, Gagoski B, Hess AT, et al. 3D GABA imaging with real-time motion correction, shim update and reacquisition of adiabatic spiral MRSI. Neuroimage 2014;103:290–302. [DOI] [PMC free article] [PubMed] [Google Scholar]
- 9.Puts NA, Edden RA. In vivo magnetic resonance spectroscopy of GABA: a methodological review. Prog Nucl Magn Reson Spectrosc 2012;60:29–41. [DOI] [PMC free article] [PubMed] [Google Scholar]
- 10.Gao F, Edden RA, Li M, et al. Edited magnetic resonance spectroscopy detects an age-related decline in brain GABA levels. Neuroimage 2013;78:75–82. [DOI] [PMC free article] [PubMed] [Google Scholar]
- 11.Agarwal N, Renshaw PF. Proton MR spectroscopy-detectable major neurotransmitters of the brain: biology and possible clinical applications. AJNR Am J Neuroradiol 2012;33(4):595–602. [DOI] [PMC free article] [PubMed] [Google Scholar]
- 12.Öz G, Alger JR, Barker PB, et al. Clinical proton MR spectroscopy in central nervous system disorders. Radiology 2014;270(3):658–679. [DOI] [PMC free article] [PubMed] [Google Scholar]
- 13.Hess AT, Andronesi OC, Tisdall MD, Sorensen AG, van der Kouwe AJ, Meintjes EM. Real-time motion and B0 correction for localized adiabatic selective refocusing (LASER) MRSI using echo planar imaging volumetric navigators. NMR Biomed 2012;25(2):347–358. [DOI] [PMC free article] [PubMed] [Google Scholar]
- 14.van der Kouwe AJ, Benner T, Fischl B, et al. On-line automatic slice positioning for brain MR imaging. Neuroimage 2005;27(1):222–230. [DOI] [PubMed] [Google Scholar]
- 15.Bogner W, Hess AT, Gagoski B, et al. Real-time motion- and B0-correction for LASER-localized spiral-accelerated 3D-MRSI of the brain at 3T. Neuroimage 2014;88:22–31. [DOI] [PMC free article] [PubMed] [Google Scholar]
- 16.Považan M, Strasser B, Hangel G, et al. Multimodal post-processing software for MRSI data evaluation [abstr]. In: Proceedings of the Twenty-Third Meeting of the International Society for Magnetic Resonance in Medicine. Berkeley, Calif: International Society for Magnetic Resonance in Medicine, 2015; 1973. [Google Scholar]
- 17.Lowery EM, Brubaker AL, Kuhlmann E, Kovacs EJ. The aging lung. Clin Interv Aging 2013;8:1489–1496. [DOI] [PMC free article] [PubMed] [Google Scholar]
- 18.Evans CJ, Puts NA, Robson SE, et al. Subtraction artifacts and frequency (mis-)alignment in J-difference GABA editing. J Magn Reson Imaging 2013;38(4):970–975. [DOI] [PubMed] [Google Scholar]
- 19.Ebel A, Maudsley AA. Detection and correction of frequency instabilities for volumetric 1H echo-planar spectroscopic imaging. Magn Reson Med 2005;53(2):465–469. [DOI] [PubMed] [Google Scholar]
- 20.Zaitsev M, Speck O, Hennig J, Büchert M. Single-voxel MRS with prospective motion correction and retrospective frequency correction. NMR Biomed 2010;23(3):325–332. [DOI] [PubMed] [Google Scholar]
- 21.Hess AT, Tisdall MD, Andronesi OC, Meintjes EM, van der Kouwe AJ. Real-time motion and B0 corrected single voxel spectroscopy using volumetric navigators. Magn Reson Med 2011;66(2):314–323. [DOI] [PMC free article] [PubMed] [Google Scholar]
- 22.Lange T, Maclaren J, Buechert M, Zaitsev M. Spectroscopic imaging with prospective motion correction and retrospective phase correction. Magn Reson Med 2012;67(6):1506–1514. [DOI] [PMC free article] [PubMed] [Google Scholar]
- 23.Hnilicová P, Považan M, Strasser B, et al. Spatial variability and reproducibility of GABA-edited MEGA-LASER 3D-MRSI in the brain at 3 T. NMR Biomed 2016;29(11):1656–1665. [DOI] [PMC free article] [PubMed] [Google Scholar]
- 24.Maudsley AA, Govind V, Arheart KL. Associations of age, gender and body mass with 1H MR-observed brain metabolites and tissue distributions. NMR Biomed 2012;25(4):580–593. [DOI] [PMC free article] [PubMed] [Google Scholar]
- 25.Zecca L, Youdim MB, Riederer P, Connor JR, Crichton RR. Iron, brain ageing and neurodegenerative disorders. Nat Rev Neurosci 2004;5(11):863–873. [DOI] [PubMed] [Google Scholar]
- 26.Stankiewicz J, Panter SS, Neema M, Arora A, Batt CE, Bakshi R. Iron in chronic brain disorders: imaging and neurotherapeutic implications. Neurotherapeutics 2007;4(3):371–386. [DOI] [PMC free article] [PubMed] [Google Scholar]


