This article presents a fully automated method with which to segment enlarged perivascular spaces (ePVSs) in commonly acquired clinical sequences that yields morphologic (linearity, volume, width) information on each ePVS, as well as total ePVS volume and count.
Abstract
Purpose
To describe a fully automated segmentation method that yields object-based morphologic estimates of enlarged perivascular spaces (ePVSs) in clinical-field-strength (3.0-T) magnetic resonance (MR) imaging data.
Materials and Methods
In this HIPAA-compliant study, MR imaging data were obtained with a 3.0-T MR imager in research participants without dementia (mean age, 85.3 years; range, 70.4–101.2 years) who had given written informed consent. This method is built on (a) relative normalized white matter, ventricular and cortical signal intensities within T1-weighted, fluid-attenuated inversion recovery, T2-weighted, and proton density data and (b) morphologic (width, volume, linearity) characterization of each resultant cluster. Visual rating was performed by three raters, including one neuroradiologist, after established single-section guidelines. Correlations between visual counts and automated counts, as well session-to-session correlation of counts within each participant, were assessed with the Pearson correlation coefficient r.
Results
There was a significant correlation between counts by visual raters and automated detection of ePVSs in the same section (r = 0.65, P < .001; r = 0.69, P < .001; and r = 0.54, P < .01 for raters 1, 2, and 3, respectively). With regard to visual ratings and whole-brain count consistency, average visual rating scores were highly correlated with automated detection of total burden volume (r = 0.58, P < .01) and total ePVS number (r = 0.76, P < .01). Morphology of clusters across 28 data sets was consistent with published radiographic estimates of ePVS; mean width of clusters segmented was 3.12 mm (range, 1.7–13.5 mm).
Conclusion
This MR imaging–based method for multimodal autoidentification of perivascular spaces yields individual whole-brain morphologic characterization of ePVS in clinical MR imaging data and is an important tool in the detailed assessment of these features.
© RSNA, 2017
Introduction
The term perivascular space, or Virchow–Robin space, refers to fluid-filled sheaths around the cerebral vasculature. This perivascular compartment serves as a conduit for waste elimination from the brain (1–3). Enlarged perivascular spaces (ePVSs), previously considered a normal neuroradiologic variant (4), are increasingly considered a potentially clinically relevant finding because ePVS burden appears to be associated with clinical Alzheimer disease status (5), cerebral small vessel disease (6,7), cerebral amyloid angiopathy (8), and multiple sclerosis (9). Histopathologic and magnetic resonance (MR) imaging data indicate that ePVSs are not simply a reflection of global atrophy; no association between brain weight (10) or brain parenchymal fraction (9) was identified in previously reported clinical correlates of ePVS burden.
One important methodologic consideration of identifying ePVS in MR imaging is the simultaneous interrogation of multiple sequences to differentiate ePVS from other lesions of vascular origin and to assess possible ePVS with respect to morphology, including linear shape and size (11). The ePVSs are isointense to cerebrospinal fluid (CSF) on all sequences; the most commonly used are T1 and T2 weighted (11). Although ePVSs are commonly smaller than 3–5 mm in diameter, they can be as large as 10–20 mm (11,12). The linear morphology of ePVSs is an important feature in differentiating them from lacunar infarctions (11).
In vivo identification of ePVS at clinical MR imaging is well established by using visual rating scales, which are based on relative signal intensity at T1-weighted MR imaging, T2-weighted MR imaging, or both (6), with increased sensitivity from simultaneous consultation of multiple sequences, including fluid-attenuated inversion recovery (FLAIR) (11) and proton density sequences (13). Visual rating scales, however, are limited in their sensitivity because they rely on subjective selection of the rating section, provide no information with respect to volume or morphology of ePVS, and may be unreliable across studies and laborious to implement. These limitations hinder research into the etiology and clinical relevance of ePVS. Specifically, categorical rating scales reduce the ability of investigators or clinicians to detect or track subtle longitudinal changes and are susceptible to the limitations of ceiling and floor effects (14). Implementation of an automated method to assess counts and sizes of ePVSs would reduce inconsistencies and disagreements between visual ratings and increase statistical power in the research setting (12). Previous studies at clinical field strengths have segmented only total ePVS volumes (5), were limited to single-section assessment (15), required substantial rater thresholding (15,16), or may require high-spatial-resolution imaging not typically performed in clinical data sets (17,18). Although an object-based (per ePVS) approach to segmentation has been proposed (19), we are not aware of the implementation of such a method.
We report a fully automated segmentation method (MR imaging–based multimodal autoidentification of perivascular spaces [mMAPS]) that yields object-based morphologic estimates of ePVS in clinical-field-strength (3.0-T) MR imaging data.
Materials and Methods
Neuroimaging data were acquired as part of ongoing research at the National Institute on Aging—Layton Aging and Alzheimer’s Disease Center at Oregon Health & Science University. The Oregon Health & Science University institutional review board approved the research protocol. All study participants signed informed consent documents before study enrollment and signed Health Insurance Portability and Accountability Act authorization forms. Data were collected from 14 participants at two time points (Table 1).
Table 1.
Participant Characteristics
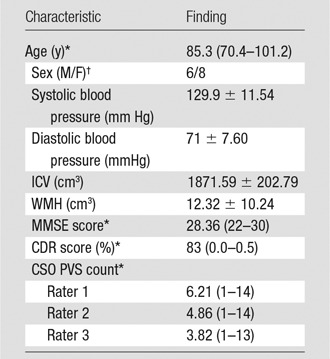
Note.—Unless otherwise indicated, data are mean ± standard deviation. CDR = Clinical Dementia Rating (23); CSO = centrum semiovale; ICV = intracranial volume; MMSE = Mini-Mental State Examination (22); PVS = perivascular space; WMH = white matter hyperintensity volume.
*Data are the mean, with the range in parentheses.
†Data are numbers of patients.
All participants were older adults (mean age, 85.3 years; range, 70.4–101.2 years) without dementia who were living independently in the community. Presence or absence of lacunar infarction was not an exclusion criterion. Visit order (visit 1 or 2) was distributed evenly between the development data set (n = 14) and the data set used to test the optimized model (n = 14). For all data sets, visual ratings were made by three independent raters: one is board certified in neuroradiology (J.P.) with 10.5 years of experience, and the other two each have at least 10 years of MR imaging experience (E.B., D.L.). Visual ratings were made by using an established visual rating scale (6). Briefly, each rater was given the published guide (6) and spatially coregistered T1-weighted, T2-weighted, and FLAIR images and was asked to select the axial section through the centrum semiovale with the highest burden. On each rater’s selected section, the raters marked the location of each identified ePVS on the entire section. Per the rating scale, categorical rating was assessed in one hemisphere. However, the algorithm was developed to detect ePVSs in the whole brain; thus, comparisons of mMAPS and visual ratings were also performed on actual counts in both hemispheres in one section.
Data Acquisition and Processing
MR imaging data were obtained by using a 3.0-T MR imager (TIM Trio System; Siemens Healthineers, Erlangen, Germany). Three sequences were performed: (a) a three-dimensional T1-weighted magnetization prepared rapid gradient-echo sequence (repetition time msec/echo time msec/inversion time msec, 2300/3.41/1200; flip angle, 12°; 128 sagittal 1-mm sections with no gap; field of view, 256 × 192 mm; and imaging matrix, 256 × 192 resulting in 1-mm isotropic voxels), (b) a two-dimensional FLAIR sequence ( 9000/87/2500; flip angle, 100°; 95 axial 2-mm sections with no gap; field of view, 228 × 248 mm; imaging matrix, 236 × 256 resulting in in-plane resolution of 0.969 × 0.969 mm; two signal averages), and (c) a two-dimensional fast spin-echo dual spin-echo (T2-weighted and proton density) sequence (3000/11/101; flip angle, 150°; 48 axial 3-mm sections with no gap; field of view, 240 × 214 mm; imaging matrix, 256 × 228 resulting in an in-plane resolution of 0.938 × 0.938).
Raw Digital Imaging and Communications in Medicine files were converted to Neuroimaging Informatics Technology Initiative format (MRIConvert; http://lcni.uoregon.edu/downloads/mriconvert/mriconvert-and-mcverter). T1-weighted images were bias-field corrected and segmented into tissue types by using Freesurfer software (version 5.1; Harvard University, Boston, Mass), which yielded masks of white matter, cortical gray matter, subcortical gray matter, and ventricular CSF. White matter masks were corrected for tissue misclassification due to white matter hyperintensities, meaning that white matter hyperintensities were included in the final white matter mask with the method described by Promjunyakul and colleagues (20). Ventricular masks were eroded by one voxel to avoid the potential of partial volume effects.
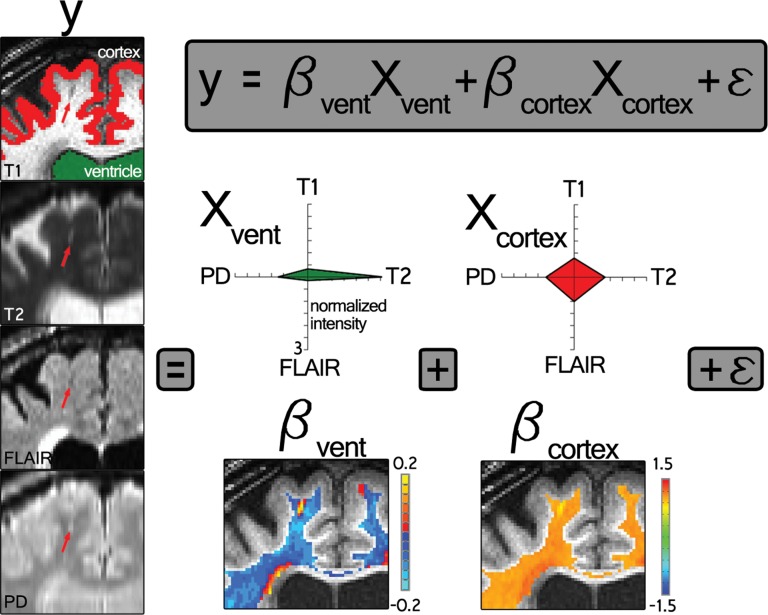
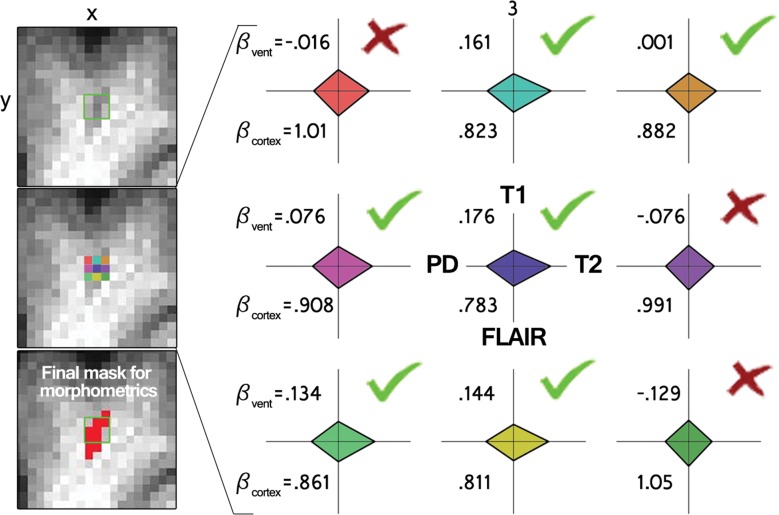
All four volumes (T1 weighted, T2 weighted, FLAIR, and proton density) were corrected for B0 inhomogeneity by using N4 bias field correction, as implemented in Slicer 3 (https://www.slicer.org) (21). For each participant’s single-time-point data set, the homogenized T2-weighted, FLAIR, and proton density volumes were registered to the T1-weighted data set by using 3dAllineate (Analysis of Functional NeuroImages, National Institute of Mental Health, Bethesda, Md) (22) with free shift and rotate parameters (six degrees of freedom). The average intensity of each sequence within the white matter mask was used to normalize each sequence with respect to one another by dividing each voxel by that one value (intensity normalization, 3dcalc; Analysis of Functional NeuroImages), and the data sets were concatenated to create one four-dimensional data set (3dTcat; Analysis of Functional NeuroImages). Four element vectors were generated that described the average intensity of each volume in the ventricular and gray matter masks (3dmaskave; Analysis of Functional NeuroImages), yielding two predictors for submission to voxelwise multiple linear regression, which was performed within the white matter mask (3dDeconvolve; Analysis of Functional NeuroImages) (Fig 2). A gray matter predictor was included as a nuisance predictor to account for variance associated with partial volume effects in and around ePVS and to sensitize the ventricular predictor; the ventricular CSF volume is largely free fluid signal, which is not well represented in ePVS, for which fluid is constrained. This effect can be appreciated by comparing the Xvent (the predictor describing the average intensity of each volume in the ventricular mask) predictor’s T2-weighted signal with the voxels in the ePVS below it in Figure 2. Clusters (defined as voxels with touching corners and a size of four or more voxels) for which the ventricular predictor regression coefficient was positive were retained (3dclust; Analysis of Functional NeuroImages) for morphology-based evaluation.
Figure 2a:
Intensity-based voxel-of-interest detection. (a) Voxelwise regression run within white matter voxels. Radar plots represent one participant’s CSF predictor (green, Xvent ) and gray matter predictor (red, Xcortex ). (b) An example of data (y, each radar plot depicts the fingerprint across all sequences for that color-coded voxel shown on the left middle) and derived regression coefficients for nine voxels centered on an identified PVS in a coronal section. Bvent and Bcortex are regression coefficients associated with Xvent and Xcortex , respectively. PD = proton density,
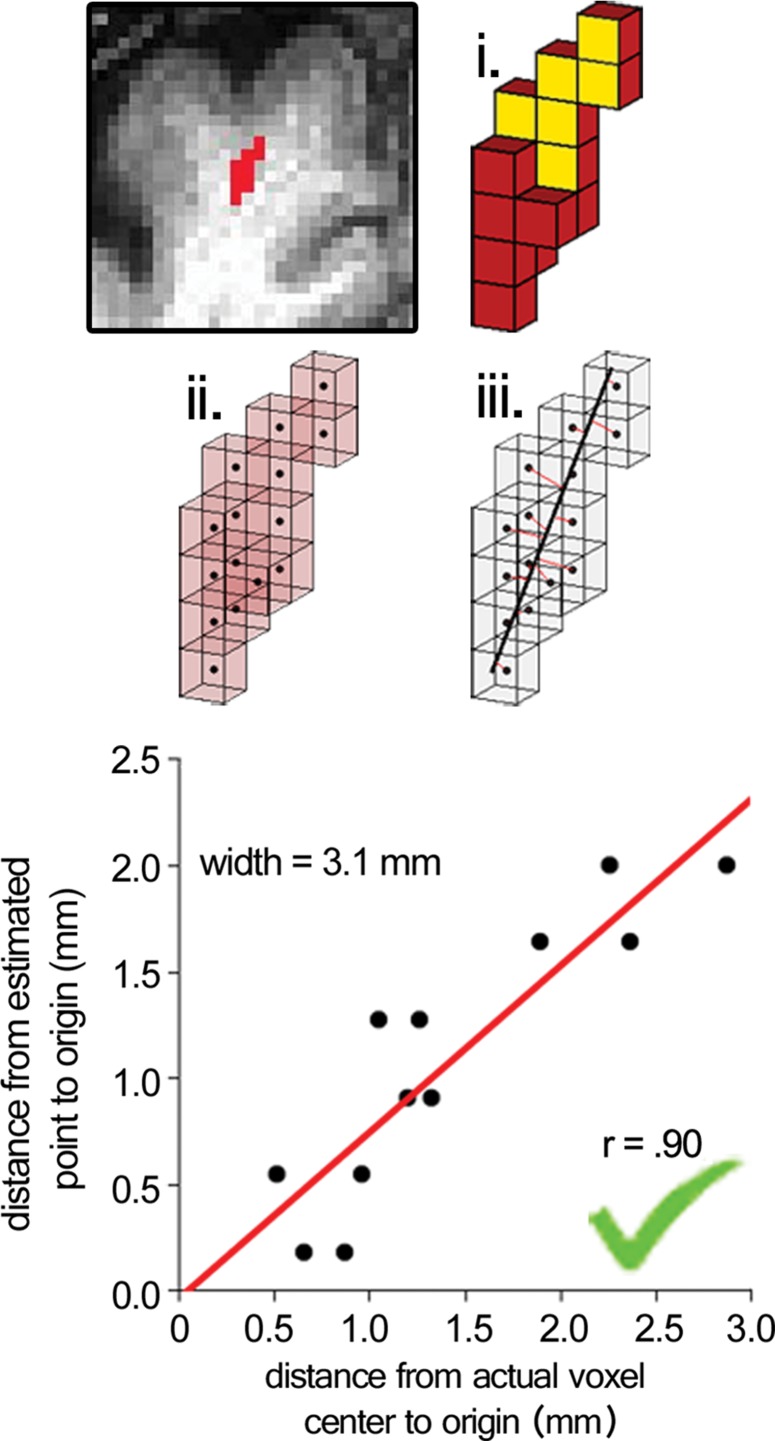
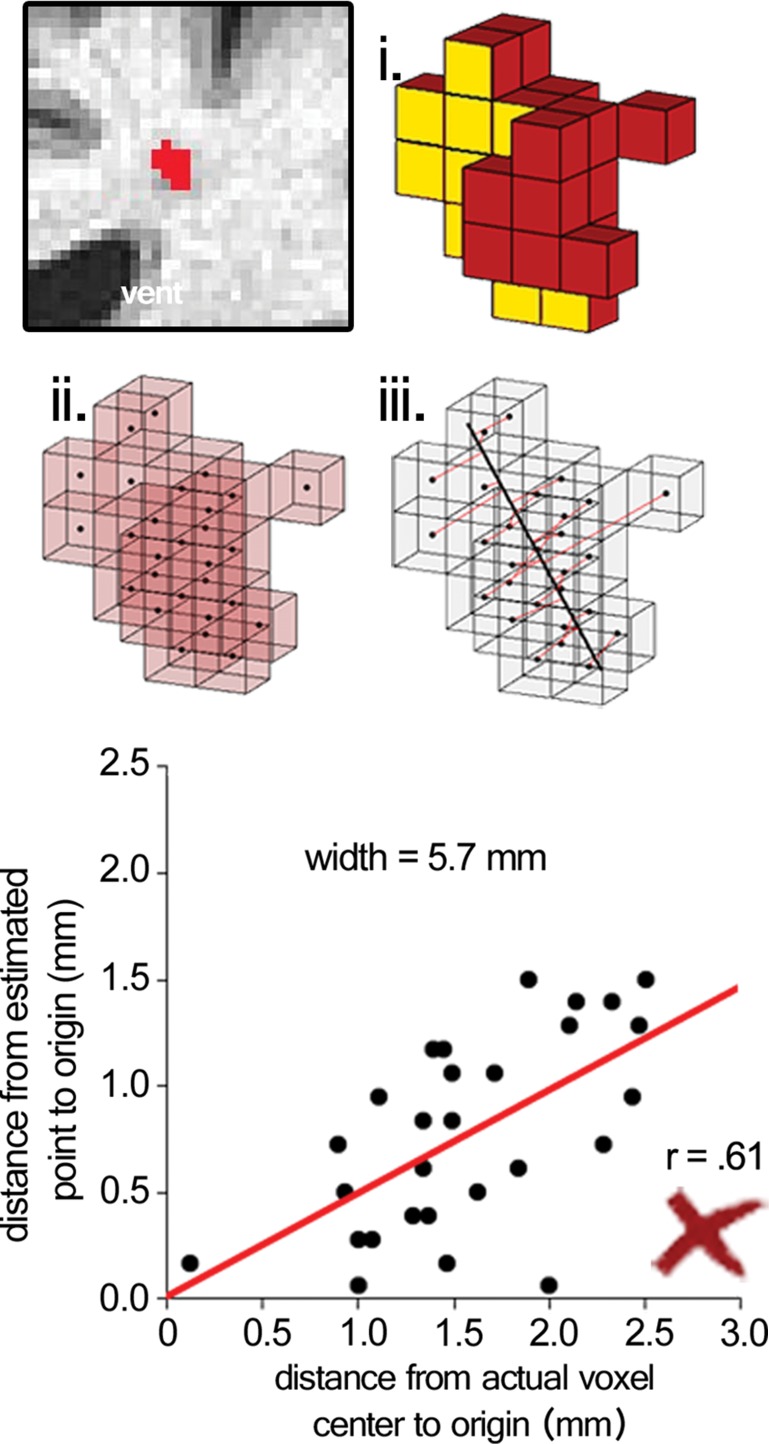
Surviving cluster coordinate sets were submitted to a morphologic constraint algorithm (Fig 3; Movies 1, 2 [online]), which was developed and executed in MATLAB 2014B (MathWorks, Natick, Mass). Briefly, each coordinate set (X) was translated to the origin by subtracting the mean of each coordinate. Singular value decomposition was used to identify the vector (V1) associated with the largest eigenvalue, which was defined as the principal axis about which the cluster could be rotated and for which the magnitude of perpendicular vectors (norms) from each coordinate to V1 (Xerr) was minimized, as in orthogonal regression. The coordinate of V1 that lay on the same orthogonal plane at each coordinate of Xerr was defined as  For each coordinate in X and in
  the minimum Euclidean distance to the origin was calculated (Xdist and
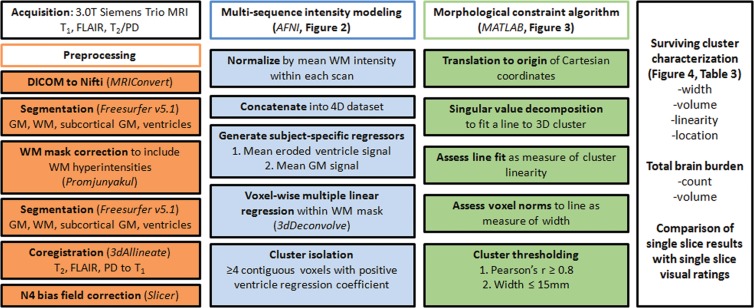
  respectively), and the magnitude of the correlation between the two distance vectors was assessed by using Pearson r. Clusters that met the threshold of r > 0.8 were considered to have met the linearity constraint. The sum of the largest norm and a norm whose vector had opposite direction in the same plane and 1.7 mm (the corner-to-corner distance of a millimeter-unit cube) was taken as the width of the cluster; any cluster with a width smaller than 15 mm was considered to have met the width constraint. This maximum width threshold was selected based on the maximum diameter reported in the existing literature (15 mm) (12). All previously identified clusters that met both linearity and width constraints were considered ePVSs, the final mask containing the surviving clusters was printed to the Neuroimaging Informatics Technology Initiative format, and summary statistics were performed with Analysis of Functional NeuroImages and SPSS (IBM, Armonk, NY) software. Figure 1 shows a flowchart of the technique used for processing.
Figure 3a:
Morphologic testing. (a) A preserved cluster after morphologic constraint. Yellow voxels (i) are marked in red in the section on the top left. The voxels are marked as points by their centers (ii), and norms are fit from each voxel to the line derived from singular value decomposition (red lines, iii ). The correlation of distances to the center of each cluster from the voxel locations and the point on the line from each voxel’s respective norm is the measure of linearity of a given cluster. The summed distance of the two farthest points from the line and 1.7 (the corner-to-corner distance of a 1-mm unit cube) are the width of the cluster. (b) A cluster that was not preserved on the basis of low linearity (r < 0.8), although the width of the cluster met the width constraint (<15 mm). See also Movies 1 and 2.
Figure 1:
Work flow diagram. AFNI = Analysis of Functional NeuroImages, DICOM = Digital Imaging and Communications in Medicine, GM = gray matter, PD = proton density, 3D = three-dimensional, 4D = four-dimensional, WM = white matter.
Figure 2b:
Intensity-based voxel-of-interest detection. (a) Voxelwise regression run within white matter voxels. Radar plots represent one participant’s CSF predictor (green, Xvent ) and gray matter predictor (red, Xcortex ). (b) An example of data (y, each radar plot depicts the fingerprint across all sequences for that color-coded voxel shown on the left middle) and derived regression coefficients for nine voxels centered on an identified PVS in a coronal section. Bvent and Bcortex are regression coefficients associated with Xvent and Xcortex , respectively. PD = proton density,
Figure 3b:
Morphologic testing. (a) A preserved cluster after morphologic constraint. Yellow voxels (i) are marked in red in the section on the top left. The voxels are marked as points by their centers (ii), and norms are fit from each voxel to the line derived from singular value decomposition (red lines, iii ). The correlation of distances to the center of each cluster from the voxel locations and the point on the line from each voxel’s respective norm is the measure of linearity of a given cluster. The summed distance of the two farthest points from the line and 1.7 (the corner-to-corner distance of a 1-mm unit cube) are the width of the cluster. (b) A cluster that was not preserved on the basis of low linearity (r < 0.8), although the width of the cluster met the width constraint (<15 mm). See also Movies 1 and 2.
Movie 1.
Three-dimensional rendering of morphology fitting component of the multimodal autoidentification of perivascular spaces (mMAPS) algorithm (see also Fig 3).
Movie 2.
Three-dimensional rendering of morphology fitting component of the mMAPS algorithm (see also Fig 3).
The total time to process and generate ePVS volume masks was approximately 1 hour for one participant; this included approximately 1–2 minutes of human interaction (for quality assurance of the tissue segmentations and coregistrations). The pipeline was fully scripted and highly reproducible, given the presence of necessary publicly available software, as listed. Visual raters (J.P., E.B., D.L.) reported approximate per-participant single-section rating times of 3–6, 5, and 6 minutes, respectively, which corresponded to a minimum time for a whole-brain expert (J.P.) rating of approximately 5 hours (there were approximately 100 axial sections in the white matter of the brain that each took 3 minutes).
White matter and ePVS signal-to-noise ratios before and after intensity normalization in each sequence were calculated by dividing mean intensity in the subset of white matter voxels that were not identified as ePVS or in the mMAPS ePVS mask by the standard deviation of an extracranial noise region of interest. Similarly, ePVS contrast-to-noise ratio (CNR) was calculated by dividing the absolute value of the difference of the subset of white matter voxels that were not identified as ePVS and those that were identified as ePVS by the standard deviation of noise.
Comparisons of the visually identified ePVS on one section were performed by counting the number of ePVSs identified by using the algorithm in the same section that was identified by each rater. In some cases, raters chose a different axial section as the section with the highest burden to rate; therefore, visually identified burden was calculated as the mean count of ePVSs over all three raters in each data set (Fig 4c).
Figure 4c:
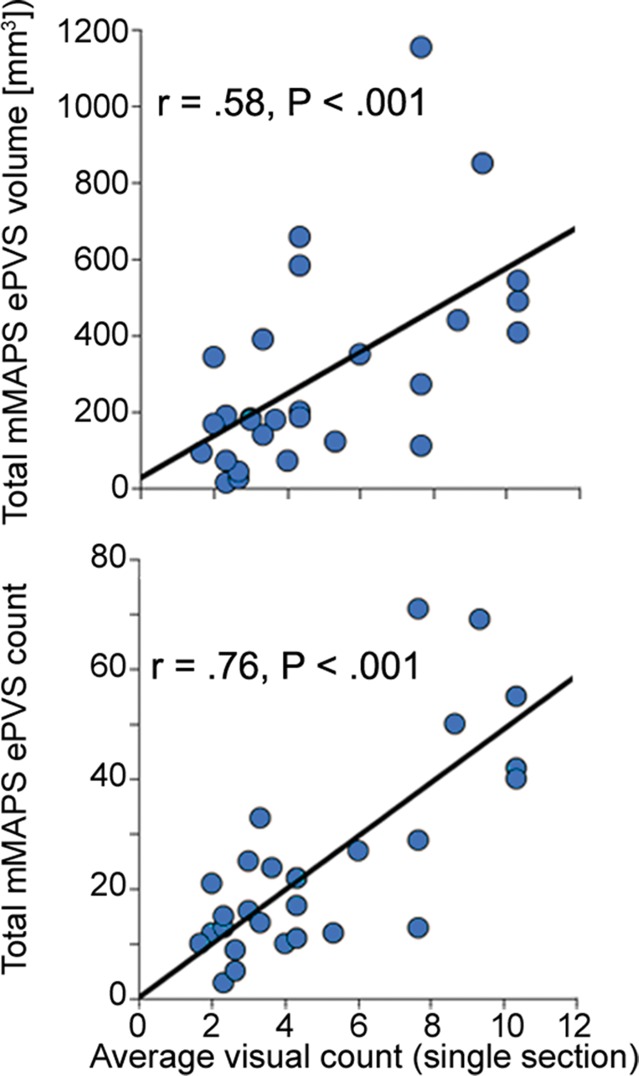
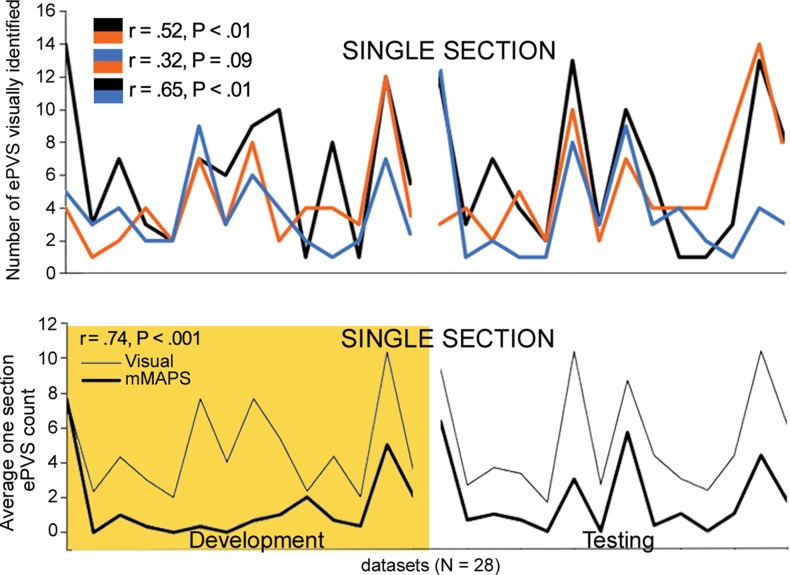
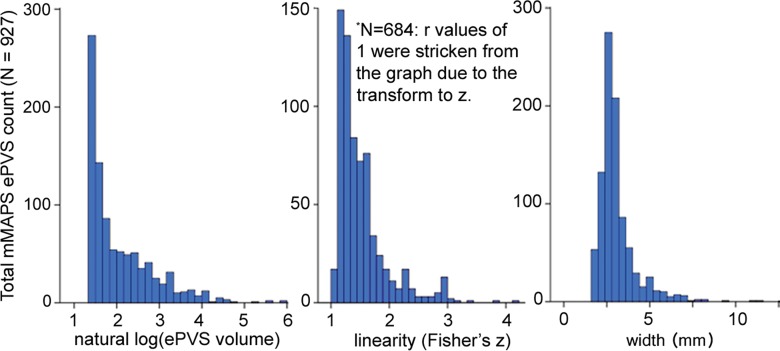
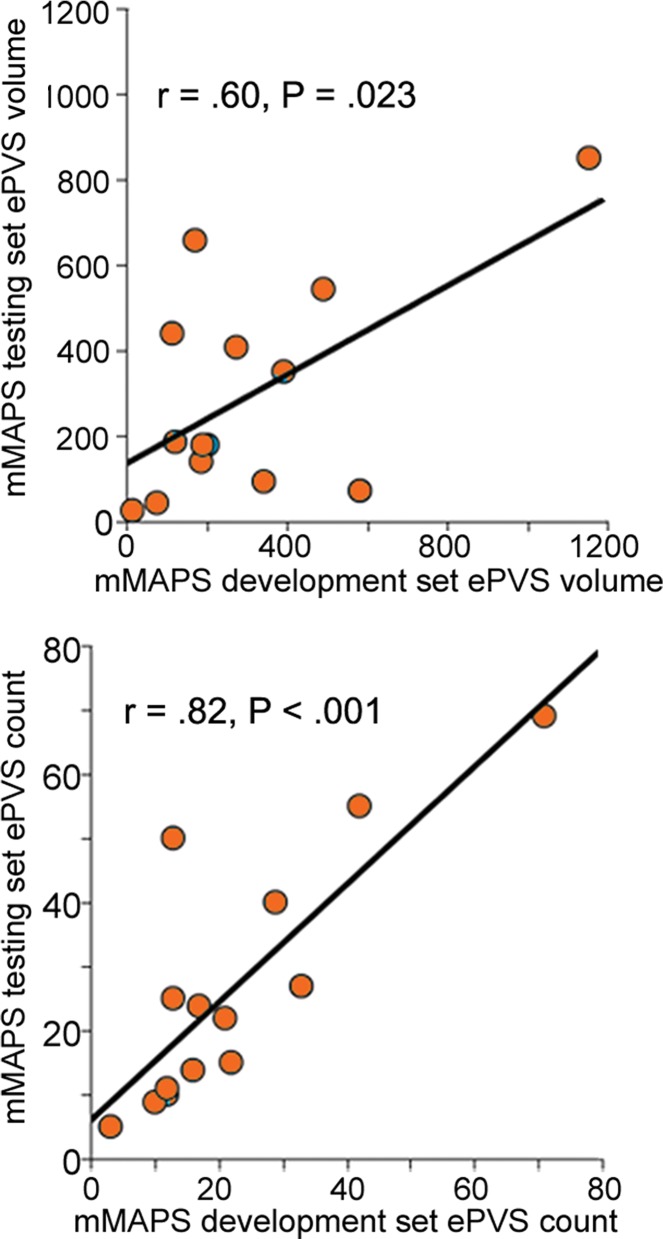
Signal-to-noise ratio (SNR) and CNR measurements, visual count ratings, and mMAPS results. (a) Native and normalized signal-to-noise ratio and CNR measurements for ePVS versus normal-appearing white matter. PD = proton density, WM = white matter. (b) Visual ratings correlated well with one another (top), as well as with the results of mMAPS (bottom) in single-section measurements. Blue line is that of the expert rater (c) Single-section visual counts are correlated with total PVS volume, as measured with mMAPS (top) and total mMAPS ePVS count (bottom). (d) Distributions of volume (left), linearity (middle), and width (right) over all mMAPS-identified ePVSs. (e) mMAPS measured were correlated between repeated measures of the same participants for total volume (top) and count (bottom). (f) Spatial likelihood of the occurrence of an identified ePVS in all participants overlaid on a representative T1-weighted volume.
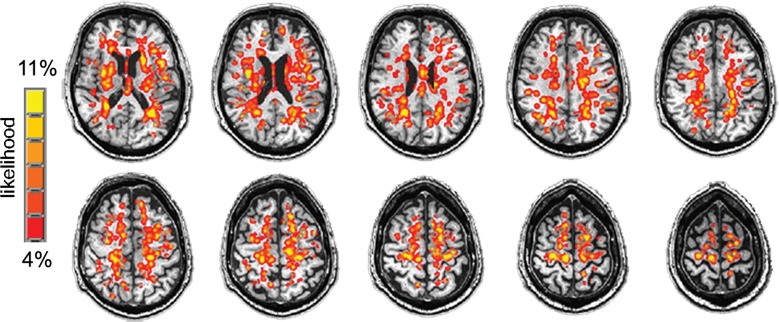
An ePVS spatial probability map was calculated for visualization of the spatial distribution of mMAPS-identified ePVSs in all data sets. Briefly, all final ePVS masks were summed over all participants (3dTcat, 3dTstat; Analysis of Functional NeuroImages), blurred with a 3-mm full width at half maximum three-dimensional Gaussian kernel (3dmerge; Analysis of Functional NeuroImages), overlaid on a representative T1-weighted image, and masked by the eroded ventricle mask and cortical mask (Fig 4f). The highest frequency of identified ePVS in one voxel was three of 28 data sets (11%).
Figure 4f:
Signal-to-noise ratio (SNR) and CNR measurements, visual count ratings, and mMAPS results. (a) Native and normalized signal-to-noise ratio and CNR measurements for ePVS versus normal-appearing white matter. PD = proton density, WM = white matter. (b) Visual ratings correlated well with one another (top), as well as with the results of mMAPS (bottom) in single-section measurements. Blue line is that of the expert rater (c) Single-section visual counts are correlated with total PVS volume, as measured with mMAPS (top) and total mMAPS ePVS count (bottom). (d) Distributions of volume (left), linearity (middle), and width (right) over all mMAPS-identified ePVSs. (e) mMAPS measured were correlated between repeated measures of the same participants for total volume (top) and count (bottom). (f) Spatial likelihood of the occurrence of an identified ePVS in all participants overlaid on a representative T1-weighted volume.
Results
The subset of white matter not identified as ePVS and the ePVS signal-to-noise ratio and CNR for each sequence before and after intensity normalization are shown in Figure 4a, with error bars representing standard error of the mean. Intensity normalization decreased T1 ePVS CNR (paired t = 3.00, P < .01), increased T2 ePVS CNR (paired t = −4.28, P < .001), increased FLAIR ePVS CNR (paired t = −4.31, P < .001), decreased proton density ePVS CNR (paired t = 2.27, P < .04), and reduced CNR standard error of the mean for T1-weighted and proton density data sets.
Figure 4a:
Signal-to-noise ratio (SNR) and CNR measurements, visual count ratings, and mMAPS results. (a) Native and normalized signal-to-noise ratio and CNR measurements for ePVS versus normal-appearing white matter. PD = proton density, WM = white matter. (b) Visual ratings correlated well with one another (top), as well as with the results of mMAPS (bottom) in single-section measurements. Blue line is that of the expert rater (c) Single-section visual counts are correlated with total PVS volume, as measured with mMAPS (top) and total mMAPS ePVS count (bottom). (d) Distributions of volume (left), linearity (middle), and width (right) over all mMAPS-identified ePVSs. (e) mMAPS measured were correlated between repeated measures of the same participants for total volume (top) and count (bottom). (f) Spatial likelihood of the occurrence of an identified ePVS in all participants overlaid on a representative T1-weighted volume.
All of the development data sets had a low ePVS burden; the one hemisphere with the highest count was between 1 and 10, corresponding to a categorical burden rating of 1 or “low” (6). With respect to this categorical score, there was perfect interrater reliability (Cohen k = 1), as well as mMAPS detection of likely ePVS in each of the sections rated. Because of this unexpectedly low variance and to more precisely assess the ability of the algorithm to enable detection of likely ePVS, reliability estimates were assessed on the basis of counts. We report these values and the counts from each rater and mMAPS detection of likely ePVS in Figure 4b and 4c. The correlation of visual counts between raters was high, even though they were not from the same section (r = 0.52, P < .05; r = 0.32, P < .1; r = 0.65, P < .05 for raters 1, 2, and 3, respectively) (Fig 4b). There was very high correlation between counts by visual raters and mMAPS detection of ePVS in the same section (r = 0.65, P < .001; r = 0.69, P < .001; r = 0.54, P < .01 for raters 1, 2, and 3, respectively). A representative image of concordance between an expert rater (J.P.) and mMAPS segmented clusters in the same section can be found in Figure E1 (online). The average visual counts and average mMAPS counts were more highly correlated (r = 0.74, P < .001), as shown in Figure 4b. With regard to visual ratings and whole-brain count consistency, average visual rating scores were highly correlated with automated detection of total burden volume (r = 0.58, P < .01) and total ePVS number (r = 0.76, P < .01) (Fig 4c).
Figure 4b:
Signal-to-noise ratio (SNR) and CNR measurements, visual count ratings, and mMAPS results. (a) Native and normalized signal-to-noise ratio and CNR measurements for ePVS versus normal-appearing white matter. PD = proton density, WM = white matter. (b) Visual ratings correlated well with one another (top), as well as with the results of mMAPS (bottom) in single-section measurements. Blue line is that of the expert rater (c) Single-section visual counts are correlated with total PVS volume, as measured with mMAPS (top) and total mMAPS ePVS count (bottom). (d) Distributions of volume (left), linearity (middle), and width (right) over all mMAPS-identified ePVSs. (e) mMAPS measured were correlated between repeated measures of the same participants for total volume (top) and count (bottom). (f) Spatial likelihood of the occurrence of an identified ePVS in all participants overlaid on a representative T1-weighted volume.
The morphologic features of detected ePVS across data sets are presented in Table 2 and Figure 4d. The average number of ePVSs per participant was 24.6 (range, three to 71), and the mean total burden volume was 303.0 mm3 ± 267.7 (standard deviation). Distributions of ePVS morphologic features across all identified ePVSs are depicted in Figure 4d. The minimum width was 1.7 mm (one voxel width corner to corner), the maximum width of ePVS detected across all data sets was 13.5 mm, and the mean width of detected ePVS was 3.12 mm.
Table 2.
Characteristics of PVS Identified per Data Set with mMAPS

Figure 4d:
Signal-to-noise ratio (SNR) and CNR measurements, visual count ratings, and mMAPS results. (a) Native and normalized signal-to-noise ratio and CNR measurements for ePVS versus normal-appearing white matter. PD = proton density, WM = white matter. (b) Visual ratings correlated well with one another (top), as well as with the results of mMAPS (bottom) in single-section measurements. Blue line is that of the expert rater (c) Single-section visual counts are correlated with total PVS volume, as measured with mMAPS (top) and total mMAPS ePVS count (bottom). (d) Distributions of volume (left), linearity (middle), and width (right) over all mMAPS-identified ePVSs. (e) mMAPS measured were correlated between repeated measures of the same participants for total volume (top) and count (bottom). (f) Spatial likelihood of the occurrence of an identified ePVS in all participants overlaid on a representative T1-weighted volume.
There was high intraparticipant correspondence across repeat visits. There was a strong positive correlation between total cluster number and total volume between two annual study visits (r = 0.82 for cluster number, r = 0.60 for total volume; P < .05) (Fig 4e). No association between PVS counts, volume, or width and participant age was observed in this sample.
Figure 4e:
Signal-to-noise ratio (SNR) and CNR measurements, visual count ratings, and mMAPS results. (a) Native and normalized signal-to-noise ratio and CNR measurements for ePVS versus normal-appearing white matter. PD = proton density, WM = white matter. (b) Visual ratings correlated well with one another (top), as well as with the results of mMAPS (bottom) in single-section measurements. Blue line is that of the expert rater (c) Single-section visual counts are correlated with total PVS volume, as measured with mMAPS (top) and total mMAPS ePVS count (bottom). (d) Distributions of volume (left), linearity (middle), and width (right) over all mMAPS-identified ePVSs. (e) mMAPS measured were correlated between repeated measures of the same participants for total volume (top) and count (bottom). (f) Spatial likelihood of the occurrence of an identified ePVS in all participants overlaid on a representative T1-weighted volume.
Type II errors observed were (a) contiguous ePVSs that were shaped as an “H” (ie, two ePVSs joined by an edge or corner because of partial volume effects on healthy tissue between them) and (b) ePVSs that were located in an area of low CNR, resulting in a less linear cluster than the de facto ePVS; these were eliminated on the basis of their nonlinear morphologic features. Examples of these errors can be found in Figure E2 and Movie 3 [online].
Movie 3.
Three-dimensional rendering of error type described in Figure E2a (“H” cluster).
Discussion
We present an automated method to segment ePVSs with commonly acquired clinical sequences at 3.0 T on a per-PVS basis. This fully automated method yields morphologic (linearity, volume, width) information for each ePVS, as well as total burden volume, which, to our knowledge, has not previously been well established.
Estimated morphology resulting from this process is consistent with the existing literature. The median width detected in each participant data set was 2.8 mm (range among all participants, 2.3–3.2 mm), which is consistent with established neuroradiologic reports of ePVS having a diameter of usually less than 3–5 mm (11,12); highly linear structures were still captured, with the maximum detected ePVS width being 13.5 mm in this sample. The total burden volumes identified with these methods (mean, 302 mm3) are higher than total volumes reported by other groups. Previous work requiring manual correction for elimination of false-positive voxels in the absence of cluster-specific morphologic characterization (5)—that is, large clusters (including those 5–15 mm in diameter) that would likely be excluded on the basis of cross-sectional size—are included in the present method only if they also are highly linear. Highly linear structures that meet the intensity profile are likely dilated spaces rather than lacunar infarcts (11), even up to 15 mm in diameter (12). The methods presented herein allow the user to modify minimum diameter, linearity thresholds, or both. Authors of recent studies (17,23) who used high-sensitivity imaging methods report a higher ePVS burden than in previous studies (5,24). In addition, the reported volumes are from whole-brain assessment rather than from strictly supratentorial white matter, which has been used to delineate centrum semiovale from other white matter. The methods described herein would enable users to limit analysis to a specific region of interest, including centrum semiovale specifically. When we restrict ePVS quantification to supratentorial white matter, the mean volume detected is 104.4 mm3, a value higher than but within the reported distribution range of previous work reporting total ePVS volume (5).
When evaluated with visual rating methods, all data sets included had a categorical score of “mild” burden (6): That is, assessment of the one axial section through the centrum semiovale was between 1 and 10 on the hemisphere with the highest burden in that section, resulting in a category score of 1. This category score was in perfect correspondence within raters and within mMAPS ratings. Although this narrow distribution represents a limitation in the assessment of the algorithm across burden levels, it does provide the opportunity to discuss the robustness of the methods with respect to sensitivity. Subsequent analysis of single-section cluster counts revealed a significant correlation between raters and mMAPS. Furthermore, there was a strong positive correlation between visual ratings and both counts and volumes extracted from the total brain, further supporting the use of these methods as a more robust assessment of whole-brain burden. The ability of these methods to reveal a distribution of ePVS burden in a sample that would have been categorically considered homogeneous shows their value in overcoming floor effects in the field (25) and provides an opportunity to evaluate subtle differences in data sets, which is of particular value in longitudinal studies (14).
In addition to providing an easily accessible method to discern the spatial distribution of ePVS in white matter, a whole-brain algorithm such as mMAPS will substantially increase the dynamic range of burden measurements beyond that of ePVS counts in one axial section. In these 28 data sets, counts in the whole brain were approximately 7.1 times greater than ePVS instances in a single section, and volume (or area), a quantity that is generally not measured in the assessment of one axial section, represents a nearly 100-fold increase in the range of the measured proxy variable for burden. Although studies on participants with high burden do not suffer as badly from the low dynamic range of single-section counts, these studies are unlikely to capture early stages of abnormal change that might better inform investigations of the etiology of ePVS. If categorical measurements of centrum semiovale or basal ganglia ePVS are used, as proposed by Potter et al (6), the range of burden severity becomes further truncated to five discrete categories. For example, the data presented here would have zero variance (all participants would be categorized as “1” with the categorical burden scale, having between one and 10 identified PVSs), which would preclude the possibility of statistical comparisons with semicontinuous variables that may be correlated or causative, such as age or blood pressure.
As presented earlier, the algorithm is built on two separate computational steps; the first is based on signal intensity, and the second is based on three-dimensional fitting of clusters of interest. Although not all data sets will have all sequences used in the described methods, thereby limiting the generalizability of this method, there is a precedent for extracting volumetric estimates of ePVS burden with fewer sequences (5). With sufficient resolution, it is reasonable that the morphologic fitting component of this algorithm could be applied to clusters identified in one- or two-sequence data sets. Similarly, the increased resolution and signal-to-noise ratio provided by refined sequences, increased field strength, or both would further increase the robustness of these methods. Partial volume effects inherent in any digitized imaging modality introduce an unavoidable amount of uncertainty in estimating the true diameter or volume of any body of interest, including ePVS (17). Smaller voxel sizes would increase the certainty of estimating the true width of the ePVS and may enable detection of nondilated PVS (23).
This study design also was limited by our assessment of ePVS in only white matter structures, as the ability to detect ePVS in basal ganglia structures is also of interest. Although we have not yet established the reliability of these methods in this region, it is likely that they will be similar, as the relative intensity of ePVS is isointense to CSF in this region as well. Morphologic constraints may need to be optimized to include larger-diameter ePVS in this area, however (11).
The additional information provided by simultaneous consultation of multiple sequences can increase sensitivity and specificity of ePVS segmentation; however, because of the small size of ePVSs, errors of misregistration across sequences can be a major source of error. Similarly, failure to successfully segment white matter from gray matter can result in errors because errant inclusion of voxels at the gray and white cortical interface may have an intensity profile similar to that of ePVS. Particularly in cases of very high burden, misclassification of PVS as nonbrain during white matter extraction can result in errors of omission. For these reasons, as in any automated analysis, visual confirmation of successful coregistration and final results is stressed.
Although increasing age has been reported as a correlate of ePVS burden, this has been assessed with visual rating in cases of very high burden (26). In reports using very high field strengths, the correlation with age has been an insignificant contributor to ePVS burden, particularly in the white matter (23). It is not surprising then that in our relatively healthy (low ePVS burden) cohort, a relationship with age was not observed. Application of this algorithm in a cohort of participants with a high burden is certainly warranted.
This algorithm was developed to identify typical ePVS on the basis of fit to mathematical models. We identified two ways in which these constraints were the source of errors. In areas that have low CNR, the segmentation can fail to define the border of the ePVS. This failure results in a large (or low-linearity) cluster that is subsequently eliminated on the basis of morphologic features. When this occurred, it tended to be at areas of the cortex far from the isocenter of the head coil near gray and white matter boundaries. This limitation might be remedied with the acquisition of images with higher spatial resolution or higher CNR or with more accurate shimming. Second, the algorithm fails to define clusters that are bridged by a voxel that results from partial volume effects (clusters that are shaped as an “H”). Although this limitation may be remedied by resampling the data into smaller voxels, such treatment of the data could lead to errant inclusion of voxels that are not truly representative of ePVS. Alternatively, an additional layer of cluster processing, such as one using a watershed method to separate contiguous clusters (27), may prove fruitful. Again, higher-resolution imaging would likely not be susceptible to this limitation.
As discussed previously, limitations of this method include (a) the need for closely aligned multimodal data sets, (b) uncertainty in volume estimates resulting from partial volume effects present in radiologic methods, and (c) current validation limited to white matter structures. An additional limitation of the study design is the use of data sets that were retrospective, which necessitated using parameters that were not optimized to identify ePVS specifically. The use of optimized sequences could reduce the number of sequences needed and more closely approximate the true burden.
In conclusion, we present a fully automated method to extract ePVS in clinical-field-strength MR imaging data. In addition to providing total ePVS volume information, this three-dimensional voxel-based approach to identifying ePVS provides morphologic characteristics of each ePVS, including volume, width, and linearity, as well as the ability to assess regional ePVS features.
Advances in Knowledge
■ Automated assessment of morphologic features (width, volume, linearity) of enlarged perivascular spaces (ePVSs) can be achieved in clinical-field-strength (3.0-T) MR imaging data.
■ The ePVS counts identified with this automated method were significantly correlated with reference standard visual rating scales (r = 0.65, P < .001; r = 0.69, P < .001; r = 0.54, P < .01 for raters 1, 2, and 3, respectively), while also yielding whole-brain information without requiring time-consuming sectionwise identification by a qualified rater.
■ Whole-brain per-occurrence volumetric quantification allowed for a more robust assessment of ePVS burden; in data sets that were categorically identical (single-section category of mild burden), MR imaging–based multimodal autoidentification of perivascular spaces identified more than seven times the count compared with visual ratings, which allows for increased resolution of burden assessment.
Implication for Patient Care
■ This three-dimensional voxel-based approach to identifying ePVSs provides morphologic characteristics of each ePVS, including volume, width, and linearity, as well as the ability to assess regional ePVS characteristics, features that may be more sensitive than current standard rating scales.
SUPPLEMENTAL FIGURES
Acknowledgments
Acknowledgments
The authors gratefully acknowledge the research participants for their time and effort. The authors also thank Randall Woltjer, MD, PhD, and Zoe Edelson for their contributions.
Received January 26, 2017; revision requested March 27; revision received April 19; accepted May 9; final version accepted May 24.
Supported by National Institutes of Health (1RO1AG036772, P30 AG008017, P30 AG024978, R01 AG042191, RO1 AG024059, S10 OD018224, S10 RR027694), the NIA/Layton Oregon Aging & Alzheimer’s Disease Center, Paul G. Allen Foundation, and VA Merit Review.
E.L.B. and D.L.S. contributed equally to this work.
Disclosures of Conflicts of Interest: E.L.B. disclosed no relevant relationships. D.L.S. disclosed no relevant relationships. D.L. disclosed no relevant relationships. J.P. disclosed no relevant relationships. J.J.I. Activities related to the present article: disclosed no relevant relationships. Activities not related to the present article: received grants from GlaxoSmithKline and Gilead Pharmaceuticals, received personal fees from GlaxoSmithKline. Other relationships: disclosed no relevant relationships. J.A.K. disclosed no relevant relationships. W.R. disclosed no relevant relationships. L.C.S. disclosed no relevant relationships.
Abbreviations:
- CNR
- contrast-to-noise ratio
- CSF
- cerebrospinal fluid
- ePVS
- enlarged PVS
- FLAIR
- fluid-attenuated inversion recovery
- mMAPS
- multimodal autoidentification of perivascular spaces
- PVS
- perivascular space
References
- 1.Weller RO, Subash M, Preston SD, Mazanti I, Carare RO. Perivascular drainage of amyloid-beta peptides from the brain and its failure in cerebral amyloid angiopathy and Alzheimer’s disease. Brain Pathol 2008;18(2):253–266. [DOI] [PMC free article] [PubMed] [Google Scholar]
- 2.Abbott NJ. Evidence for bulk flow of brain interstitial fluid: significance for physiology and pathology. Neurochem Int 2004;45(4):545–552. [DOI] [PubMed] [Google Scholar]
- 3.Iliff JJ, Wang M, Liao Y, et al. A paravascular pathway facilitates CSF flow through the brain parenchyma and the clearance of interstitial solutes, including amyloid β. Sci Transl Med 2012;4(147):147ra111. [DOI] [PMC free article] [PubMed] [Google Scholar]
- 4.Groeschel S, Chong WK, Surtees R, Hanefeld F. Virchow-Robin spaces on magnetic resonance images: normative data, their dilatation, and a review of the literature. Neuroradiology 2006;48(10):745–754. [DOI] [PubMed] [Google Scholar]
- 5.Ramirez J, Berezuk C, McNeely AA, Scott CJ, Gao F, Black SE. Visible Virchow-Robin spaces on magnetic resonance imaging of Alzheimer’s disease patients and normal elderly from the Sunnybrook Dementia Study. J Alzheimers Dis 2015;43(2):415–424. [DOI] [PubMed] [Google Scholar]
- 6.Potter GM, Chappell FM, Morris Z, Wardlaw JM. Cerebral perivascular spaces visible on magnetic resonance imaging: development of a qualitative rating scale and its observer reliability. Cerebrovasc Dis 2015;39(3-4):224–231. [DOI] [PMC free article] [PubMed] [Google Scholar]
- 7.Patankar TF, Mitra D, Varma A, Snowden J, Neary D, Jackson A. Dilatation of the Virchow-Robin space is a sensitive indicator of cerebral microvascular disease: study in elderly patients with dementia. AJNR Am J Neuroradiol 2005;26(6):1512–1520. [PMC free article] [PubMed] [Google Scholar]
- 8.Charidimou A, Jaunmuktane Z, Baron JC, et al. White matter perivascular spaces: an MRI marker in pathology-proven cerebral amyloid angiopathy? Neurology 2014;82(1):57–62. [DOI] [PMC free article] [PubMed] [Google Scholar]
- 9.Wuerfel J, Haertle M, Waiczies H, et al. Perivascular spaces: MRI marker of inflammatory activity in the brain? Brain 2008;131(Pt 9):2332–2340. [DOI] [PubMed] [Google Scholar]
- 10.Roher AE, Kuo YM, Esh C, et al. Cortical and leptomeningeal cerebrovascular amyloid and white matter pathology in Alzheimer’s disease. Mol Med 2003;9(3-4):112–122. [PMC free article] [PubMed] [Google Scholar]
- 11.Wardlaw JM, Smith EE, Biessels GJ, et al. Neuroimaging standards for research into small vessel disease and its contribution to ageing and neurodegeneration. Lancet Neurol 2013;12(8):822–838. [DOI] [PMC free article] [PubMed] [Google Scholar]
- 12.MdelC Hernández, Piper RJ, Wang X, Deary IJ, Wardlaw JM. Towards the automatic computational assessment of enlarged perivascular spaces on brain magnetic resonance images: a systematic review. J Magn Reson Imaging 2013;38(4):774–785. [DOI] [PubMed] [Google Scholar]
- 13.Pantoni L. Cerebral small vessel disease: from pathogenesis and clinical characteristics to therapeutic challenges. Lancet Neurol 2010;9(7):689–701. [DOI] [PubMed] [Google Scholar]
- 14.van den Heuvel DM, ten Dam VH, de Craen AJ, et al. Measuring longitudinal white matter changes: comparison of a visual rating scale with a volumetric measurement. AJNR Am J Neuroradiol 2006;27(4):875–878. [PMC free article] [PubMed] [Google Scholar]
- 15.Wang X, Hernández MdelC Valdés, Doubal F, et al. Development and initial evaluation of a semi-automatic approach to assess perivascular spaces on conventional magnetic resonance images. J Neurosci Methods 2016;257:34–44. [DOI] [PMC free article] [PubMed] [Google Scholar]
- 16.Ballerini L, Lovreglio R, Hernández MdelC Valdés, et al. Application of the ordered logit model to optimising Frangi filter parameters for segmentation of perivascular spaces. Procedia Comput Sci 2016;90:61–67. [Google Scholar]
- 17.Bouvy WH, Biessels GJ, Kuijf HJ, Kappelle LJ, Luijten PR, Zwanenburg JJ. Visualization of perivascular spaces and perforating arteries with 7 T magnetic resonance imaging. Invest Radiol 2014;49(5):307–313. [DOI] [PubMed] [Google Scholar]
- 18.Zong X, Park SH, Shen D, Lin W. Visualization of perivascular spaces in the human brain at 7T: sequence optimization and morphology characterization. Neuroimage 2016;125:895–902. [DOI] [PubMed] [Google Scholar]
- 19.Descombes X, Kruggel F, Wollny G, Gertz HJ. An object-based approach for detecting small brain lesions: application to Virchow-Robin spaces. IEEE Trans Med Imaging 2004;23(2):246–255. [DOI] [PubMed] [Google Scholar]
- 20.Promjunyakul N, Lahna D, Kaye JA, et al. Characterizing the white matter hyperintensity penumbra with cerebral blood flow measures. Neuroimage Clin 2015;8:224–229. [DOI] [PMC free article] [PubMed] [Google Scholar]
- 21.Pieper S, Lorensen B, Schroeder W, Kikinis R. The NA-MIC Kit: ITK, VTK, pipelines, grids and 3D slicer as an open platform for the medical image computing community. In: 3rd IEEE International Symposium on Biomedical Imaging: From Nano to Macro, 2006. Piscataway, NJ: Institute of Electrical and Electronics Engineers, 2006; 698–701. [Google Scholar]
- 22.Cox RW. AFNI: software for analysis and visualization of functional magnetic resonance neuroimages. Comput Biomed Res 1996;29(3):162–173. [DOI] [PubMed] [Google Scholar]
- 23.Bouvy WH, Zwanenburg JJ, Reinink R, et al. Perivascular spaces on 7 Tesla brain MRI are related to markers of small vessel disease but not to age or cardiovascular risk factors. J Cereb Blood Flow Metab 2016;36(10):1708–1717. [DOI] [PMC free article] [PubMed] [Google Scholar]
- 24.Chen W, Song X, Zhang Y; Alzheimer’s Disease Neuroimaging Initiative. Assessment of the Virchow-Robin Spaces in Alzheimer disease, mild cognitive impairment, and normal aging, using high-field MR imaging. AJNR Am J Neuroradiol 2011;32(8):1490–1495. [DOI] [PMC free article] [PubMed] [Google Scholar]
- 25.Gao FQ, Swartz RH, Scheltens P, et al. Complexity of MRI white matter hyperintensity assessments in relation to cognition in aging and dementia from the Sunnybrook Dementia Study. J Alzheimers Dis 2011;26(Suppl 3):379–388. [DOI] [PubMed] [Google Scholar]
- 26.Yakushiji Y, Charidimou A, Hara M, et al. Topography and associations of perivascular spaces in healthy adults: the Kashima scan study. Neurology 2014;83(23):2116–2123. [DOI] [PubMed] [Google Scholar]
- 27.Eddins S. The Watershed Transform: Strategies for Image Segmentation. Technical Articles and Newsletters 2002. https://www.mathworks.com/company/newsletters/articles/the-watershed-transform-strategies-for-image-segmentation.html. Published 2002. Accessed January 3, 2017.
Associated Data
This section collects any data citations, data availability statements, or supplementary materials included in this article.


