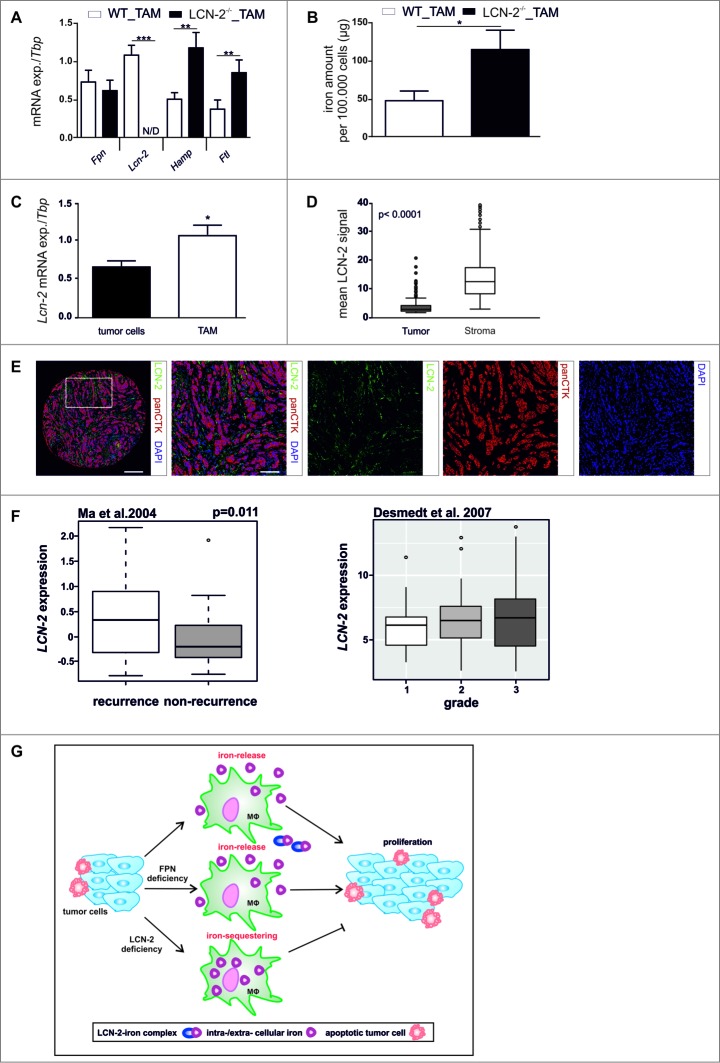
Figure 7.
LCN-2 is predominantly expressed in TAM and enhances tumor progression. (A) mRNA expression of iron-regulated genes (Fpn, Lcn-2, Hamp, Ftl) in WT (open bars) or LCN-2−/− (solid bars) TAM isolated from tumors of PyMT mice was analyzed by qPCR and normalized to Tbp expression (n = 5–9). (B) Iron amount in the lysates of WT (open bar) and LCN-2−/− (solid bar) TAM was quantified by AAS relative to the cell number (n = 5–7). (C) mRNA expression of Lcn-2 in tumor cells (solid bars) and TAM (open bars) isolated from tumors of WT PyMT mice was analyzed by qPCR and normalized to Tbp expression. Data are means ± SEM from independent experiments, *p < 0.05 vs. controls unless indicated otherwise (n = 6–11). (D + E) Primary human breast tumor samples were stained with antibodies against panCTK and LCN-2 with the Opal dye technique. DAPI was used as nuclear stain. (D) Quantitative comparison of the expression of LCN-2 in the tumor (solid box) and the stromal compartment (open box) (n = 198). (E) Representative picture of the costainings (scale bar = 200 µm for the core overview or 100 µm for close ups). (F) Meta-analysis of the correlation of recurrence and tumor grade with LCN-2 expression in breast cancer patients. Data are presented as box- and –whisker plots of LCN-2 gene expression in breast tumors. White and gray rectangles represent interquartile range, line in the middle of each rectangle represents the median value. Lines extending from the interquartile range mark the 5th and 95th percentile values, and the individual open circles represent values that are above the 95th percentile for each distribution. (G) Schematic representation of the impact of LCN-2 on the crosstalk of tumor cells and MΦ in terms of iron. Data are means ± SEM from independent experiments, *p < 0.05, **p < 0.01, ***p < 0.001 vs. the respective controls unless indicated otherwise.

