Abstract
Objectives
To measure and interactively visualize female breast cancer (FBC) incidence rates in Missouri by age, race, stage and grade, and senate district of residence at diagnosis from 2008 to 2012.
Methods
An observational epidemiological study. The FBC cases in counties split by senate districts were geocoded. Population database was created. A database was created within SEER*Stat. The incidence rates and the 95% Confidence Interval (CI) were age standardized using US 2000 Standard Population. The Census Bureau’s Cartographic Boundary Files were used to create maps showing Missouri senate districts. Incidence results were loaded along with the maps into InstantAtlas™ software to produce interactive reports.
Results
Cancer profiles were created for all 34 Missouri senate districts. An area profile and a double map that included interactive maps, graphs, and tables for the 34 Missouri senate districts were built.
Conclusion
The results may provide an estimation of social inequality within the state and could provide clues about the impact of level of coverage and accessibility to screening and health care services on disease prevention and early diagnosis.
Introduction
Breast cancer incidence rates could be increased by increasing the intensity of breast cancer screening measures and interventions. These rates might be decreased by increasing prevention measures for cancer risk factors [1].
The central cancer registry database is considered to be a high-quality source to estimate the epidemiological rates because it follows very strict regularly updated measures and standards [2]. Many studies have shown that there are inequalities between cancer cases according to age, race, and stage and grade at diagnosis [3-9].
Numerous evidence-based studies have concluded that the use of interactive geographic mapping software could allow users to interact easily with the datasets and help in publishing high-quality interactive reports. Distribution of geospatial health data could help public health leaders and decision makers in designing, developing, and adopting effective and efficient strategies and programs to improve public health outcomes targeting the heavily affected geographical areas with the visualized health event [10-12].
The aims of the current study were to: 1) measure female breast cancer (FBC) incidence rates in Missouri from 2008 to 2012 according to the FBC cases’ age at diagnosis, race, and the Senate District of residence at diagnosis; 2) visualize the measured incidence rates in InstantAtlas™ interactive mapping reports; and 3) compare spatial variances and potential disparities in incidence data between some senate districts and the state of Missouri.
Methods
The study’s design was an observational epidemiological study. The investigators did secondary analysis of all FBC cases in the Missouri Cancer Registry (MCR) database from January 1, 2008 through December 31, 2012.
The calculated incidence rates were age standardized using US 2000 Standard Population for comparability across regions with differing age structures. We calculated the 95% confidence interval (CI) for these rates using SEER*Stat statistical package [13]. The investigators compared the calculated Missouri demographic and geographical incidence rates using the same statistical package. The FBC cases in counties split by senate districts were geocoded to determine their district of residence; obtaining the denominator for districts with split counties presented a challenge. The investigators used TIGER/Line® Shapefiles and ESRI ArcMap™ to assign these FBC cases to senate districts [14].
Population data at the district, age, race, and year level for these cases was created by combining Census American Community Survey (ACS) and Population Estimation Program (PEP) data. A database was created in (SEER*Stat), a statistical software package for analyzing cancer data; variables were created and imported to aid analyzing MCR’s FBC in SEER*Stat. The Census Bureau’s Cartographic Boundary Files were used to create maps showing Missouri counties and state senate districts [15]. Incidence results were loaded along with the Cartographic Boundary Files into the InstantAtlas™ software to produce interactive mapping reports that display our study’s results. We will attach our interactive mapping reports to the MCR-ARC website. The interactive reports include maps, graphs, and tables for Missouri’s 34 senate districts.
The senate district assignment process included all of MCR’s FBC cases diagnosed from 1996 through 2012 who were residents of Missouri at diagnosis; the final analysis and maps only include those diagnosed from 2008 through 2012 with a known county of residence. To keep the registered FBC cases’ confidentiality, we suppressed cells with small counts, using a commonly-used threshold of five or fewer FBC cases [16].
Race was assessed due to persistent disparities between African-American and white FBC patients, these data are collected by reporting facilities and may be a mixture of self-reported and assigned values. For the years included in this study, fairly detailed racial categories could be specified (e.g., Vietnamese) and up to five races could be recorded.
Results
The senate districts’ incidence rates of FBC were classified, as shown in tables 1-3, along with the following variables: All malignant FBC cases, age at diagnosis (<50, 50-64, and 65+), race (African-American or white), late stage (regional + distant), and high grade (III + IV). The tables contain the incidence rates for all 34 senate districts and Missouri and the 95% confidence intervals of the measured incidence data for all the above-mentioned variables.
Figure 1.
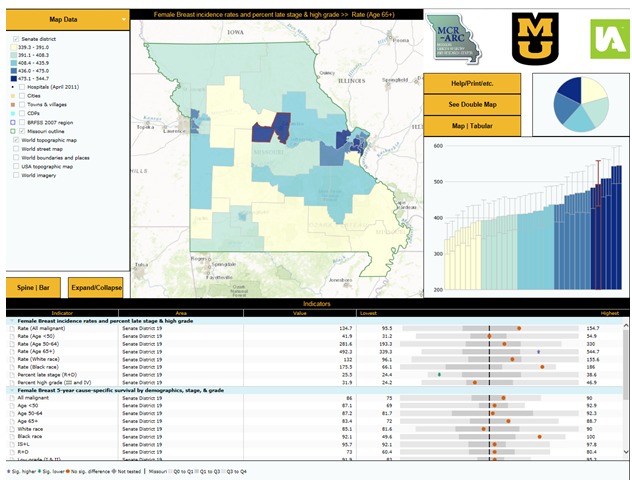
Area Profile Interactive InstantAtlas™ Report Displaying Female Breast Cancer (FBC) Incidence Data by Senate District (Age 65+ Years Old) 2008-2012 [17].
Figure 2.
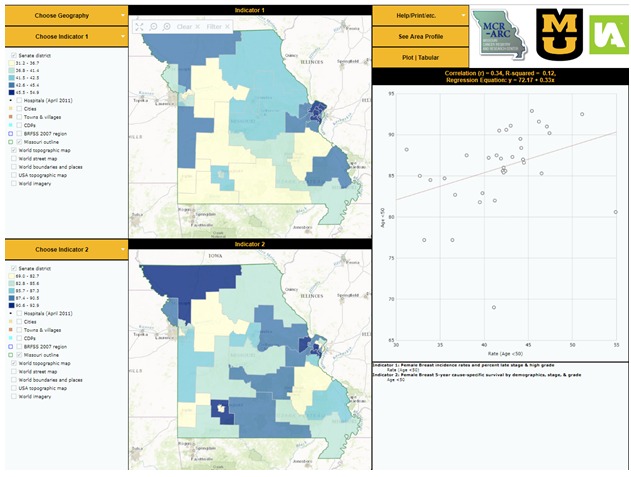
Double Map Interactive InstantAtlas™ Report Displaying Female Breast Cancer (FBC) Incidence Rates and Percent Late Stage and High Grade by Senate District (Age <50 Years Old) Compared to the Female Breast 5-Year Cause-Specific Survival by Senate District (Age <50 Years Old) 2008-2012 [18].
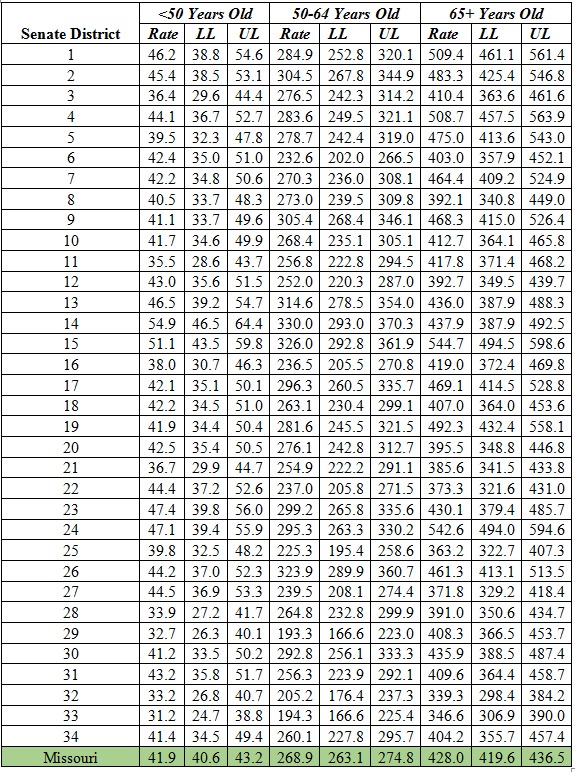
Table 1. Female breast cancer (FBC) incidence rates across different age groups of females in Missouri (2008-2012).
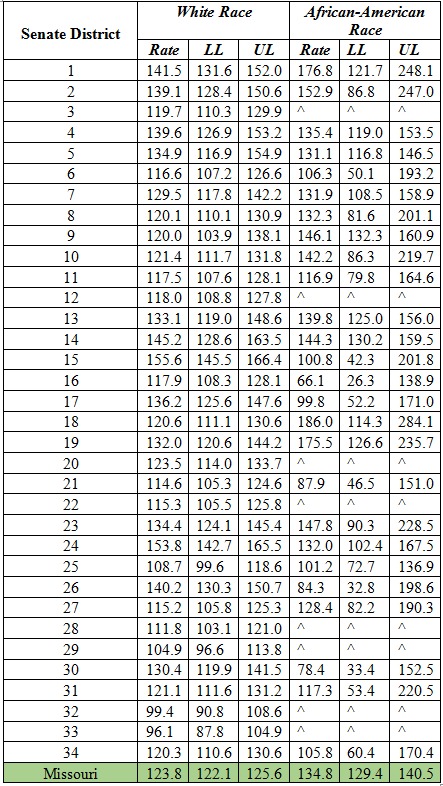
Table 2. Female breast cancer (FBC) incidence rates by race (African-American and white) in Missouri (2008-2012).
^: Incidence statistics based on small number of new cases are suppressed to help protect confidentiality. As commonly used by MCR-ARC and other central cancer registries, the threshold of five (5) was utilized.
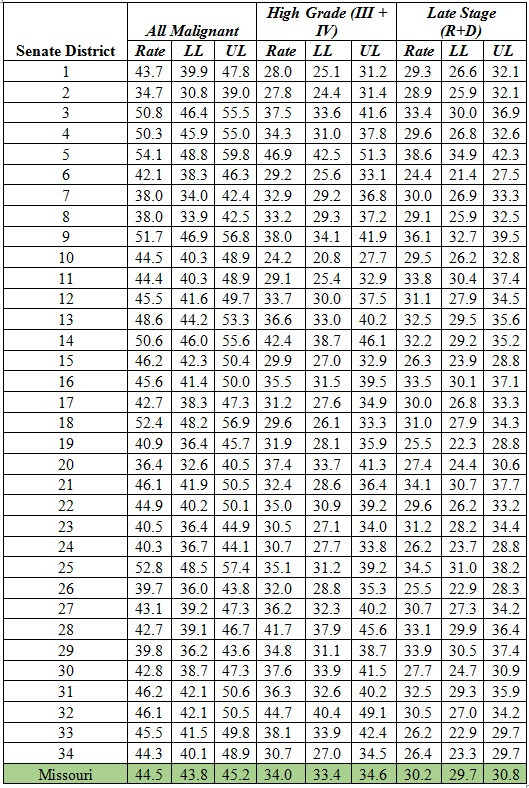
Table 3. Incidence rates of all malignant, high grade, and late stage of female breast cancer (FBC) cases in Missouri (2008-2012).
From the current study’s results, as shown in tables # 1, 2, & 3, we can build FBC incidence profiles for the 34 Missouri senate districts. These profiles enable us to compare individual district’s results to the state of Missouri and to other districts’ incidence data.
The current study investigators produced senate districts interactive reporting maps using the Census Bureau’s Cartographic Boundary Shapefiles. Our senior statistician uploaded these mapping data along with our FBC incidence results obtained by analyzing MCR data using SEER*Stat to InstantAtlas™ data visualization software to generate interactive maps [17,18]. These interactive maps, in addition to the FBC incidence rates, also display mortality for FBC and other cancers and survival data on county, senate district, and senate district grouped to county boundaries (SDGC). The maps visualize FBC incidence data and the mapping reports are in two layouts: Area profile and double map formats. These maps consist of joint spatial and statistical data. The following figures show the final layouts of the InstantAtlas™ mapping reports we constructed at the Missouri Cancer Registry and Research Center (MCR-ARC) to present Missouri FBC incidence data.
Both mapping reports displayed our results in different formats (example: charts, tables, maps) [17,18]. The area profile report shows a single map and focuses on displaying many indicators for every senate district and compares the districts’ findings to each other and to Missouri. The double map focuses on exploring the inferential statistical relationships between the selected indicators [17,18].
Discussion
The central cancer registry database is created from different data sources, including hospitals (inpatient and outpatient settings), pathology labs, ambulatory surgical centers, long-term care facilities, physician offices and free-standing cancer clinics and treatment centers (192.650-192.657 RSMo) and data exchange with other states’ central registry. The MCR data undergo strict quality control measures and the data have been assessed continually according to nationwide standards [1,2]. For all these reasons, central cancer registry databases are considered the best population-based sources to estimate the distribution of cancer incidence within the studied states.
Calculation and visualization of the FBC age-standardized incidence rates could help public health officials and policy makers to be informed about FBC distribution by age, race, grade and stage at diagnosis, and senate district. This might effectively impact FBC policy and research, determine female at-risk groups, support targeting FBC geographical foci, and evaluate and compare diagnostic and treatment strategies all over Missouri.
Potential Problems
In high population density areas — Kansas City metropolitan area, Saint Louis metropolitan area and the City of Springfield — district limits do not follow county boundaries [19]. In these areas, the Census Bureau’s TIGER/Line shapefiles software was used to determine the district containing the latitude and longitude of the address at diagnosis [14].
A problem encountered is that we did not have successfully geocoded street addresses of all FBC cases due to missing or inaccurate addresses. In these situations, we categorized them as residents of the most likely senate district by matching to cases that were successfully assigned into their senate district with the same county (if known), race (if known and categorized as white, African-American, and other), year of diagnosis (categorized into two time periods), and the nine-digit Postal ZIP Code. When multiple senate districts matched, then the most common one was selected; when none matched, then the process was iteratively repeated by removing the least significant digit of the Postal ZIP Code until a senate district was imputed for every case.
Unlike with county-level data, a detailed population file by age (in 19 groups of mostly 5-years except with <1 year-olds and 85+), race (bridged single-race), year, and sex was not found at the senate district level and had to be constructed. The limitations of this population file are that for senate districts that do not follow county boundaries, there is a mismatch between the Office of Management and Budget (OMB) 1977 and 1997 race classifications; granular age-groupings were approximated; and there is an increasing inaccuracy as one moves away from 2009-2013.
Conclusion
Measurement of incidence rates by race, age, stage and grade at diagnosis and district of residence may provide an estimation of social inequality within the state and could provide clues about the impact of level of coverage and accessibility to screening and health care services on disease prevention and early diagnosis [1]. The detailed and visually presented FBC age-adjusted incidence profiles by senate district might lead researchers and policy makers to understand effectiveness of current breast cancer initiatives and interventions and give clues about possible environmental and socioeconomic risk factors on breast cancer.
According to the study results and by future research based on these results, policy makers might embrace new effective breast cancer screening and prevention initiatives and interventions in Missouri, nationally, and internationally.
Acknowledgements
Core activities of the Missouri Cancer Registry are supported in part by a cooperative agreement between the Centers for Disease Control and Prevention (CDC) and the Missouri Department of Health and Senior Services (DHSS) (5NU58DP003924-04/05) and a Surveillance Contract between DHSS and the University of Missouri. The publication’s content is exclusively the responsibility of the authors and does not necessarily reflect the views of the funders.
Footnotes
Conflicts of Interest: None declared
References
- 1.Ellis L, Woods LM, Estève J, Eloranta S, Coleman MP, et al. 2014. Cancer incidence, survival and mortality: explaining the concepts. Int J Cancer. 135(8), 1774-82. 10.1002/ijc.28990 [DOI] [PubMed] [Google Scholar]
- 2.Curado MP, Edwards B, Shin HR, Storm H, Ferlay J, et al. Cancer incidence in five continents, Volume IX. IARC Press, International Agency for Research on Cancer; 2007. Available at https://www.iarc.fr/en/publications/pdfs-online/epi/sp160/CI5vol9-A.pdf
- 3.Berrino F, De Angelis R, Sant M, Rosso S, Lasota MB, et al. EUROCARE Working Group 2007. Survival for eight major cancers and all cancers combined for European adults diagnosed in 1995–99: results of the EUROCARE-4 study. Lancet Oncol. 8(9), 773-83. 10.1016/S1470-2045(07)70245-0 [DOI] [PubMed] [Google Scholar]
- 4.Clegg LX, Reichman ME, Miller BA, Hankey BF, Singh GK, et al. 2009. Impact of socioeconomic status on cancer incidence and stage at diagnosis: selected findings from the surveillance, epidemiology, and end results: National Longitudinal Mortality Study. Cancer Causes Control. 20(4), 417-35. 10.1007/s10552-008-9256-0 [DOI] [PMC free article] [PubMed] [Google Scholar]
- 5.Harper S, Lynch J, Meersman SC, Breen N, Davis WW, et al. Trends in area-socioeconomic and race-ethnic disparities in breast cancer incidence, stage at diagnosis, screening, mortality, and survival among women ages 50 years and over (1987-2005). Cancer Epidemiology and Prevention Biomarkers. 2009 Jan 1;18(1):121-31. Available at http://cebp.aacrjournals.org/content/18/1/121.full.pdf [DOI] [PubMed]
- 6.Howe HL, Wu X, Ries LA, Cokkinides V, Ahmed F, et al. 2006. Annual report to the nation on the status of cancer, 1975–2003, featuring cancer among US Hispanic/Latino populations. Cancer. 107(8), 1711-42. 10.1002/cncr.22193 [DOI] [PubMed] [Google Scholar]
- 7.Merkin SS, Stevenson L, Powe N. 2002. Geographic socioeconomic status, race, and advanced-stage breast cancer in New York City. Am J Public Health. 92(1), 64-70. 10.2105/AJPH.92.1.64 [DOI] [PMC free article] [PubMed] [Google Scholar]
- 8.Newman LA, Martin IK. 2007. Disparities in breast cancer. Curr Probl Cancer. 31(3), 134-56. 10.1016/j.currproblcancer.2007.01.003 [DOI] [PubMed] [Google Scholar]
- 9.Schootman M, Jeffe DB, Reschke AH, Aft RL. 2003. Disparities related to socioeconomic status and access to medical care remain in the United States among women who never had a mammogram. Cancer Causes Control. 14(5), 419-25. 10.1023/A:1024941626748 [DOI] [PubMed] [Google Scholar]
- 10.Chakalova G, Dimitrova N, Gavrilov I, Valerianova Z. 2013. Cancer burden of breast and gynecological cancers in Bulgaria: epidemiology and clinical aspects. J BUON. 18(October–December (4)), 1038-44. http://www.jbuon.com/pdfs/1038-1044.pdf. [PubMed] [Google Scholar]
- 11.Driedger SM, Kothari A, Morrison J, Sawada M, Crighton EJ, et al. 2007. Correction: Using participatory design to develop (public) health decision support systems through GIS. Int J Health Geogr. 6(1), 53. 10.1186/1476-072X-6-53 [DOI] [PMC free article] [PubMed] [Google Scholar]
- 12.van der Wilk EA, Verschuuren M. 2010. Adding value to figures: a web-based European public health information system. J Telemed Telecare. 16(1), 35-41. 10.1258/jtt.2009.001010 [DOI] [PubMed] [Google Scholar]
- 13.National Cancer Institute. Surveillance, Epidemiology, and End Results Program: SEER*Stat Software, latest release version 8.3.2-April 14, 2016; 2016. Available at http://seer.cancer.gov/seerstat/
- 14.United States Census Bureau. Geography: TIGER/Line® Shapefiles and TIGER/Line® Files; 2017. Available at https://www.census.gov/geo/maps-data/data/tiger-line.html
- 15.United States Census Bureau. Geography: Cartographic Boundary Shapefiles; 2017. Available at https://www.census.gov/geo/maps-data/data/tiger-cart-boundary.html
- 16.Hofferkamp J. Standards for cancer registries volume III: standards for completeness, quality, analysis, management, security and confidentiality of data. Springfield, IL: North American Association of Central Cancer Registries; 2008. Available at https://20tqtx36s1la18rvn82wcmpn-wpengine.netdna-ssl.com/wp-content/uploads/2016/11/Standards-for-Completeness-Quality-Analysis-Management-Security-and-Confidentiality-of-Data-August-2008PDF.pdf
- 17.Schmaltz C, Ben Ramadan A. MCR-ARC County and senate district by age, race, stage, & grade area health profile report; 2016. Available at: https://instantatlas.umh.edu/IAS/DynamicReports/areaHealthProfile2015-SD/atlas html
- 18.Schmaltz C, Ben Ramadan A. MCR-ARC County and senate district by age, race, stage, & grade double map report; 2016. Available at: https://instantatlas.umh.edu/IAS/DynamicReports/doubleMap2015-SD/atlas html Archived at: http://www.webcitation.org/6pVJglkrE
- 19.Missouri Senate. Missouri Senate: Statewide District Map; 2017. Available at http://www.senate.mo.gov/districtmap/


