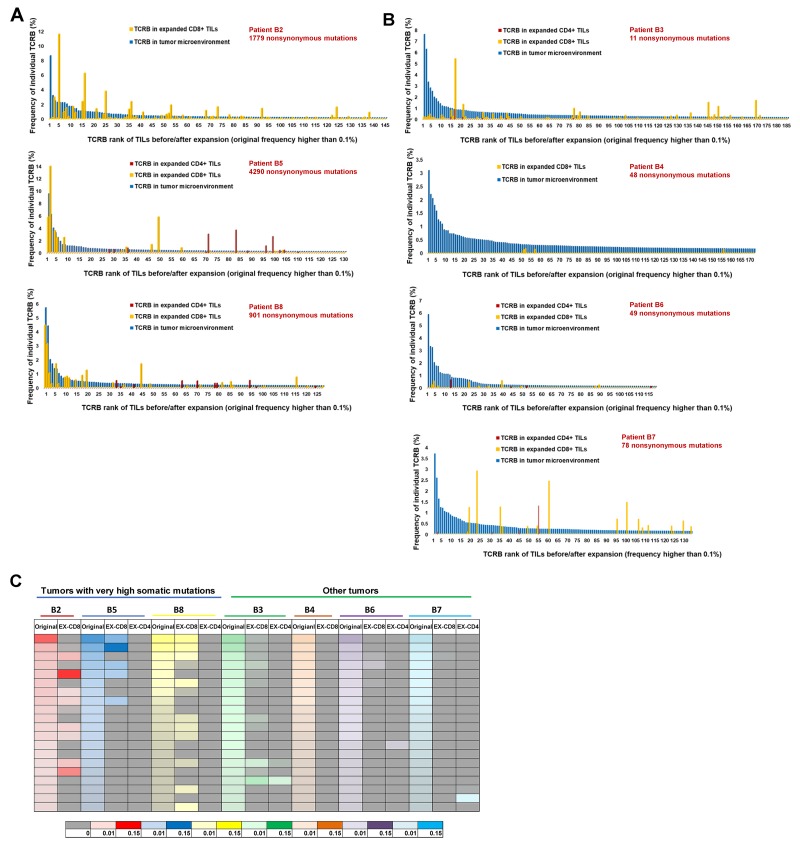
Figure 3. Comparison of TCR-β repertoire between TILs in original tumors and those expanded in vitro.
(A) Comparison of TCR-β clonotypes of TILs before and after expansion in 3 tumors with very high mutational load. (B) Comparison of TCR-β clonotypes of TILs before and after expansion in remaining 4 tumors. The blue bars represent the frequencies (ordered by the frequencies from highest to lowest) of the common CDR3 clonotypes (the frequency of 0.1% or higher in all mapped TCR reads) in TILs in the original tumors (a mixture of CD4+ and CD8+ cells). The orange bars represent the frequencies of CDR3 clonotypes in expanded CD8+ populations and the red bars represent those in the expanded CD4+ populations. (C) Heatmap showing changes between original top 20 clones before and after in vitro expansion. For each patient, TCR-β repertoire data of original TILs (represented by original), expanded CD8+ TILs (represented by EX-CD8), expanded CD4+ TILs (represented by EX-CD4) are listed. The frequencies of individual CDR3 clonotypes are indicated by graduation of colors and different colors on the bottom of the heatmap indicate individual patients.

