

Abstract
Caenorhabditis elegans (C. elegans) is a prominent model organism in neuroscience, as its small stereotyped nervous system offers unique advantages for studying neuronal circuits at the cellular level. Characterizing temporal dynamics of neuronal circuits is essential to fully understand neuronal processing. To characterize the temporal dynamics of chemosensory circuits requires a precise and fast method to deliver multiple stimuli and monitor the animal’s neuronal activity. Microfluidic platforms have been developed that offer an improved control of chemical delivery compared to manual methods. However, stimulating an animal with multiple chemicals at high speed is still difficult. In this work, we have developed a platform that can deliver any sequence of multiple chemical reagents, at sub-second resolution and without cross-contamination. We designed a network of chemical selectors wherein the chemical selected for stimulation is determined by the set of pressures applied to the chemical reservoirs. Modulation of inlet pressures has been automated to create robust, programmable sequences of subsecond chemical pulses. We showed that stimulation with sequences of different chemicals at the second to sub-second range can generate different neuronal activity patterns in chemosensory neurons; we observed previously unseen neuronal responses to a controlled chemical stimulation. Because of the speed and versatility of stimulus generated, this platform opens new possibilities to investigate neuronal circuits.
TOC image
This microfluidic platform enables monitoring neuronal activity of C. elegans in response to dynamic multichemical cues.
Introduction
Caenorhabditis elegans, with its small stereotyped neuronal architecture, is well suited for studying many different aspects of the nervous system.1 In particular, C. elegans is an excellent system for examining chemosensation, as it plays a fundamental role in worm development and behavior. Previous studies have revealed some of the molecular mechanisms,2-4 cellular function5 and operation,6-9 and neuronal circuits10-15 involved in chemosensation. A major challenge in understanding chemosensory circuits is the characterization of the temporal dynamics of how chemical cues are sensed and processed during decision making.16 In its natural environment, C. elegans is exposed to complex, fluctuating patterns of odors, requiring it to perform multi-sensory integration. Multiple odorant stimuli can lead to combinatorial effects on the animal’s development and behavior. Moreover, C. elegans integrates incoming information at varying timescales. For example, a chemotactic circuit that drives biased random walk locomotory behaviour has been shown to integrate chemosensory information over several tens of seconds.17 In contrast, the behavioural circuits that drive another chemotactic strategy, klinokinesis, likely integrate incoming information at 1 Hz timescales.16, 18 Characterizing the temporal dynamics of chemosensory circuits engaged in multi-sensory integration tasks requires the ability to stimulate individual animals with multiple chemical cues and vary the duration of each stimulus over the second to sub-second temporal range (Fig. 1a).
Fig. 1.
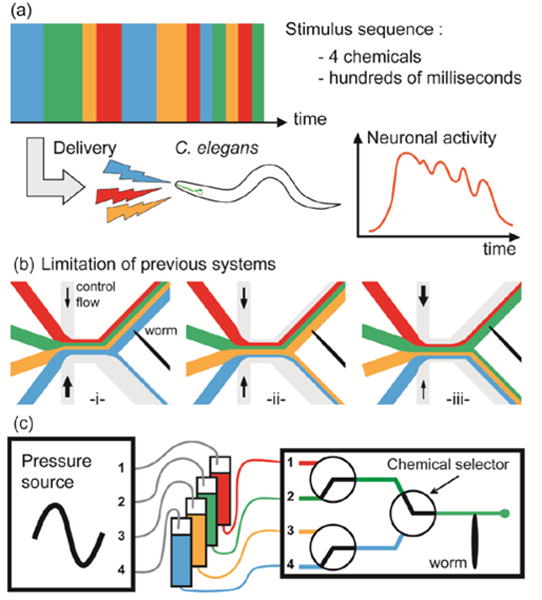
(a) The goal is to create arbitrary sequences of sub-second chemical pulses to stimulate C. elegans animals and monitor neuronal activity. (b) A limitation of previous devices seeking to deliver multiple stimuli is the inability to switch from one chemical to another without cross-contamination. In previous configurations, alternating from blue to green is not possible without an intermediate step through yellow. (c) Our system integrates multiple flow selectors and uses pressure modulation of chemical inlets to create any sequence of four chemicals at sub-second speed.
Generating multi-chemical stimulant sequences with sub-second pulse lengths is challenging. In traditional assays, the animals are glued on a glass slide and chemical stimulants are delivered with a micro-manipulator operated capillary. In addition to being time-consuming and labour-intensive, this method lacks the temporal precision to deliver sub-second stimulation. Microfluidic technologies allow for the precise handling of liquids, and have been previously used to generate dynamic chemical stimulation for both single-cell and multicellular organism assays.19-24 However, current systems are either unable to deliver rapid stimuli and/or are restricted to deliver only a limited number of stimuli. In particular, the platform developed by Chronis et al,23 which has become the standard tool for assaying chemosensory neuronal activity in C. elegans,10, 25 can create varying patterns of two chemicals up to 5 Hz.16 However, it would be difficult to increase the number of chemical stimulants this platform can deliver for several reasons. First, modifying the platform for additional stimulant delivery would require precise re-positioning of three flow interfaces at a few tens of microns (Fig. 1b). This may be particularly challenging for long sequences of stimulation with flow instabilities occurring at every switch. Second, switching between non-adjacent streams would, due to the nature of this platform, involve exposing the worm to the intermediate stimuli streams (Fig. 1b). This would result in an undesired stimulation of the animal for several hundred milliseconds.16 Wang et al have developed a different stimulus delivery system and demonstrated multi-chemical sequences up to four cues.24 However, due to flow instabilities, this system cannot deliver pulses shorter than 5 seconds. For these reasons, delivering sequences of multiple chemicals with sub-second pulse duration remains a challenge.
Here we present a microfluidic platform to deliver programmable sequences of up to four chemicals with sub-second resolution while simultaneously monitoring C. elegans neuronal activity. To circumvent the difficulty of handling four chemicals with one selector, the platform integrates multiple two-flow selectors. The sub-second switching speed of this platform is achieved via pressure modulation of the chemical inlets (Fig. 1c). We demonstrate the ability to monitor the neuronal response to complex stimuli by recording the specific neuronal activity from two different classes of chemosensory neurons, ASH and AWC, with multi-chemical cues patterned at the second to sub-second range.
Methods
Device fabrication
The microfluidic device was fabricated using classical soft lithography techniques.26 A master of the channel network was obtained by spincoating three 17-μm-thick layers of SU-8 2020 photoresist on a silicon wafer and using optical lithography to create the channel pattern. The channel network had a uniform height of 50 μm, except for a shallower section where the animal head was trapped (h = 34 μm over the animal’s head and h = 17 μm at the junction). The 34 μm shallower section helped maintain the neurons of interest in the focal plane of a microscope. After development in SU-8 developer, the master was treated overnight with an anti-adhesive coating (TMCS). A mixture of 23:1 polydimethylsiloxane(PDMS):crosslinker was then spincoated on top of the wafer to obtain a thickness of 100 μm and cured in the oven at 90 °C for 30 min. A second mixture of 10:1 PDMS:crosslinker was then poured on top of the master to reach a 5-mm thick layer. After curing in the oven at 90 °C for 30 min, blocks of PDMS were cut, access wells punched using a 21-gauge needle, and each individual PDMS unit was bonded to a glass slide via plasma treatment.
C. elegans maintenance and reagent preparation
We used strains expressing GCaMP fluorophore in ASH and AWC sensory neurons: CX10979 kyEx2865[Psra-6:GCaMP3.0 Pofm-1:GFP] and CX11935 kyEx3252[Pstr-2:GCaMP3.0 Pofm-1:GFP]. The strains were maintained on NGM plates seeded with lawns of the Escherichia coli strain OP50.27 Animals were synchronized by leaving gravid hermaphrodites on plates for 2 hours to lay eggs. The hermaphrodites were then removed, the plates were placed in a 20 °C incubator for 4 days. Day-1 adults were then picked immediately prior the experiments, washed three times with S-basal solution, and injected in the device. Chemical reagents used to stimulate the animals were all dissolved in S-basal solutions. Solutions of glycerol at 1 M, NaCl at 0.5 M, benzaldehyde at 10 μM, butanone at 1 mM, and isoamyl alcohol (IAA) at 1 μM, 10 μM, and 1 mM concentrations were prepared. Fluorescein was added at different concentrations to label the stimuli (1, 0.5, and 0.25 mM).
Experimental set-up
The microfluidic device was connected to four liquid stimulus reservoirs and one reservoir containing animals via PE tubing. The device was placed on an epifluorescence microscope. Bright-field imaging was used to load the worms and ensure proper head orientation in the microfluidic trap. Fluorescence imaging was performed to monitor neuronal activity. An LED light source (SpectraX, Lumencor) was used to excite the GCaMP reporter at 440 nm. Neurons were imaged using a 40× objective on a Hamamatsu camera. Liquids were actuated using a custom automated hardware system. To automate pressure control, servo motors (LS-0009AF, Metal Gear Digital) were mounted on pressure regulators for independent pressure control of the inlet reservoirs. A microcontroller (Basic Stamp II) was used to vary the positions of the four motors resulting in simultaneous pressure changes in the liquid reservoirs containing the chemical stimuli. Series of applied pressures were programmed in via the Basic Stamp Editor Software enabling rapid stimulus stream selection for presentation to the animal. See Supplemental Fig. 1 for more details about the platform configuration and operation.
Device operation and data analysis
Prior to injecting animals into the device, the device was degassed and inlet pressures were manually balanced. Motors were initially calibrated such that the four stimuli streams contributed equally to the total flowrate. Then, the motors were given a command to select the first chemical to stimulate the animals with. After loading the animal head-first, the animal was paralyzed using a tetramisole solution at 1 mM. When imaging ASH chemosensory neurons, the animal was exposed to blue light for 90 s prior to any chemical stimulation. This exposure is designed to habituate the neuron to blue light and prevents further blue light responses in ASH.23, 28 Afterwards, a customizable, predetermined multi-chemical sequence was delivered to the animal, while continuously recording the fluorescence signal from either ASH or AWC chemosensory neuron. Finally, the animal was pushed forwards through the trap and out of the device before loading another animal. The methods used during imaging prevent pre-exposure of stimuli to the worm; furthermore, there is no need to recalibrate the system between each imaged worm.
Neuronal activity was analyzed using a custom MATLAB script. Because of the use of fluorescent dyes in the stimulus streams, we used an adapted formula to quantify the neuronal activity.16 Fluorescent GCaMP response was calculated using the formula ΔF/F0 where ΔF = FNeuron-FBackground, with FNeuron being the average intensity in a region of interest including the target neuron, and FBackground being the average intensity in a region of interest adjacent to the target neuron (background). F0 is defined as the starting signal baseline (the average ΔF value for the first three seconds of recording).
Neuronal functional imaging upon mechanical stimulation
The assays for testing the neuronal response of C. elegans to mechanical stimulation were carried out using a separate chip following the method previously developed by Cho et al.29
Results
Design principles of stimulus selection
We have developed a platform to monitor neuronal activity of C. elegans upon stimulation with programmable sequences of second-to-subsecond-long chemical pulses. To stimulate the animal with four chemicals in a controlled manner requires a selection mechanism. Selection between two laminar streams is easily achieved using side-ways control flows.23 However, scaling up this selection mechanism is difficult: Flowing the desired chemical stream over the animal, while four chemical streams co-flow in the channel, requires great precision in the positioning of the stream interfaces as well as keeping them stable (Fig. 1b). To address these issues, we decomposed the problem of selection of four chemical streams into a series of two-by-two selections (Fig. 2a). We designed a fluid control scheme in which slight modulations in pressures of the different inlet reservoirs shifts the interfaces of four continuously flowing stimulus streams to A) reject two of the four stimulus streams at Stage 1 and B) divert one of the two remaining streams over the worm at Stage 2.
Fig. 2.
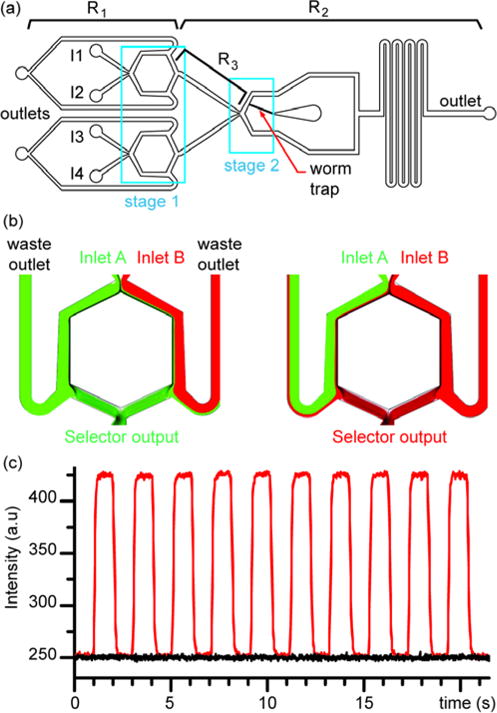
Platform design. (a) Device design integrates three chemical selectors distributed in two stages. First stage allows for selecting two chemicals that feed the second stage to select the stimulus present at the worm’s head. Optimization of balance in resistances is necessary: R1/R2 relates to the sensitivity to pressure variation to achieve chemical switch; R3 must prevent backflow when switching inlet pressures while allowing for brief residential time to ensure sub-second chemical switch. (b) Upstream chemical selector unit design. COMSOL simulation demonstrating the on-demand selection of stimulus 1 or 2 depending on inlet pressure A and B. (c) Experimental validation of the chemical selector unit by injecting a fluorescent dye solution in inlet1 and a non-fluorescent solution in inlet2. Intensity monitored at the output “selected chemical” shows square signal (red curve) reflecting the modulation of pressure commands at inlet A. Background intensity (black curve) gives a baseline of reference to demonstrate the full removal of the dye solution during alternations.
In Stage 1, four inlet streams enter the device as two pairs of laminar streams. Each pair of laminar streams encounters a selector unit (Fig. 2b). An X-junction first splits the streams, and subsequently, two bypass channels placed on each arm of the selector stage divert the major part of the flow out of the device to waste outlets. A fraction of the flow corresponding to the central-most streamlines merge at the output of the selector stage, which results in chemical selection. To track for precise stream selection in an operational setting, we monitored the intensity of a region of interest (ROI) at the output of the selector unit while switching between a 1 mM fluorescein solution and a solution without fluorescein (Fig. 2c). We first quantified the fluorescence intensity prior to injecting any fluorescent dye to generate a baseline measurement (black curve). The fluorescence intensity of the ROI rapidly drops to the baseline level every time the solution without fluorescein is selected, demonstrating the precise selection of the desired chemical. By associating two selector units in parallel, selection of two streams out of four is made possible.
In Stage 2, the two selected streams from the first stage merge and the fluid flow is split to two branches. One branch contains a worm trap for immobilizing and imaging the animal’s response to chemical stimuli. Pressure difference between the two pure streams entering Stage 2 controls which one of the two incoming stimulus streams flows over the animal. Thus, the sum of the two inlet pressures in one of the upstream selector stages must have a higher value than the sum of the pressures of the other two inlets.
Maintaining pressure balance in the system is critical to avoid backflows to the stimulus inlets when selecting between multiple stimulus streams. Backflows result in cross contamination between stimuli and slow the response time when switching stimuli. We addressed this problem by carefully designing the Stage 1 waste stream outlets between the stimulus inlets and Stage 2 and balancing the fluidic resistances R1, R2, and R3 (Fig. 2a). We aimed to design a system responsive enough to simultaneously select streams at Stage 1 and at Stage 2, while also ensuring that it was not too sensitive, which could lead to slight instabilities from transients that result in backflows and errors in stream selection operations. To ensure the platform operated within a reasonable range of pressures and flowrates, we optimized the hydraulic resistance balance between the upstream waste outlets (R1) and downstream outlet of the network (R2). COMSOL CFD simulations were performed for the channel network shown in Figure 2a (Supplemental Table S1). The resistance ratio R2/R1 governs the sensitivities of both Stage 1 and Stage 2. The lower the ratio R2/R1, the lower the pressure differential between incoming streams of selector units for both Stage 1 and Stage 2 needed to select chemicals. However, too low values of R2/R1 result in an extremely sensitive system in which fluid flow instabilities arise from the transients during stream switching and other slight perturbations of the fluid network. Furthermore, high values of R2/R1 requires large operational pressures to maintain desired flowrates (for our purpose, ~35 μL/min at the animal’s nose). In addition, high flow rates present at the Stage 1 selector units may induce vortices and mixing.30 COMSOL CFD simulations led to the optimal values of R1 and R2 (Supplemental Table S.3) for which stream switching could be obtained with pressure differences in the order of 1 psi. Such pressure modulation is easily obtained with our system containing standard servo motors and pressure regulators.
To probe C. elegans neuronal responses across different timescales, stimuli from a few hundred milliseconds to several seconds must be delivered. While generating second long pulses is easily achievable, producing sub-second stimuli is challenging because of mixing. A critical parameter is the resistance R3 of the fluid network between Stage 1 and Stage 2. Minimizing the resistance value R3 facilitates the generation of short pulses because low R3 values enable faster fluid exchange. However, if the resistance value R3 is too low, backflow instabilities arise when switching streams and provoke mixing. COMSOL CFD simulations were performed to determine a working range for R3 that enables the generation of short pulses. Using the optimal value of R2/R1 previously calculated, the simulations indicated that, for R3/R2 in the order of 0.06, total fluid exchange is achieved in less than 250 ms without any mixing (Supplemental Table S.2).
Platform operation and characterization
To accurately probe the C. elegans chemosensory system, stimulus delivery must be achieved without cross-contamination. Doing so is challenging in other platforms, as their selectors involve mixing or transitory exposure to a third chemical or washing with a buffer (Fig. 1b). Because we changed the mechanism for fluid selection, our platform can avoid cross-contamination when operated with four different pressures applied in specific combinations. Pressures High-High and High-Low (PHH, PHL) are applied to the first pair of reservoir inlets and pressures Low-High and Low-Low (PLH, PLL) are applied to the second pair (Fig. 3a). The pressures follow the conditions: PHH > PHL, PLH > PLL, and PHH+PHL > PLH+PLL so that the chemical selected is the reservoir whose applied pressure is PHH.
Fig. 3.
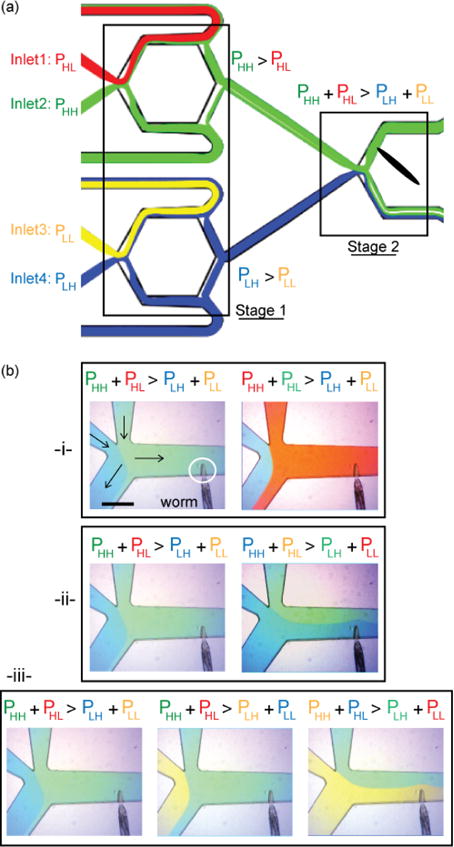
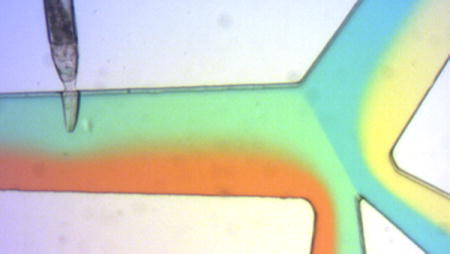
Switching chemicals without cross-contamination. (a) Operational state of the system leading to the selection of blue and green chemicals at Stage 1 and green chemical as final stimulus at Stage 2. (b) Pictures showing transitions (1) from green to red, (2) from green to blue, (3) from green to yellow. Switching from green to red or blue is achieved by directly switching green inlet pressure with the red one or the two couples (green-red) and (blue-yellow). Switching from green to yellow includes an additional step where blue is replaced with yellow before switching green and yellow.
Figure 3b shows a sequence of photographs of the device in operation with different dyes that clearly illustrate the transitions. In each case, the system starts in the state represented in Figure 3a, where green and blue chemicals are preselected at Stage 1 and green is chosen to stimulate the animal at Stage 2. Directly switching red and green inlet pressures leads to the selection of red (Fig. 3b(i)). Switching the pairwise pressures of the two selectors in Stage1 leads to the selection of blue as stimulus (Fig. 3b(ii)). Finally, switching from green to yellow is performed in two steps (Fig. 3b(iii)). In step one, pressures of blue and yellow inlets are switched so that yellow is selected at Stage 1 but green solution remains chosen as stimulus. In step two, the pressures of the two selectors in Stage1 are switched pairwise to select yellow as stimulus. By combining different sets of pressures in time, stimuli composed of any random sequence of chemicals can be created.
To deliver sequences of chemical stimuli, inlet pressures must be adjusted in a specific pattern. Performing a series of pressure adjustments at sub-second intervals would be impossible to do manually. To achieve the desired pressure profile at the temporal resolution required, we took advantage of motorized pressure controllers to automate series of pressure changes. To characterize the temporal resolution of the device, we performed a frequency analysis of the switching capability. We encoded each reagent with solutions of fluorescein at different concentrations: 0, 0.25, 0.5, and 1 mM, such that each chemical can be clearly identified via fluorescence imaging. We then applied the same sequence at different frequencies (0.4, 0.8, 1.5, 2.2, and 3.5 Hz) and monitored the intensity of a region of interest just upstream to the worm nose. The sequence was chosen to test every possible stimulus transition in the system. As the frequency increases, any fluidic system will reach a cut-off frequency beyond which the fidelity in signal delivery is compromised. Pulse length shorter than 75 % of the command was considered as a compromised signal. Figure 4 shows the output intensities for each driving frequency. At driving frequencies of 0.4, 0.8, and 1.5 Hz, chemical pulses were generated faithfully on command. At driving frequency of 2.2 Hz and higher, the waveforms were not entirely resolved. Thus, the cut-off frequency of the platform is 2 Hz, which demonstrates that the platform is capable of delivering sub-second multi-chemical stimuli on demand (see Supplemental Video 1).
Fig. 4.
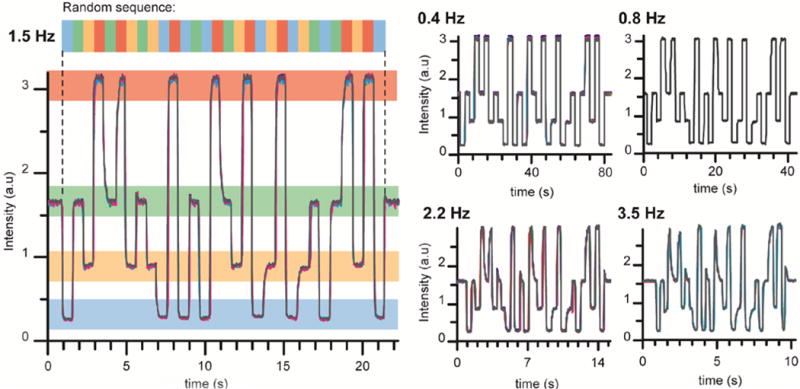
Frequency characterization. Left: A sequence of pressure commands was applied at 1.5 Hz to the chemical inlets. Each chemical is labeled with different concentrations of fluorescein. For visualization purposes, we represented each level of fluorescence corresponding to a different reagent with a different colour. The intensity is monitored in a region of interest located next to the animal’s nose. Right: Intensities collected for the same command of pressure sequence at different frequencies: 0.4, 0.8, 2.2, and 3.5 Hz.
In addition of allowing for fast stimulation, stimulus delivery must be reproducible. Because the stimulation sequence can be driven as fast as 2 Hz, jitter must be negligible compared to 500 ms. To demonstrate reproducibility of stimulus delivery, we quantified the jitter on a series of 50 identical pulses. The jitter was less than 35 ms, which is negligible for a signal driven at 2 Hz.
In order to interpret neuronal responses, it is essential to know the stimulus profile at the worm nose at any given time during the experiments. To do so, we monitored stimulus delivery using the fluorescein-labelling technique for the rest of the assays. Each chemical is mixed with a fluorescein solution of different concentration, allowing for clear identification of the nature of the stimulants and the duration of each pulse. To verify that the fluorescein solutions do not create any artefacts, we monitored the calcium responses of a strain expressing GCaMP in ASH chemosensory neuron (Fig. 5a). The flat response to the fluorescein-only solution indicates that ASH neuron is not stimulated by fluorescein (Fig. 5b). Therefore fluorescein solutions can be used to label the different stimulants while monitoring the animal’s neuronal activity.
Fig. 5.
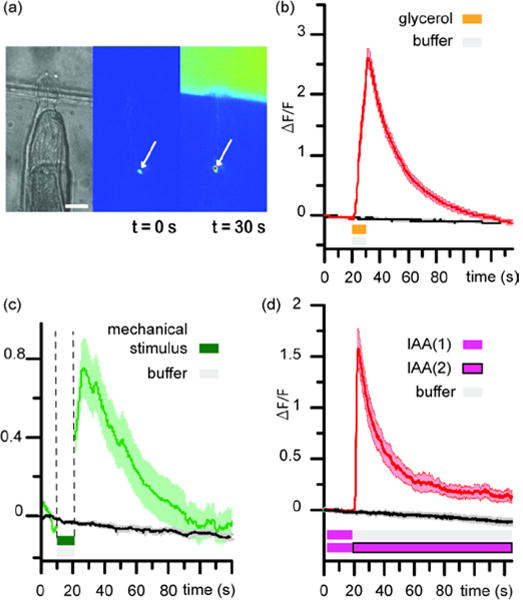
Control experiments demonstrating that no artefact is introduced during platform operation. (a) Photographs of an animal’s head trapped at the junction: bright-field (left), fluorescence imaging (middle and right). Baseline of ASH sensory neuron expressing GCaMP calcium reporter is visible in the middle photograph and upon stimulation with 1 M glycerol solution, ASH appears brighter (right). Scale bar is 25 μm. (b) Average calcium response of ASH upon stimulation with 1 M glycerol solution labeled with FITC at 1 mM concentration (red curve) or with S-basal buffer with FITC at 1 mM concentration (black curve). (c) Average calcium response of ASH upon buffer-buffer with FITC stimulation (black curve) and upon deliberate mechanical stimulation using a different device with on-chip valves (green curve). (d) Average response of AWC upon switch of 1 mM IAA to buffer (red curve) or a switch of 1 mM IAA to a separate stream of 1 mM IAA (black curve). Shaded area indicates SEM. n =10 for each assay.
Finally, one must ensure that the animal is only responding to chemical stimulation. In particular, mechanical perturbation is of concern because the chemical delivery system is based on pressure modulation. Mechanical perturbation is an important issue as many neurons are polymodal and are capable of detecting both chemical and mechanical cues. To avoid these mechanical perturbations, we designed the system so that the overall pressure balance is minimally changed during the operation. Therefore, any mechanical perturbations that do arise when switching chemicals should not be strong enough to induce a mechanical response in the animal. To validate our design, we performed control experiments on a strain expressing GCaMP in ASH neurons which are polymodal.31, 32 Figure 5c shows the average calcium response of ASH when switching between buffer and buffer-FITC-labeled solutions (black curve) and the average calcium response of ASH when mechanically stimulated using a different device specially designed to deliver mechanical stimulation (red curve).29 The presence of a large peak in the calcium transients upon mechanical stimulation informs on the typical response of ASH to a mechanical stimulus. In contrast, the absence of peak in the calcium transient when switching buffer to buffer indicates no mechanical stimulation was perceived by ASH sensory neuron. Controls were also performed on the AWC neurons to test for artefacts from mechanical perturbations (Figure 5d). Animals pre-exposed to IAA for 2 minutes display a large peak in average AWC calcium response upon the switch from 1 mM IAA to buffer (red curve). In comparison, animals pre-exposed IAA and then subjected to switch from 1 mM IAA to a separate stream of 1 mM IAA show negligible AWC response (black curve). We thus conclude that the platform can deliver chemical cues without stimulating the animals mechanically.
Neuronal functional imaging
To demonstrate the ability to monitor neuronal activity of C. elegans in response to multiple chemicals, we imaged a strain expressing GCaMP in ASH neuron while stimulating with a solution of 1 M glycerol 28 and a solution of 0.5 M NaCl.33 We characterized habituation for animals exposed to an alternation of pulses of glycerol and buffer, followed by an alternation of pulses of NaCl and buffer (Fig. 6 and Supplementary Video 2). Figure 6a shows the average calcium responses of ASH to alternations of glycerol and NaCl for 10 animals (red curve); single traces are represented in the raster plot below. We observed a clear response to glycerol stimulation with an average increase of ΔF/F ≈ 2.0 for the first and second peaks before a steady decrease with each subsequent stimulation, typical of habituation. Interestingly, when switching chemical cues from glycerol to NaCl, the neuronal response increased again, above the last response to glycerol pulse. Fig 6b (red bars) quantifies the peak values in ASH response to each stimulation in the glycerol-NaCl habituation experiment. There is a significant difference (p = 0.002, Wilcoxon-signed rank test) in the ASH response between the last pulse of glycerol (Peak #7) and the first pulse of NaCl (Peak #8), which is in agreement with previous studies.28 To further examine possible cross-habituation of the ASH response to glycerol and NaCl, we recorded the neuronal activity of ASH when exposed to buffer-buffer switches followed by alternating buffer and NaCl (Fig. 6a, blue curve). Regardless of prior stimulation history, the amplitude of the ASH response to the first NaCl pulse is similar (Fig. 6b). This result further demonstrates that habituation is stimulus-specific.
Fig. 6.
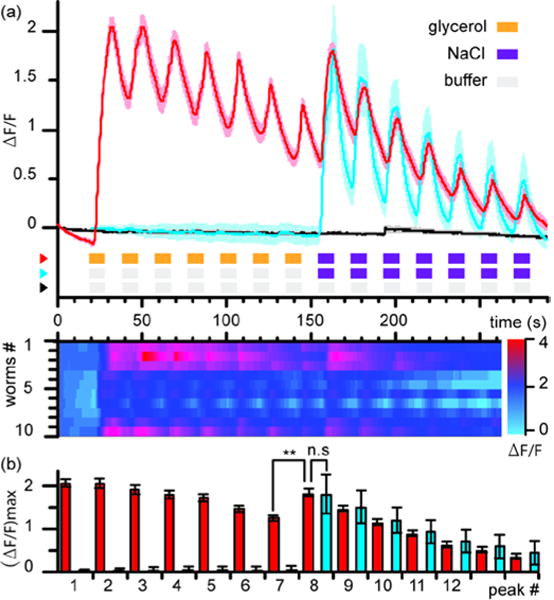
Neuronal activity of ASH upon multichemical stimulation with second-long pulses. (a) Top: Average calcium response upon repetitive stimulation with 1 M glycerol solution followed by repetitive stimulation with 0.5 M NaCl solution (red curve). Average response upon repetitive stimulation with buffer-buffer followed by repetitive stimulation with 0.5 M NaCl solution (blue curve). Average response upon repetitive stimulation with S-basal buffer (black curve). Shaded areas indicates SEM. Bottom: single traces for each animal for the glycerol-NaCl experiment. (b) Average peak value of calcium rises after each stimulus for the glycerol-NaCl experiment (red) or the buffer-NaCl control experiment (blue). Peak 7 and Peak 8 for the glycerol-NaCl experiment (red) show a significant difference (**, p = 0.002, Wilcoxon-signed rank test). n =10 for each assay.
We further investigated the utility of the platform by monitoring neuronal activity upon higher stimulation frequencies in two different assays. In the first assay, we monitored the neuronal activity of AWC chemosensory neuron in response to diverse ramping of concentrations of isoamyl alcohol (IAA). Figure 7a shows AWC responding to a repeating pattern of gradual concentrations (1 mM IAA, 10 μM IAA, 1 μM IAA, buffer; red sequence) at 1 Hz (red curve). The calcium signal shows habituation with a clear peak response to every cycle of stimulation. To emphasize how C. elegans can provide differentiated responses to fast stimuli, we stimulated the animals with a sequence of similar temporal pattern but replaced the pulses of solutions of intermediate concentrations of IAA with buffer (Fig. 7a, blue sequence). The animal experiences sharper transitions of concentrations. Compared to gradual stimulation, AWC displayed a faster decay in peak amplitude response, which became apparent after the fourth cycle (blue curve). This result highlights the potential utility of this platform for assays involving C. elegans sensory responses to gradients of odours.
Fig. 7.
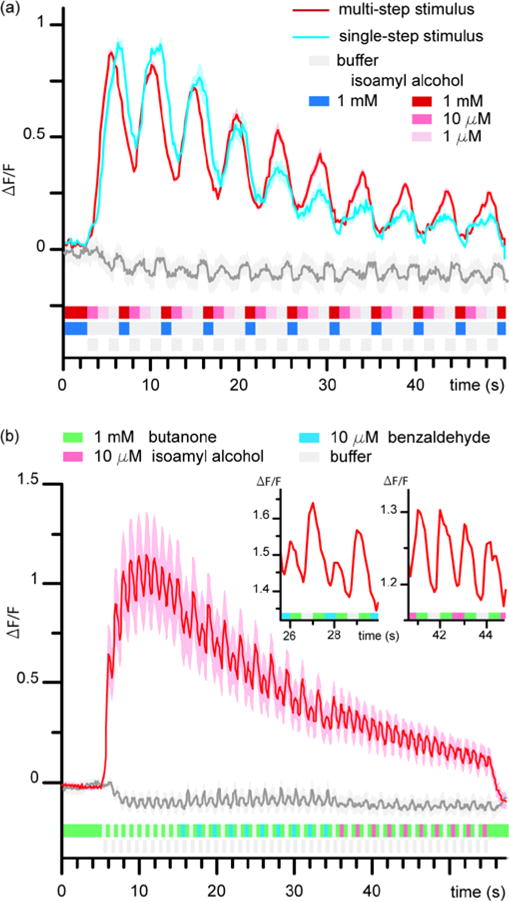
Neuronal activity of AWC neuron upon different stimuli patterns (a) Comparing AWC neuronal activity from binary switching of 1 mM isoamyl alcohol (IAA) to buffer (blue curve), a sequential stepping from 1 mM IAA, 10 μM IAA, 1 μM IAA, and buffer (red curve), and a buffer to buffer switching control (grey curve) at 1 Hz. (b) AWC Neuronal activity tracking multiple chemicals at 2 Hz. Alternation of butanone, benzaldehyde, IAA, and buffer shown in red curve, alternation of buffer to buffer shown in grey curve. n =10 for each assay.
Second, we demonstrated fast-switching capability of the platform and monitoring of neuronal activity in response to stimulation of multiple chemicals at sub-second resolution. Figure 7b shows the AWC neuron tracking rapid switches from butanone to IAA, benzaldehyde, and buffer at 2 Hz. Presence of peaks and dips in the signal amplitude shows ability for AWC to detect the different stimulants at sub-second temporal resolution. Such experiment would be impossible to carry out with other platforms because of their limited number of reagents or limited speed. Therefore, the previously unseen neuronal responses of AWC highlight the unique potential of our platform to study novel temporal properties of chemotactic responses to complex stimuli.
The assays that we performed on ASH and AWC chemosensory neurons demonstrate that the same platform can be used to monitor neuronal activity upon stimulation on various timescales, from sub-second to tens of seconds. That ability can be further exploited in the future for stimulating the same animal on different timescales. The versatility of the platform allows for stimulating C. elegans scanning different timescales sequentially, or delivering pulses of random lengths, or even presenting two signals of different frequencies simultaneously to the animal. A promising application that requires a wide range of temporal stimulation is the investigation of the dynamics of chemosensory circuits. Such an experiment requires not only large temporal dynamics but also multiple cues as chemosensory circuits often integrate signals from diverse chemosensory neurons. Previous platforms do not have the necessary attributes. In contrast, using our platform, one could screen neuronal responses from several hundred milliseconds to several ten seconds upon stimulation with multiple stimulants, and begin to understand the dynamics of complex circuitry.
In this work, we have demonstrated a device with four different inputs. The device enables assays that were not feasible before. In the current system, three chemicals can be tested (with the fourth inlet reserved for buffer), and any sequence of stimulants can be achieved without cross-contamination or the need to flow a buffer stream in-between. The latter feature is essential for decision-making assays that require control over stimulation and presentation of multiple stimulants. The platform could be applied to look at the neuronal activity corresponding to a wide variety of chemosensory-triggered behaviours such as food searching, mating, avoidance of pathogenic cues, and olfactory learning. Therefore, the unique abilities of the platform that combine speed and a choice of multiple stimulants opens a whole new set of applications. We note here that additional stages can be added to increase the number of stimulants if experimental need calls for such a change.
Conclusions
We developed a microfluidic platform for stimulating C. elegans with sequences of up to four chemicals at sub-second resolution while monitoring neuronal activity. A network composed of multiple flow routers can be dynamically reconfigured by modulating the inlet pressures to select one chemical. Channel geometry was optimized to allow for sub-second switching of chemicals and automation of pressure control enabled the creation of complex stimuli sequences in a reliable manner. This platform will enable the interrogating of neuronal dynamics in response to complex stimulus patterns, which better approximates the type of chemical exposure an animal would experience in the wild. In particular, we envision this platform can be utilized to probe the dynamics of a population of sensory neurons as well as interneurons that can be comprehensively recorded. While we designed the platform to minimise mechanical perturbation of the animal, we recognise that additional mechanical stimulation modules could be desirable in some instances. Our platform could easily be modified to incorporate a mechanical stimulus. Allowing dual interrogation of different sensory modalities would further expand our understanding of the integration of multimodal stimuli by interneurons.
Supplementary Material
Acknowledgments
The authors acknowledge National Institute of Health (NIH R01GM108962, NIH R21 EB021676) for funding.
Footnotes
Electronic Supplementary Information (ESI) available: movies. See DOI: 10.1039/x0xx00000x
Conflict of interest
The authors declare no conflict of interest.
References
- 1.Sengupta P, Samuel ADT. Curr Opin Neurobiol. 2009;19:637–643. doi: 10.1016/j.conb.2009.09.009. [DOI] [PMC free article] [PubMed] [Google Scholar]
- 2.Lindy AS, Parekh PK, Zhu R, Kanju P, Chintapalli SV, Tsvilovskyy V, Patterson RL, Anishkin A, van Rossum DB, Liedtke WB. Nat Commun. 2014;5 doi: 10.1038/ncomms5734. [DOI] [PMC free article] [PubMed] [Google Scholar]
- 3.McGrath PT, Xu YF, Ailion M, Garrison JL, Butcher RA, Bargmann CI. Nature. 2011;477:321–U392. doi: 10.1038/nature10378. [DOI] [PMC free article] [PubMed] [Google Scholar]
- 4.Zimmer M, Gray JM, Pokala N, Chang AJ, Karow DS, Marletta MA, Hudson ML, Morton DB, Chronis N, Bargmann CI. Neuron. 2009;61:865–879. doi: 10.1016/j.neuron.2009.02.013. [DOI] [PMC free article] [PubMed] [Google Scholar]
- 5.Li G, Gong J, Lei H, Liu J, Xu XZS. Nat Commun. 2016;7 doi: 10.1038/ncomms13234. [DOI] [PMC free article] [PubMed] [Google Scholar]
- 6.Yoshida K, Hirotsu T, Tagawa T, Oda S, Wakabayashi T, Iino Y, Ishihara T. Nat Commun. 2012;3 doi: 10.1038/ncomms1750. [DOI] [PubMed] [Google Scholar]
- 7.Kunitomo H, Sato H, Iwata R, Satoh Y, Ohno H, Yamada K, Iino Y. Nat Commun. 2013;4 doi: 10.1038/ncomms3210. [DOI] [PubMed] [Google Scholar]
- 8.Leinwand SG, Yang CJ, Bazopoulou D, Chronis N, Srinivasan J, Chalasani SH. Elife. 2015;4 doi: 10.7554/eLife.10181. [DOI] [PMC free article] [PubMed] [Google Scholar]
- 9.Narayan A, Venkatachalam V, Durak O, Reilly DK, Bose N, Schroeder FC, Samuel ADT, Srinivasan J, Sternberg PW. P Natl Acad Sci USA. 2016;113:E1392–E1401. doi: 10.1073/pnas.1600786113. [DOI] [PMC free article] [PubMed] [Google Scholar]
- 10.Chalasani SH, Chronis N, Tsunozaki M, Gray JM, Ramot D, Goodman MB, Bargmann CI. Nature. 2007;450:63–70. doi: 10.1038/nature06292. [DOI] [PubMed] [Google Scholar]
- 11.Hendricks M, Ha H, Maffey N, Zhang Y. Nature. 2012;487:99–103. doi: 10.1038/nature11081. [DOI] [PMC free article] [PubMed] [Google Scholar]
- 12.Cho JY, Sternberg PW. Cell. 2014;156:249–260. doi: 10.1016/j.cell.2013.11.036. [DOI] [PMC free article] [PubMed] [Google Scholar]
- 13.Guo M, Wu TH, Song YX, Ge MH, Su CM, Niu WP, Li LL, Xu ZJ, Ge CL, Al-Mhanawi MTH, Wu SP, Wu ZX. Nat Commun. 2015;6 doi: 10.1038/ncomms6655. [DOI] [PubMed] [Google Scholar]
- 14.Gordus A, Pokala N, Levy S, Flavell SW, Bargmann CI. Cell. 2015;161:215–227. doi: 10.1016/j.cell.2015.02.018. [DOI] [PMC free article] [PubMed] [Google Scholar]
- 15.Fenk L, deBono M. P Natl Acad Sci USA. 2017;114:4195–4200. doi: 10.1073/pnas.1618934114. [DOI] [PMC free article] [PubMed] [Google Scholar]
- 16.Kato S, Xu YF, Cho CE, Abbott LF, Bargmann CI. Neuron. 2014;81:616–628. doi: 10.1016/j.neuron.2013.11.020. [DOI] [PMC free article] [PubMed] [Google Scholar]
- 17.Pierce-Shimomura JT, Morse TM, Lockery SR. J Neurosci. 1999;19:9557–9569. doi: 10.1523/JNEUROSCI.19-21-09557.1999. [DOI] [PMC free article] [PubMed] [Google Scholar]
- 18.Izquierdo EJ, Lockery SR. J Neurosci. 2010;30:12908–12917. doi: 10.1523/JNEUROSCI.2606-10.2010. [DOI] [PMC free article] [PubMed] [Google Scholar]
- 19.Chingozha L, Zhan M, Zhu C, Lu H. Anal Chem. 2014;86:10138–10147. doi: 10.1021/ac5019843. [DOI] [PMC free article] [PubMed] [Google Scholar]
- 20.He LY, Kniss A, San-Miguel A, Rouse T, Kemp ML, Lu H. Lab Chip. 2015;15:1497–1507. doi: 10.1039/c4lc01070a. [DOI] [PMC free article] [PubMed] [Google Scholar]
- 21.Piehler A, Ghorshian N, Zhang C, Tay S. Lab Chip. 2017;17:2218–2224. doi: 10.1039/c7lc00531h. [DOI] [PMC free article] [PubMed] [Google Scholar]
- 22.Candelier R, Murmu MS, Romano SA, Jouary A, Debregeas G, Sumbre G. Sci Rep-Uk. 2015;5:1–10. doi: 10.1038/srep12196. [DOI] [PMC free article] [PubMed] [Google Scholar]
- 23.Chronis N, Zimmer M, Bargmann CI. Nat Methods. 2007;4:727–731. doi: 10.1038/nmeth1075. [DOI] [PubMed] [Google Scholar]
- 24.Wang JJ, Feng XJ, Du W, Liu BF. Anal Chim Acta. 2011;701:23–28. doi: 10.1016/j.aca.2011.06.007. [DOI] [PubMed] [Google Scholar]
- 25.Chalasani SH, Kato S, Albrecht DR, Nakagawa T, Abbott LF, Bargmann CI. Nat Neurosci. 2010;13:615–U130. doi: 10.1038/nn.2526. [DOI] [PMC free article] [PubMed] [Google Scholar]
- 26.Duffy DC, McDonald JC, Schueller OJA, Whitesides GM. Anal Chem. 1998;70:4974–4984. doi: 10.1021/ac980656z. [DOI] [PubMed] [Google Scholar]
- 27.Brenner S. Genetics. 1974;77:71–94. doi: 10.1093/genetics/77.1.71. [DOI] [PMC free article] [PubMed] [Google Scholar]
- 28.Hilliard MA, Apicella AJ, Kerr R, Suzuki H, Bazzicalupo P, Schafer WR. Embo J. 2005;24:63–72. doi: 10.1038/sj.emboj.7600493. [DOI] [PMC free article] [PubMed] [Google Scholar]
- 29.Cho YM, Porto DA, Hwang H, Grundy LJ, Schafer WR, Lu H. Lab Chip. 2017;17:2609–2618. doi: 10.1039/c7lc00465f. [DOI] [PMC free article] [PubMed] [Google Scholar]
- 30.Haddadi H, Di Carlo D. J Fluid Mech. 2017;811:436–467. [Google Scholar]
- 31.Bargmann CI. In: WormBook. T.C.e.R Community, WormBook, editor. 2006. ch. Chemosensation in C. elegans. [DOI] [Google Scholar]
- 32.Goodman MB. In: WormBook. e T C e R Community, editor. 2006. DOI: doi/10.1895/wormbook.1.62.1, ch. Mechanosensation. [Google Scholar]
- 33.Chatzigeorgiou M, Bang S, Hwang SW, Schafer WR. Nature. 2013;494:95–99. doi: 10.1038/nature11845. [DOI] [PMC free article] [PubMed] [Google Scholar]
Associated Data
This section collects any data citations, data availability statements, or supplementary materials included in this article.