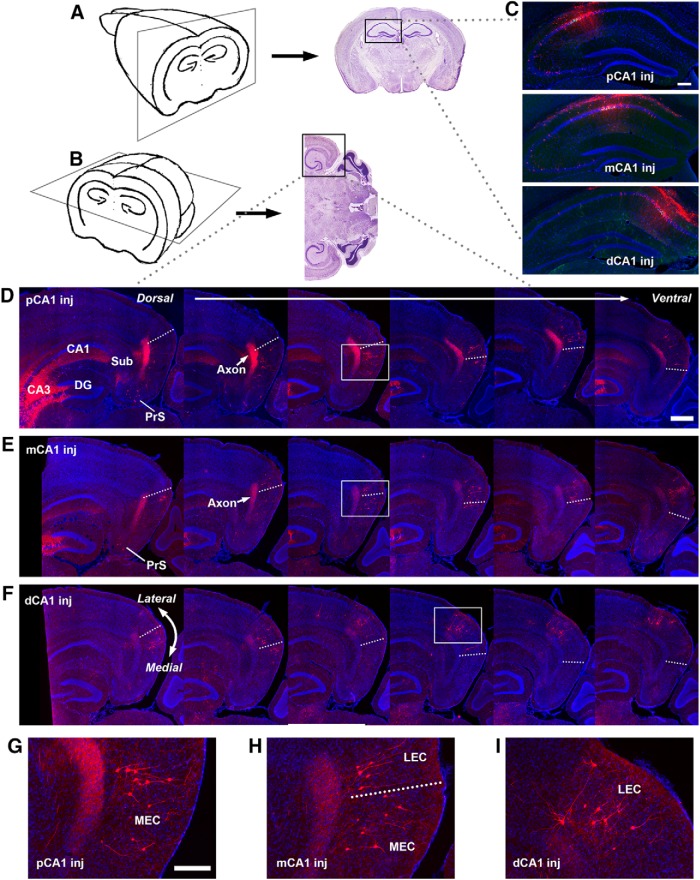
Figure 2.
Topographic organization of lateral and medial entorhinal cortex inputs to different CA1 subfields. A, B, Schematic illustration of the combined coronal/horizontal sectioning approach. The rostral portion of the brain was sectioned in the coronal plane to identify the injection site in CA1 (A), while the caudal portion was sectioned in the horizontal plane to delineate lateral versus medial EC (B). C, Example injection sites in proximal CA1 (pCA1), intermediate CA1 (mCA1), and distal CA1 (dCA1), respectively. Scale bar = 200 μm. D–F, Retrogradely labeled EC neurons following rabies tracing in proximal CA1 (D), intermediate CA1 (E), and distal CA1 (F), respectively. Images from the left to right are organized from the dorsal to ventral. Rabies-labeled neurons are red. DAPI staining is blue. The arrow points to the prominent axons terminating in the deeper layers of the entorhinal cortex. These axons likely come from rabies-infected cells around the injection site in CA1. Dashed lines indicate the MEC and LEC border. The scale bar (500 μm) applies to all the other panels. G, Enlarged image of the white box region in D. H, Enlarged image of the white box region in E. I, Enlarged image of the white box region in F. The scale bar (200 μm) applies to G–I.

