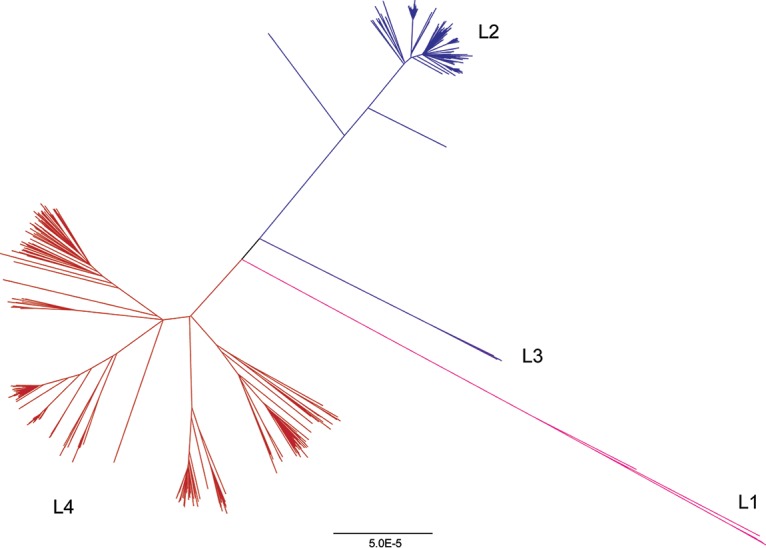
FIG 1 .

Phylogeny of Mycobacterium tuberculosis sample. The phylogeny was inferred using FastTree (60). Lineages are colored as follows: lineage 1 (L1) is shown in pink, lineage 2 (L2) in blue, lineage 3 (L3) in purple, and lineage 4 (L4) in red. Lineage 4 is associated with deeper branching sublineages in comparison with lineage 2. Bar, 5.0E−5 (5.0 × 10⁻⁵) nucleotide substitutions per position.
