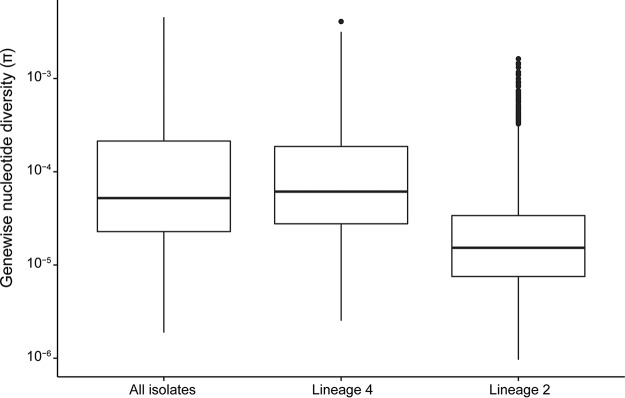
FIG 2 .
Distributions of gene-wise nucleotide diversity for all isolates, as well as lineages 4 and 2 considered separately. Repetitive regions of the alignment were masked. Sites were included in estimation of π if 95% of isolates in the alignment had a valid nucleotide at the position. We used Egglib to calculate statistics (64). The nucleotide diversity is lower in lineage 2 than in lineage 4 (P < 2.2 × 10⁻¹⁶ by Welch two-sample t test).

