

ABSTRACT
Chlamydia trachomatis is an obligate intracellular bacterial pathogen that causes blinding trachoma and sexually transmitted disease. C. trachomatis isolates are classified into 2 biovars—lymphogranuloma venereum (LGV) and trachoma—which are distinguished biologically by their natural host cell infection tropism. LGV biovars infect macrophages and are invasive, whereas trachoma biovars infect oculo-urogenital epithelial cells and are noninvasive. The C. trachomatis plasmid is an important virulence factor in the pathogenesis of these infections. Central to its pathogenic role is the transcriptional regulatory function of the plasmid protein Pgp4, which regulates the expression of plasmid and chromosomal virulence genes. As many gene regulatory functions are post-transcriptional, we employed a comparative proteomic study of cells infected with plasmid-cured C. trachomatis serovars A and D (trachoma biovar), a L2 serovar (LGV biovar), and the L2 serovar transformed with a plasmid containing a nonsense mutation in pgp4 to more completely elucidate the effects of the plasmid on chlamydial infection biology. Our results show that the Pgp4-dependent elevations in the levels of Pgp3 and a conserved core set of chromosomally encoded proteins are remarkably similar for serovars within both C. trachomatis biovars. Conversely, we found a plasmid-dependent, Pgp4-independent, negative regulation in the expression of the chlamydial protease-like activity factor (CPAF) for the L2 serovar but not the A and D serovars. The molecular mechanism of plasmid-dependent negative regulation of CPAF expression in the LGV serovar is not understood but is likely important to understanding its macrophage infection tropism and invasive infection nature.
KEYWORDS: Chlamydia trachomatis, plasmid, proteomics, virulence factors
IMPORTANCE
The Chlamydia trachomatis plasmid is an important virulence factor in the pathogenesis of chlamydial infection. It is known that plasmid protein 4 (Pgp4) functions in the transcriptional regulation of the plasmid virulence protein 3 (Pgp3) and multiple chromosomal loci of unknown function. Since many gene regulatory functions can be post-transcriptional, we undertook a comparative proteomic analysis to better understand the plasmid’s role in chlamydial and host protein expression. We report that Pgp4 is a potent and specific master positive regulator of a common core of plasmid and chromosomal virulence genes shared by multiple C. trachomatis serovars. Notably, we show that the plasmid is a negative regulator of the expression of the chlamydial virulence factor CPAF. The plasmid regulation of CPAF is independent of Pgp4 and restricted to a C. trachomatis macrophage-tropic strain. These findings are important because they define a previously unknown role for the plasmid in the pathophysiology of invasive chlamydial infection.
INTRODUCTION
Chlamydia trachomatis is an obligate intracellular bacterial pathogen of humans that causes blinding trachoma and sexually transmitted disease, both of which afflict hundreds of millions of people globally (1, 2). C. trachomatis isolates are classified into 2 biovars—lymphogranuloma venereum (LGV) and trachoma—which are distinguished biologically by their host cell infection tropism. Macrophages and monocytes are the natural host for LGV biovars, whereas trachoma biovars infect oculo-urogenital epithelial cells (3). These distinct host cell infection tropisms produce invasive and noninvasive infections, respectively.
The chlamydial plasmid is an important virulence factor in both murine and nonhuman primate models of infection (4–9). Plasmid-deficient organisms produce highly attenuated infections characterized by decreased organism loads of shorter duration that spontaneously resolve with reduced or no post-infection pathology. The C. trachomatis plasmid is highly conserved and carries eight open reading frames (ORFs) (4, 10). All eight ORFs, designated Pgp1 to -8, are expressed in infected cells (11). Putative functions for several ORFs have been assigned based on homology to known proteins in the public databases. These are Pgp1, which is a DnaB-like helicase, Pgp7 and -8, which are integrase/recombinase homologues, and Pgp5, which is a homologue of plasmid-partitioning protein ParA. Pgp2 and -6 are chlamydia-specific proteins, showing little or no homology to proteins in the public databases. Pgp3 is highly conserved among chlamydiae and exits naturally as a homotrimer (12) that is secreted into the host cytosol of infected cells (13). The trimeric form is highly immunogenic (13) and is thought to function by neutralizing host antimicrobial peptides (14). Immunization with DNA expressing Pgp3 (15) or recombinant Pgp3 trimer (16) provides partial protection against chlamydial infection in mice. Lastly, a pgp3 null mutant is attenuated for mice, demonstrating its importance to chlamydial pathogenicity (17).
Transcriptional studies, comparing plasmid-positive and -negative C. trachomatis L2 isolates, have shown that the plasmid regulates the expression of several chromosomal loci; the most highly regulated genes include those coding for glycogen synthase, the Pmp-like proteins CT049 to -051, and putative type 3 secretion effectors CT142 to -144 (18). Importantly, the change in chromosomal gene expression in plasmid-free isolates could be reproduced by deletion of pgp4, indicating that Pgp4 is largely responsible for the plasmid-mediated regulation of chromosomal gene expression (18). In addition, these transcriptional studies indicated that Pgp4 also regulates the expression of Pgp3 (18).
To increase our understanding of Pgp4 gene regulation, we have employed a comparative proteomic approach using C. trachomatis plasmid-positive strains, plasmid-negative strains, and a strain with an inactivating single nucleotide polymorphism (SNP) mutation in pgp4. Our proteomic findings clearly show Pgp4 alone is responsible for the tight regulatory control of Pgp3 and a select core set of chromosomal genes. Moreover, the results implicate a hereto unrecognized role for the plasmid in the negative regulation of expression of CPAF (chlamydial protease-like activity factor), a documented chlamydial virulence factor. Notably, the plasmid-dependent negative regulation of CPAF was limited to an LGV biovar, implicating this function in macrophage infection tropism and invasive infection.
RESULTS
Comparative proteomic analysis of chlamydial proteins from L2 plasmid-positive and -negative infected HeLa cells.
HeLa cells were infected with plasmid-positive L2 (here referred to as L2 P+) and mutant plasmid-negative L2R (here referred to as L2 P−) at a multiplicity of infection (MOI) of 3. Infected cells were harvested at 30 h post-infection (hpi), and lysates were prepared for mass spectrometry (MS). Lysates were labeled equivalently with tandem mass tags (TMTs) and analyzed by nanoscale liquid chromatography-tandem mass spectrometry (nano-LC-MS/MS). A total of 752 chlamydial proteins were identified (see Table S1 in the supplemental material). Employing a ≥2-fold change in mean log2-normalized intensity across four replicates and an adjusted P value of ≤0.05 from differential expression testing revealed altered expression of a limited number of proteins in L2 P+ compared to L2 P− (Fig. 1A). Protein identification was matched to the C. trachomatis serovar D UW-3 gene locus identification for ease of identification (19, 20). The corresponding gene locus homologues in the other C. trachomatis serovars discussed in this study are summarized in Table 1. As expected, all plasmid proteins, except for Pgp7, which carries a natural inactivating mutation on the L2 plasmid (21, 22), were detected and downregulated in L2 P− (Fig. 1A).
FIG 1 .

Comparison of chlamydial protein expression between plasmid-positive and plasmid-negative L2 strains. Volcano plots show differential protein expression between infections with L2 P+ and P− (A) and L2 P+ and P− complement (B) at 30 hpi. The x axis represents the log2 fold change, and the y axis represents the −log10 Benjamini-Hochberg adjusted P value. Dashed vertical yellow lines represent 2-fold changes. Larger values on the y axis denote stronger significance level. Proteins with significant differential expression are denoted in red and the nonsignificant ones in blue. Names of the significant proteins with greater than 2-fold changes (in either direction) are labeled.
TABLE 1 .
Summary of plasmid-regulated chlamydial chromosomal locia
| Genus locus tag for: |
Protein functione |
Sequence variabilityf |
||
|---|---|---|---|---|
|
C. trachomatis
A2497b |
C. trachomatis
D/UW-3/CXc |
C. trachomatis
L2/434/Bud |
||
| CTO_0053 | CT_049 | CTL0305 | Pmp-like | High |
| CTO_0054 | CT_050 | CTL0306 | Pmp-like | High |
| CTO_0055 | CT_051 | CTL0307 | Pmp-like | High |
| CTO_0151 | CT_142 | CTL0397 | Putative T3SE | Low |
| CTO_0152 | CT_143 | CTL0398 | Putative T3SE | Low |
| CTO_0153 | CT_144 | CTL0399 | Putative T3SE | Medium |
| CTO_0447 | CT_412 | CTL0669 | PmpA adhesin | Low |
| CTO_0763 | CT_702 | CTL0071 | Conserved hypothetical | Low |
| CTO_0869 | CT_798 | CTL0167 | Glycogen synthase | Low |
Loci with 2-fold or greater downregulation in plasmid-negative strains are shown.
GenBank accession no. NC_017437.1.
GenBank accession no. AE001273.1.
GenBank accession no. NC_010287.1.
Protein function based on sequence homology or proven activity.
Chlamydial interserovar protein sequence variability as determined by BLASTP search.
Differential chlamydial protein expression following infection of HeLa cells. Differentially expressed proteins for chlamydiae are reported for group pair comparison in each tab (group 1 versus group 2). Full normalized protein expression of identified proteins and the significant results are reported for each strain in tabs within the table for chlamydial proteins. Download TABLE S1, XLSX file, 1.3 MB (1.4MB, xlsx) .
This is a work of the U.S. Government and is not subject to copyright protection in the United States. Foreign copyrights may apply.
Consistent with the glycogen-negative phenotype associated with plasmid-negative strains (5, 23–25), there was reduced expression of glycogen synthase (CT798) in L2 P−. Other proteins showing decreased expression in L2 P− were CT049 to -051 (polymorphic outer membrane protein [Pmp]-like proteins) (26), CT142 to -144 (chlamydia-specific hypothetical proteins) (27, 28), CT702 (hypothetical) (19), and CT412 (PmpA) (19). Importantly, the genes corresponding to these proteins were also found to be the most significantly downregulated genes transcriptionally in C. trachomatis L2 P− compared to P+ (5, 18). A single gene (CT858) encoding the chlamydial protease-like activity factor (CPAF) (29) was found to be significantly upregulated in L2 P−-infected cells.
We used genetic complementation to validate the specificity of our proteomic findings between L2 P+- and P−-infected cells. This was done by transforming L2 P− organisms with a recombinant L2 plasmid (18) (designated L2 P− complement) and doing a proteomic comparison of L2 P+ and L2 P− complemented organisms. The results shown in Fig. 1B and Table S1 clearly demonstrate that the decreased expression of L2 P− proteins described above is reversed following plasmid transformation. As expected, β-lactamase was detected as upregulated in the L2 P−-complemented strain as it is the selectable marker on the recombinant L2 plasmid. We also found the CT649 gene, encoding formyltetrahydrofolate synthetase, to be upregulated following complementation. The significance of this is unknown. The increased expression of CPAF was reversed by complementation.
To determine if the plasmid-regulated proteins identified in L2 were similarly regulated in other C. trachomatis serovars, we performed a proteomic comparison of serovars D P+ and P− and A P+ and P− (Table S1). A global view of the samples using chlamydial protein expression shows the strong similarity of the replicates for each condition, as indicated by the hierarchical clustering on the heat map (Fig. 2A). As shown in the C. trachomatis L2 Volcano plots (Fig. 1A), the proteins CT798, CT049 to -051, and CT142 to -144 are also plasmid regulated in C. trachomatis serovars A and D (Fig. 2B and C). We did not see expression changes in CT702 or CPAF. This result suggests that these proteins are more specifically plasmid regulated in L2. CT412 (PmpA) showed a statistically significant change (1.28-fold, P = 0.0042) in serovar A but not D. Interestingly, we did see small but statistically significant alterations in the expression in the majority of the nine Pmps, and some Pmp changes were serovar specific (Table 2). The interpretation of this data is complicated by the fact that Pmp expression is phase variable (30); thus, it is difficult to distinguish if the small changes seen result from plasmid regulation, phase variation, or both. Taken together, we conclude that CT798, CT049 to -051, and CT142 to -144 are the “core set” of plasmid-regulated proteins among C. trachomatis serovars.
FIG 2 .

Pearson 1 analysis and comparison of chlamydial protein expression in plasmid-positive and plasmid-negative C. trachomatis serovars L2, A, and D. A heat map shows the sample distances as measured by Pearson 1 correlation using the protein expression patterns. The rows and columns represent each MS/MS sample replicate infection by a strain in the same order. Red denotes strong similarity, whereas blue denotes lower similarity between each sample pair (A). Volcano plots show differential protein expression between DP+ and P− infections at 42 hpi (B) and AP+ and P− infections at 42 hpi (C). The x axis represents the log2 fold change, and the y axis represents the −log10 Benjamini-Hochberg adjusted P value. Dashed vertical yellow lines represent 2-fold changes. Larger values in the y axis denote a stronger significance level. Proteins with significant differential expression are denoted in red and the nonsignificant ones in blue. Protein names of the significant proteins with greater than 2-fold changes (in either direction) are labeled.
TABLE 2 .
Summary of changes in polymorphic outer membrane protein expression between P+ and P− serovars
| Pmpa |
C. trachomatis L2/434/Bub |
C. trachomatis A2497b |
C. trachomatis D/UW-3/CXb |
|||
|---|---|---|---|---|---|---|
| Fold change |
Adjusted P value |
Fold change |
Adjusted P value |
Fold change |
Adjusted P value |
|
| A | 2.25 | 1.60E−9 | 1.28 | 4.2E10−3 | 1.23 | 0.11 |
| B | 0.92 | 5.0E−4 | 1.01 | 0.76 | 1.02 | 0.67 |
| C | 1.24 | 3.8E−10 | 1.06 | 0.39 | 1.20 | 1.2E10−3 |
| D | 1.35 | 3.1E−13 | 1.03 | 0.47 | 1.11 | 0.04 |
| E | 1.03 | 0.139 | 1.00 | 0.99 | 1.03 | 0.65 |
| F | 0.99 | 0.885 | 0.99 | 0.97 | 1.04 | 0.52 |
| G | 0.93 | 1.9E10−4 | 1.01 | 0.73 | 1.03 | 0.58 |
| H | 0.95 | 4.8E10−3 | 0.99 | 0.99 | 1.02 | 0.64 |
| I | 1.22 | 8.5E10−9 | 1.06 | 0.15 | 1.08 | 0.05 |
Polymorphic outer membrane protein as identified by mass spectrometry.
Fold change and adjusted P values taken from data in Table S1.
In previous studies, we used plasmid gene deletion mutants (pgp1 to -8) to study the gene specificity of plasmid transcriptional regulation (18). We found that pgp4 was the primary plasmid gene that regulated transcription of pgp3 and the plasmid-regulated chromosomal loci. However, the use of the plasmid gene deletion mutants for transcriptional and proteomics studies is potentially confounded by the fact that the deletions can remove noncoding small RNAs (sRNAs) known to be encoded on the plasmid (10, 31, 32). As chromosomal sRNAs are known to regulate expression of chlamydial proteins (33, 34) we reasoned it was possible that the plasmid sRNA might similarly function in the regulation of protein expression. Moreover, it is likely that deletion mutations in plasmid genes that are cotranscribed can affect the expression of the downstream gene. Thus, the observed changes in protein profiles between P+, P−, and pgp4 null strains may result from alterations in multiple plasmid regulators. To minimize the chance that sRNA expression would be altered or eliminated in the pgp4 mutant, we used a pgp4 SNP nonsense mutant, specifically A37T introducing a stop codon early in pgp4, for comparative proteomic studies. The pgp4 SNP proteome results showed that in addition to Pgp4, Pgp3, CT798, CT702, CT049 to -051, and CT142 to -144 were downregulated (Fig. 3). This result supports the conclusion that the aforementioned plasmid-regulated proteins are directly and tightly regulated by Pgp4. Of note, the upregulation of CT858 (CPAF) was reversed in the L2 complement strain and in the pgp4 SNP mutant, implicating that its expression could be regulated by plasmid components other than Pgp4 (Fig. 1B and 3).
FIG 3 .
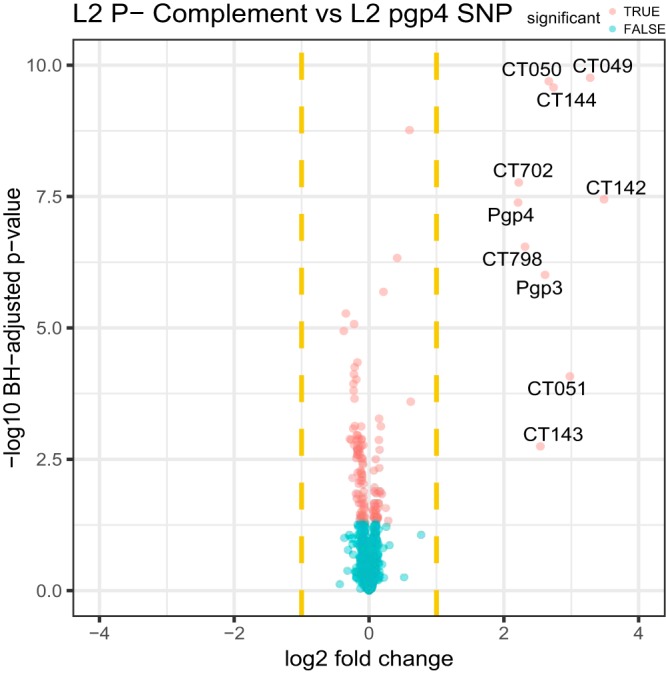
Comparison of chlamydial protein expression between L2 P− complement and pgp4 SNP L2 strains. Volcano plots show differential expression between P− complement and pgp4 SNP. The x axis represents the log2 fold change, and the y axis represents the −log10 Benjamini-Hochberg adjusted P value. Dashed vertical yellow lines represent 2-fold changes. Larger values in the y axis denote a stronger significance level. Proteins with significant differential expression are denoted in red and the nonsignificant ones in blue. Names of the significant proteins with greater than 2-fold changes (in either direction) are labeled.
Western blot.
To validate our proteomics findings, we performed Western blotting using infected HeLa cell lysates from L2 P+, P−, P− complement, and pgp4 SNP strains (Fig. 4A). Monoclonal antibodies (MAbs) specific to Pgp3, CT142, CT143, CT144, and OmpA were used to detect plasmid-regulated proteins. The Western blot results validate and support our proteomic findings. Moreover, the results show that Pgp4 is a master regulator of these genes and their regulation is remarkably tight. Interestingly, in contrast to the downregulation seen for Pgp4-regulated proteins, the proteome data showed an increased level of CPAF expression in the absence of plasmid. Western blots were performed using monoclonal antibodies specific to CPAF and chlamydial 60-kDa heat shock protein (HSP60) to validate the proteomic results. Anti-HSP60 was used as a protein loading standard among lysates. In agreement with the proteomics findings, Western blotting showed an increased level of CPAF expression in the absence of plasmid (Fig. 4B). Importantly, unlike the Pgp4-dependent decreased expression of Ppg3 and chromosomally encoded proteins, the regulation of CPAF expression was plasmid dependent but Pgp4 independent. The L2 P−-complemented strain showed a greater decrease in CPAF expression than the L2 P+ strain, consistent with the fact that plasmid-complemented strains have increased plasmid copy numbers (17). The regulation of CPAF expression was not as tight as the Pgp4-regulated loci. Collectively these data support the conclusion that CPAF expression is regulated by the plasmid but by a mechanism different from the Pgp4-regulated loci.
FIG 4 .

Western blot of plasmid-regulated proteins in C. trachomatis L2-infected HeLa cells. (A) Western blot of L2 P+-, L2 P−-, L2 P− complement-, pgp4 SNP-, and mock-infected HeLa 229 cells at 30 hpi probed with anti-Pgp3, anti-CT142, anti-CT143, anti-CT144, anti-MOMP, and anti-β-actin. (B) Western blot of cells infected with L2 P+, L2 P−, and pgp4 SNP probed with anti-CPAFc (clone 100a) and chlamydial anti-HSP60 MAbs. The gel was spliced to remove an irrelevant lane.
Immunostaining.
Indirect fluorescence antibody (IFA) microscopy was performed with MAbs against CT143 and CT144 to assess the location and relative abundance of the Pgp4-regulated proteins. In agreement with our proteomic and Western blot findings, we observed inclusion staining of CT143 and CT144 in cells infected with L2 P+ and L2 P− complement strains but not with P− or pgp4 SNP strains. CT143 and CT144 staining was restricted to the inclusion lumen and produced an atypical globular staining profile. The staining density of CT143 and CT144 was significantly less than that of OmpA (Fig. 5A and B). Staining patterns varied, ranging from small punctate particles to larger particles with outer membrane-like morphologies. Similar staining patterns have been reported by others for CT143 (28) and for plasmid-regulated chromosomal loci CT049 and CT50 (26). It is not understood why plasmid-regulated proteins exhibit atypical inclusion staining properties. In summary, our findings are in complete agreement with previous transcriptomic analyses (5, 18, 23) and the current proteomic study showing that Pgp4 is the primary master regulator of Pgp3 and chromosomal gene loci (18).
FIG 5 .

Indirect immunofluorescence staining of CT143 and CT144 in HeLa cells infected with L2 P+, P−, P−-complemented, and SNP mutants. (A) Airyscan confocal slices (0.2 µm) of L2 P+-, P−-, P− complement-, and L2 pgp4 SNP-infected HeLa 229 cells at 30 hpi stained with DAPI (blue), anti-MOMP (green), and anti-CT143 (red) antibodies (A). CT143 staining was recorded in the P+ and P− complement infections, with a marked reduction in signal in the L2 pgp4 SNP and no discernible signal in the L2 P− infections. (B) Airyscan confocal slices (0.2 µm) of L2 P+-, P−-, P− complement-, and L2 pgp4 SNP-infected HeLa 229 cells at 30 hpi stained with DAPI (blue), anti-MOMP (green), and anti-CT144 (red) antibodies (B). CT144 staining was observed in the P+ and P− complement infections, with a marked reduction in signal in the L2 pgp4 SNP and no discernible signal in the L2 P− infections. Scale bars equal 10 µm.
Impact of the chlamydial plasmid on host protein expression.
Being an obligate intracellular pathogen, chlamydiae have evolved intricate networks for interacting with their host cell. For example, successful survival requires that chlamydiae dispense with a myriad of host-induced antimicrobial effectors (35). While it is well established in various animal model systems that plasmid-negative isolates are attenuated (4), the precise molecular mechanisms underlying the attenuated phenotype is unknown. As an initial experiment, we determined the host response to infection by comparing C. trachomatis L2 P+-infected HeLa cells to mock-infected cells (see Table 2 in the supplemental material). In total, 7,548 host proteins were detected. There was a robust host response to C. trachomatis L2 P+ infection. Employing a ≥2-fold change in mean log2-normalized intensity and an adjusted P value of ≤0.05 across four replicates resulted in 221 and 48 host proteins up- and downregulated, respectively (Fig. 6A). We employed Gene Ontology (GO) enrichment analysis using the DAVID resource (36) to functionally profile up- and downregulated genes in response to P+ infection (Fig. 6B). Upregulated proteins in chlamydia-infected cells compared to mock-infected cells were enriched with host defense response proteins such as interferons, NF-κB, and small GTPase signaling and major histocompatibility complex (MHC) class I antigen processing and presentation pathways. Proteins associated with DNA replication, cell cycle progression, and transcription were downregulated in P+-infected cells compared to mock-infected cells.
FIG 6 .

Differential expression of human proteins between C. trachomatis L2 plasmid-bearing and mock-infected cells and between plasmid-bearing and plasmid-negative infected Cells. Volcano plots show comparisons between L2 P+ and mock (A) and between L2 P+ and L2 P− (C). The x axis represents the log2 fold change, and the y axis represents the −log10 Benjamini-Hochberg adjusted P value. Dashed vertical yellow lines represent 2-fold changes. (D) Gene Ontology (GO) functional enrichment of differentially expressed proteins between P+ and mock (B) and P+ and P− samples. The y axis lists the GO biological process terms significantly enriched in either significantly upregulated or downregulated proteins. Terms with more than 90% protein overlap are reduced for visualization purposes. The x axis represents the significance of functional enrichment (FDR) as reported by DAVID. Bar color indicates whether the GO term is more enriched in upregulated (higher expression in P+) or downregulated (higher expression in mock for panel B or P− for panel D) proteins.
A direct comparison between P+ and P− C. trachomatis L2-infected cells enabled us to assess the effect the plasmid has on host response to infection. In general, the difference in host responses was quite minimal (Fig. 6C). Although there were numerous proteins differentially up- and downregulated, as assessed by statistical significance (P ≤ 0.05), only one was greater than 2-fold: tissue-type plasminogen activator (TPA_HUMAN). Gene Ontology enrichment analysis of statistically significant up- and downregulated proteins was performed (Fig. 6D). This analysis showed enrichment of proteins associated with host inflammatory and defense response upregulated in cells infected with L2 P+ compared to L2 P−, findings consistent with previous host transcriptional studies of L2 P+- and P−-infected cells (37). Downregulated proteins included those involved in extracellular matrix organization and disassembly and cell adhesion. These results show that although chlamydial infection significantly induces a plethora of host cell responses, the chlamydial plasmid does not appear to have a large impact in this regard.
DISCUSSION
Results from our proteomics experiments support and extend the conclusions of C. trachomatis transcriptional studies on the role of the plasmid and Pgp4 in regulating the expression of pgp3 and several chromosomal loci, including those of the glycogen synthase, the Pmp-like proteins CT049 to -051, and the putative type 3 secretion effectors CT142 to -144 (5, 18). Comparative proteomic analysis of plasmid-positive and -negative C. trachomatis serovars A and D indicate that while the number of plasmid-regulated proteins is reduced compared to L2, the glycogen synthase, CT049 to -051, and CT142 to -144 loci remain highly regulated chromosomal loci in these serovars. We consider the genes coding for these proteins to be the core set of plasmid-regulated chromosomal loci in C. trachomatis. Results from Western blotting and IFA experiments indicate that the levels of expression of both plasmid (Pgp3) and chromosomal (CT142 and -143) proteins are highly Pgp4 dependent and the regulation is extremely tight. The mechanism responsible for Pgp4’s positive regulation of transcription remains to be elucidated.
The positive regulatory effects of Pgp4 were conserved among all C. trachomatis serovars. In contrast, there was a clear plasmid-dependent, but Pgp4-independent, downregulation of expression of CPAF that was specific to the L2 serovar. Unlike the tight regulation of CT142 to -144 and Pgp3 expression shown by Pgp4, the effects of the plasmid on the expression of CPAF are less pronounced. The level of CPAF mRNA was not altered in previous C. trachomatis L2 transcriptional studies comparing a plasmid-positive strain and a pgp4 deletion mutant (18). This implies the plasmid-dependent Pgp4-independent alterations in CPAF expression are regulated post-transcriptionally and are biologically linked to macrophage infection tropism and invasive infections.
In addition to the eight ORFs, the C. trachomatis plasmid also carries several small RNAs (sRNAs) (4, 10, 31, 32). Bacterial sRNAs are accepted as the major post-transcriptional regulators involved in key processes such as virulence, quorum sensing, survival, plasmid maintenance, and primary and secondary metabolism (38–40). Recent studies indicate that sRNAs can both repress and activate translation (38).
There is precedent for sRNA regulation of gene expression in chlamydiae. Grieshaber et al. showed that the expression of the DNA condensing elementary body (EB)-specific histone-like protein Hc1 is regulated by a transacting sRNA (34). In addition, they showed that the inhibition of HctA translation by lhtA is a conserved function across chlamydiae (33). Intriguingly, in addition to HctA, lhtA also regulates the expression of CTL0322 (CT066) a highly conserved chlamydia-specific hypothetical protein (41). Transcriptional studies indicate that the two primary plasmid antisense sRNAs, sRNA-2 and sRNA-7, encoded within pgp8 and pgp5, respectively, are highly expressed (32, 42). Furthermore, there are biovar-specific differences in the level of expression of the eight ORFs and sRNAs (42). While the precise regulatory role of the abundant plasmid-encoded sRNAs in chlamydiae remains to be elucidated, it has been suggested that sRNA-2 regulates expression of components besides pgp8 (4). It has recently been reported that the expression of the serine protease subtilisin is sRNA regulated in Bacillus (43). In addition to the possibility that sRNAs play a role in downregulating CPAF, it has been shown that Pgp5 selectively suppresses the expression of plasmid-dependent genes (44). Clearly more work, such as targeted loss-of-function mutations in the various plasmid sRNAs and pgp5, needs to be done to determine the precise mechanism behind plasmid regulation of CPAF expression in C. trachomatis L2.
Given that CPAF is a critical virulence factor; its plasmid-dependent regulation is intriguing. CPAF is conserved among all serovars, so why would LGV strains regulate CPAF expression differently than non-LGV strains? As discussed above, LGV biovars express significantly higher levels (12- to 100-fold) of sRNA-2 and sRNA-7 than trachoma biovars (42). This increased sRNA expression would intuitively result in a more profound negative regulation of CPAF. LGV strains naturally infect macrophages not epithelial cells (3). Macrophages have a well-characterized family of pattern recognition receptors (PRRs) that activate the inflammasome and exhibit antibacterial activities (45). A possible explanation is CPAF, or CPAF proteolytically modified type 3 secretion system (T3SS) effector(s) (46), might function as pathogen-associated molecular pattern (PAMP) ligands that engage cytosolic PRR pathways in macrophages, which may be absent or expressed at a lower level in nonphagocytic cells. It is therefore reasonable to propose that LGV strains evolved a unique plasmid sRNA regulatory mechanism to avoid PRRs that activate the inflammasome in a macrophage host as a survival mechanism. This pathogenic strategy would not be expected to function in non-LGV strains as they are epithelial cell tropic and do not naturally infect macrophages. Consistent with this hypothesis are the findings of Webster et al. (47), who showed that the LGV strain expressing CPAF is required for activation of the inflammasome in macrophages. This LGV-specific CPAF function could be a pathogenic characteristic shared with other more conserved CPAF functions common to all chlamydiae that have been described using epithelial cells as a model, which involve the inhibition of antimicrobial peptides (48) and p65 nuclear translocation that suppresses the production of proinflammatory cytokines (46).
A key factor in Pgp4 regulation of chlamydial virulence is no doubt its ability to tightly regulate the expression of Pgp3. By Western blot, there was limited Pgp3 detectable in both plasmidless isolates and the pgp4 SNP mutant. Immunolocalization studies indicate that Pgp3 is detectable in the cytosol of chlamydia-infected cells; Pgp3 is an outer membrane protein (13) and is one of the few chlamydial virulence factors that has been characterized biochemically and shown to be important to chlamydial pathogenesis in animal models (4). Although Pgp3 has been shown to neutralize host antimicrobial peptides (14), it is likely to confer additional functions important to chlamydial pathogenesis that remain to be defined.
The association between plasmid and the ability to deposit glycogen in the chlamydial inclusion has been known for many years (3, 25), and the glycogen-negative phenotype is often used as marker to screen for plasmid-cured isolates. In all three plasmidless C. trachomatis serovars tested, glycogen synthase expression is highly downregulated. The decreased expression of glycogen synthase, the penultimate enzyme in the glycogen synthesis pathway, can explain the glycogen-negative phenotype.
Less is known about Pmp-like CT049 to -051 and putative type 3-secreted CT142 to -144. The CT049 to -051 genes are divergently expressed; thus it is likely Pgp4 regulates each of their expressions independently. CT049 and CT050 lack classical Sec-dependent secretion signals, and it has been proposed that they are secreted into the inclusion lumen by a novel mechanism to regulate events important for chlamydial replication and inclusion expansion (26). While the Pgp4-regulated expression of these proteins is conserved, there is substantial sequence variation for all three proteins between C. trachomatis serovars. Thus, these Pmp-like proteins are either under immune selection or have evolved strain-specific virulence functions.
CT142 to -144 are encoded in an operon (28). It has been suggested that CT142, -143, and -144 might form a protein complex (28). In contrast to CT049 to -051, CT142 and CT143 are highly conserved among C. trachomatis isolates. While the precise function of these proteins is currently unknown, the fact that they are all localized to the inclusion lumen (28) brings up the intriguing possibility that their absence could be responsible for the atypical “donut” inclusion morphology associated with plasmidless C. trachomatis isolates.
In keeping with transcriptional studies (37, 49), our proteomic data show a substantial host reaction to chlamydial infection. In response to infection with plasmid containing C. trachomatis L2, there were 221 and 48 host genes up- and downregulated with ≥2-fold change, respectively. An overrepresented Gene Ontology (GO) term for all differentially expressed host proteins with annotation reveals a wide variety of functions. Upregulated proteins are those generally categorized as host response to infection, and downregulated proteins are associated with DNA replication and RNA processing. These findings are consistent with our current understanding of chlamydia-host cell interactions (50). Notably however, the host proteomic profiles of cells infected with L2 P+ and L2 P− were similar, implying that the plasmid has little effect on host response to infection. GO enrichment analysis of statistically significant up- and downregulated proteins showed enrichment of proteins associated with host inflammatory and defense response as upregulated and those involved in extracellular matrix organization as downregulated when cells were infected with P+ compared to P− isolates. These findings are in general agreement with previous host transcriptional studies of P+- and P−-infected cells (37). More importantly, these findings are consistent with P− isolates being attenuated in animal models (4, 5, 7) and displaying altered plaque formation and host cell lysis in vitro (4, 5, 24, 51).
In conclusion, we employed a comparative proteomics approach, using HeLa cells infected with different plasmid-cured C. trachomatis serovars and the L2 serovar transformed with a plasmid containing a nonsense mutation in pgp4, to elucidate the effects of the plasmid on both the chlamydial and host proteome. Our results indicate that Pgp4 exhibits tight regulation over Pgp3, glycogen synthase, and a conserved set of Chlamydia-specific hypothetical proteins. In addition, we show that there is plasmid-dependent Pgp4-independent regulation of CPAF expression and suggest that this regulation could be dependent on plasmid-encoded sRNAs. Finally, while chlamydial infection has a substantial impact on the host proteome, the plasmid has a limited role in this response.
MATERIALS AND METHODS
Chlamydiae.
C. trachomatis strains were grown in low-passage-number (n < 15) HeLa 229 cells using high-glucose-containing Dulbecco’s modified Eagle’s medium supplemented with 10% fetal bovine serum (DMEM-10), 2 mM l-glutamine, 1 mM HEPES, 1 mM sodium pyruvate, 0.055 mM β-mercaptoethanol, and 10 µg/ml gentamicin at 37°C with 5% CO2. The plasmid-bearing (P+) and plasmid-deficient (P−) C. trachomatis serovars A and D were made as previously described (7). The plasmid-deficient L2 25667R strain (L2R) (5, 52), L2 P− complement, L2 pgp3 SNP, and L2 pgp4 SNP were made as previously described (18, 51). Chlamydiae were purified by density gradient purification as previously described (53).
Proteomic sample preparation.
HeLa cells grown in 6-well tissue culture (TC) plates (2 × 10⁶ cells/well) were infected in quadruplicate with L2 P+, L2 P−, L2 P− complement, L2 pgp3 SNP, and L2 pgp4 SNP strains in sucrose-phosphate-glutamic acid (SPG) medium with a mock SPG-only control and rocked for 1.5 h at 37C° in a 5% CO2 humidified atmosphere. Infections with C. trachomatis serovars AP+, AP−, DP+, and DP− were performed in triplicate in 150-cm2 TC flasks (3 × 10⁷ cells/flask) and rocked for 1.5 h at 37°C in a 5% CO2 humidified atmosphere. All infected and mock-infected cells were refed with DMEM-10 at 1.5 h post-infection (hpi). A multiplicity of infection (MOI) of 3 was used to ensure that monolayers had >95% infection. At 30 hpi (L2 and L2 mutants) and 42 hpi (A strain and D strain), medium was aspirated, and cells were washed once with warm Hanks balanced salt solution (HBSS). Cells were treated with 250 µl of hot (~100°C) 2% SDS in 50 mM HEPES buffer (pH 8.2), immediately boiled for 10 min, and frozen at −80°C.
Mass spectrometry and differential protein expression data analysis.
We used three technical replicates for each condition for serovars A and D and 4 replicates for serovar L2. Mascot search was conducted on all MS/MS samples against the Homo sapiens sequences from Swiss-Prot, Chlamydia trachomatis sequences from serovars D (19), A (7), and L2 (21) with a fragment ion mass tolerance of 0.50 Da and a parent ion tolerance of 10.0 ppm. Carbamidomethyl of cysteine and TMT6plex of lysine and the N terminus were specified in Mascot as fixed modifications and oxidation of methionine as a variable modification. Scaffold Q+ (version Scaffold_4.7.3; Proteome Software, Inc.) was used for label-based quantitation of TMT peptide and protein identifications. Peptide identifications were accepted at a false-discovery rate (FDR) of <0.1%. Protein identifications were accepted at less than <1.0 and with at least 2 identified peptides. Protein probabilities were assigned by the Protein Prophet algorithm (54). Proteins that contained similar peptides and could not be differentiated based on MS/MS analysis alone were grouped. Proteins sharing significant peptide evidence were grouped into clusters. Channels were corrected in all samples according to the algorithm described in i-Tracker (55). Normalization was performed iteratively (across samples and spectra) on intensities, as previously described (56). Medians were used for averaging. Spectrum data were log2 transformed, pruned of those matched to multiple proteins, and weighted by an adaptive intensity weighting algorithm. Additional filtering was done to remove proteins with any 0 entries. To account for proportions of chlamydiae within host cells, an additional cyclic LOWESS normalization (57) was done separately for chlamydial and human proteins and was chosen as the approach resulting in the highest reduction in coefficient of variation distribution compared to median, scale, quantile, and variance stabilizing normalization approaches. Differential expression analysis on log2-normalized intensity was conducted using Linear Models for Microarray Data (LIMMA) in R with a multigroup comparison design (58, 59). To correct for multiple hypothesis testing, the P values for each pairwise comparison were adjusted using the Benjamini-Hochberg method (60). Proteins with adjusted P values of ≤0.05 were considered statistically significant, while an additional criterion of 2-fold change was used to highlight potential biological importance.
Bioinformatics analyses.
To enable the comparison between three serovars, pairwise BLASTP was done using the amino acid sequences for each pair of serovars to identify protein pairs (20). The BLOSUM45 scoring matrix was used, and proteins that have >80% identity and are one-to-one were paired. Eighty percent identity was selected from examining the distribution of the percentage of identity of conducting BLASTP against the same serovar. Functional enrichment of Gene Ontology terms was tested using the DAVID resource (36) by comparing significantly upregulated or downregulated human proteins (adjusted P values of ≤0.05) to all human proteins identified from the mass spectrometry data. The Benjamini-Hochberg (60) adjusted P values from the GO enrichment test were reported to account for multiple hypothesis testing. The GO enrichment plot was generated with modified R scripts from the GO plot R package for biological process terms (61).
MAb production.
CT142, CT143, and CT144 from C. trachomatis serovar D were cloned into pET27b (Novagene). The pET27b constructs were made by inserting the PCR amplicons of the CT142, CT143, or CT144 ORFs into the EcoRI and SalI sites. The following forward primers were used: CT142 (5′-GGCCGGGAATTCGATGAGTGATTCTGACAAAATTATTAATG-3′), CT143 (5′-GGCCGGGAATTCGATGAAGAAACCAGTATTTACAGGGGGAGC-3′), and CT144 (5′-GGCCGGGAATTCATGACAACGCCAGATAATAATACTATTGATG-3′). The following reverse primers were used: CT142 (5′-GGCCGGGTCGACTCCTCCTATCTCTGGGTATACGAGCACTCC-3′), CT143 (5′-GGCCGGGTCGACATCTGCCTCCTTATAAGAAGAACCAAAAGG-5′), and CT144 (5′-GGCCGGGTCGACAGGAACAACAGGTAGCCGAACCACACTCC-3′).
The cloned ORFs were expressed as fusion proteins with a C-terminal His tag. Expression of the fusion proteins was induced with isopropyl-β-d-thiogalactoside for 2 to 3 h during mid-log growth. Fusion proteins were extracted by lysing the bacteria with a French press in Triton X-100 lysis buffer (1% Triton X-100, 1 mM phenylmethylsulfonyl fluoride, 75 U/ml aprotinin, 20 μM leupeptin, and 1.6 μM pepstatin). After high-speed centrifugation to remove debris, the fusion protein-containing supernatants were passed over His GraviTrap columns (GE Healthcare Life Sciences), and the purified proteins were used to immunize mice for production of monoclonal antibodies (MAbs) (62).
Immunofluorescence.
HeLa cells grown on coverslips (2 × 10⁵ cells/coverslip) were infected with L2 P+, L2 P−, L2 P−-complemented, L2 pgp3 SNP, and L2 pgp4 SNP at a multiplicity of infection (MOI) of 3. Infected cells were fixed at 30 hpi with 100% cold methanol for 10 min and incubated with rabbit or mouse anti-major outer membrane protein (anti-MOMP), anti-Pgp3, anti-CT143, or anti-CT144. Coverslips were washed with 1× phosphate-buffered saline (PBS), incubated with DAPI (4′,6-diamidino-2-phenylindole) or Alexa Fluor 488 or 555 secondary antibodies, mounted using ProLong Gold, and imaged by confocal microscopy. Images were collected with a 63× 1.4-numerical aperture (NA) oil objective on a Zeiss LSM 880 laser scanning microscope with an Airyscan detector. z-stacks were collected at 0.2-µm intervals (n = 25 slices) and compiled as confocal projection images. All images were processed in Zen Blue and Zen Black (Carl Zeiss Imaging, Inc.).
Western blotting.
The mock-infected and C. trachomatis-infected lysates used were the same as those processed for proteomics. Protein concentration was determined by the bicinchoninic acid (BCA) assay (Pierce) and then diluted into Laemmli sample buffer (50 mM Tris-HCl [pH 6.8], 10% glycerol, 2% SDS, 1% 2-mercaptoethanol, 0.1% bromophenol blue). Samples of equivalent protein load were resolved at 120 V for 1.5 h in 10% Criterion TGX stain-free protein gels (Bio-Rad no. 5678033). Proteins were transferred onto polyvinylidene difluoride (PVDF) membranes and 0.2-µm PVDF membranes at 2.5 A for 7 min with the semidry apparatus (Bio-Rad). Membranes were subsequently blocked with 5% (wt/vol) skim milk and Tris-buffered saline with Tween 20 (TBST; 50 mM Tris, 150 mM NaCl, 0.05% Tween 20, pH 7.4) and probed with primary antibodies. The chlamydial primary MAbs were anti-CT142, anti-CT143, anti-CT144, anti-Pgp3, anti-OmpA, anti-CPAF clone 100a, and anti-HSP60. Human primary antibody was anti-β-actin (Cell Signaling no. 4970S). Appropriate secondary horseradish peroxidase- or alkaline phosphate-conjugated anti-mouse, anti-rabbit antibodies were used to detect immune complexes (Life Technologies, Inc.). Protein bands were developed and visualized on the Bio-Rad ChemiDoc Imaging System.
Differential HeLa cell protein expression following infection with P+ and P− chlamydiae. Differentially expressed proteins for host HeLa cell are reported for group pair comparison in each tab (group 1 versus group 2). Full normalized protein expression of identified proteins and the significant results are reported for each strain in tabs within the table for human proteins. Where no differentially expressed proteins were found between two groups, no differential expression tab is reported. Download TABLE S2, XLSX file, 15 MB (15.3MB, xlsx) .
This is a work of the U.S. Government and is not subject to copyright protection in the United States. Foreign copyrights may apply.
ACKNOWLEDGMENTS
We thank Guangming Zhong and Lihua Song for the generous contribution of chlamydial CPAF and Pgp3 monoclonal antibodies, respectively.
This work was supported by the Intramural Research Program of the National Institute of Allergy and Infectious Diseases, National Institutes of Health, and the Public Health Agency of Canada.
Footnotes
Citation Patton MJ, Chen C-Y, Yang C, McCorrister S, Grant C, Westmacott G, Yuan X-Y, Ochoa E, Fariss R, Whitmire WM, Carlson JH, Caldwell HD, McClarty G. 2018. Plasmid negative regulation of CPAF expression is Pgp4 independent and restricted to invasive Chlamydia trachomatis biovars. mBio 9:e02164-17. https://doi.org/10.1128/mBio.02164-17.
Contributor Information
Raphael Valdivia, Duke University.
Alan G. Barbour, University of California, Irvine.
REFERENCES
- 1.O’Connell CM, Ferone ME. 2016. Chlamydia trachomatis genital infections. Microb Cell 3:390–403. [DOI] [PMC free article] [PubMed] [Google Scholar]
- 2.Mohammadpour M, Abrishami M, Masoumi A, Hashemi H. 2016. Trachoma: past, present and future. J Curr Ophthalmol 28:165–169. doi: 10.1016/j.joco.2016.08.011. [DOI] [PMC free article] [PubMed] [Google Scholar]
- 3.Moulder JW. 1991. Interaction of chlamydiae and host cells in vitro. Microbiol Rev 55:143–190. [DOI] [PMC free article] [PubMed] [Google Scholar]
- 4.Zhong G. 2017. Chlamydial plasmid-dependent pathogenicity. Trends Microbiol 25:141–152. doi: 10.1016/j.tim.2016.09.006. [DOI] [PMC free article] [PubMed] [Google Scholar]
- 5.Carlson JH, Whitmire WM, Crane DD, Wicke L, Virtaneva K, Sturdevant DE, Kupko JJ, Porcella SF, Martinez-Orengo N, Heinzen RA, Kari L, Caldwell HD. 2008. The Chlamydia trachomatis plasmid is a transcriptional regulator of chromosomal genes and a virulence factor. Infect Immun 76:2273–2283. doi: 10.1128/IAI.00102-08. [DOI] [PMC free article] [PubMed] [Google Scholar]
- 6.Ramsey KH, Schripsema JH, Smith BJ, Wang Y, Jham BC, O’Hagan KP, Thomson NR, Murthy AK, Skilton RJ, Chu P, Clarke IN. 2014. Plasmid CDS5 influences infectivity and virulence in a mouse model of Chlamydia trachomatis urogenital infection. Infect Immun 82:3341–3349. doi: 10.1128/IAI.01795-14. [DOI] [PMC free article] [PubMed] [Google Scholar]
- 7.Kari L, Whitmire WM, Olivares-Zavaleta N, Goheen MM, Taylor LD, Carlson JH, Sturdevant GL, Lu C, Bakios LE, Randall LB, Parnell MJ, Zhong G, Caldwell HD. 2011. A live-attenuated chlamydial vaccine protects against trachoma in nonhuman primates. J Exp Med 208:2217–2223. doi: 10.1084/jem.20111266. [DOI] [PMC free article] [PubMed] [Google Scholar]
- 8.O’Connell CM, Ingalls RR, Andrews CW, Scurlock AM, Darville T. 2007. Plasmid-deficient Chlamydia muridarum fail to induce immune pathology and protect against oviduct disease. J Immunol 179:4027–4034. doi: 10.4049/jimmunol.179.6.4027. [DOI] [PubMed] [Google Scholar]
- 9.Lei L, Chen J, Hou S, Ding Y, Yang Z, Zeng H, Baseman J, Zhong G. 2014. Reduced live organism recovery and lack of hydrosalpinx in mice infected with plasmid-free Chlamydia muridarum. Infect Immun 82:983–992. doi: 10.1128/IAI.01543-13. [DOI] [PMC free article] [PubMed] [Google Scholar]
- 10.Fahr MJ, Sriprakash KS, Hatch TP. 1992. Convergent and overlapping transcripts of the Chlamydia trachomatis 7.5-kb plasmid. Plasmid 28:247–257. doi: 10.1016/0147-619X(92)90056-G. [DOI] [PubMed] [Google Scholar]
- 11.Gong S, Yang Z, Lei L, Shen L, Zhong G. 2013. Characterization of Chlamydia trachomatis plasmid-encoded open reading frames. J Bacteriol 195:3819–3826. doi: 10.1128/JB.00511-13. [DOI] [PMC free article] [PubMed] [Google Scholar]
- 12.Galaleldeen A, Taylor AB, Chen D, Schuermann JP, Holloway SP, Hou S, Gong S, Zhong G, Hart PJ. 2013. Structure of the Chlamydia trachomatis immunodominant antigen Pgp3. J Biol Chem 288:22068–22079. doi: 10.1074/jbc.M113.475012. [DOI] [PMC free article] [PubMed] [Google Scholar]
- 13.Li Z, Chen D, Zhong Y, Wang S, Zhong G. 2008. The chlamydial plasmid-encoded protein Pgp3 is secreted into the cytosol of Chlamydia-infected cells. Infect Immun 76:3415–3428. doi: 10.1128/IAI.01377-07. [DOI] [PMC free article] [PubMed] [Google Scholar]
- 14.Hou S, Dong X, Yang Z, Li Z, Liu Q, Zhong G. 2015. Chlamydial plasmid-encoded virulence factor Pgp3 neutralizes the antichlamydial activity of human cathelicidin LL-37. Infect Immun 83:4701–4709. doi: 10.1128/IAI.00746-15. [DOI] [PMC free article] [PubMed] [Google Scholar]
- 15.Donati M, Sambri V, Comanducci M, Di Leo K, Storni E, Giacani L, Ratti G, Cevenini R. 2003. DNA immunization with pgp3 gene of Chlamydia trachomatis inhibits the spread of chlamydial infection from the lower to the upper genital tract in C3H/HeN mice. Vaccine 21:1089–1093. doi: 10.1016/S0264-410X(02)00631-X. [DOI] [PubMed] [Google Scholar]
- 16.Chen D, Lei L, Lu C, Galaleldeen A, Hart PJ, Zhong G. 2010. Characterization of Pgp3, a Chlamydia trachomatis plasmid-encoded immunodominant antigen. J Bacteriol 192:6017–6024. doi: 10.1128/JB.00847-10. [DOI] [PMC free article] [PubMed] [Google Scholar]
- 17.Liu Y, Huang Y, Yang Z, Sun Y, Gong S, Hou S, Chen C, Li Z, Liu Q, Wu Y, Baseman J, Zhong G. 2014. Plasmid-encoded Pgp3 is a major virulence factor for Chlamydia muridarum to induce hydrosalpinx in mice. Infect Immun 82:5327–5335. doi: 10.1128/IAI.02576-14. [DOI] [PMC free article] [PubMed] [Google Scholar]
- 18.Song L, Carlson JH, Whitmire WM, Kari L, Virtaneva K, Sturdevant DE, Watkins H, Zhou B, Sturdevant GL, Porcella SF, McClarty G, Caldwell HD. 2013. Chlamydia trachomatis plasmid-encoded Pgp4 is a transcriptional regulator of virulence-associated genes. Infect Immun 81:636–644. doi: 10.1128/IAI.01305-12. [DOI] [PMC free article] [PubMed] [Google Scholar]
- 19.Stephens RS, Kalman S, Lammel C, Fan J, Marathe R, Aravind L, Mitchell W, Olinger L, Tatusov RL, Zhao Q, Koonin EV, Davis RW. 1998. Genome sequence of an obligate intracellular pathogen of humans: Chlamydia trachomatis. Science 282:754–759. doi: 10.1126/science.282.5389.754. [DOI] [PubMed] [Google Scholar]
- 20.Altschul SF, Madden TL, Schäffer AA, Zhang J, Zhang Z, Miller W, Lipman DJ. 1997. Gapped BLAST and PSI-BLAST: a new generation of protein database search programs. Nucleic Acids Res 25:3389–3402. doi: 10.1093/nar/25.17.3389. [DOI] [PMC free article] [PubMed] [Google Scholar]
- 21.Thomson NR, Holden MT, Carder C, Lennard N, Lockey SJ, Marsh P, Skipp P, O’Connor CD, Goodhead I, Norbertzcak H, Harris B, Ormond D, Rance R, Quail MA, Parkhill J, Stephens RS, Clarke IN. 2008. Chlamydia trachomatis: genome sequence analysis of lymphogranuloma venereum isolates. Genome Res 18:161–171. doi: 10.1101/gr.7020108. [DOI] [PMC free article] [PubMed] [Google Scholar]
- 22.Comanducci M, Ricci S, Cevenini R, Ratti G. 1990. Diversity of the Chlamydia trachomatis common plasmid in biovars with different pathogenicity. Plasmid 23:149–154. doi: 10.1016/0147-619X(90)90034-A. [DOI] [PubMed] [Google Scholar]
- 23.O’Connell CM, AbdelRahman YM, Green E, Darville HK, Saira K, Smith B, Darville T, Scurlock AM, Meyer CR, Belland RJ. 2011. Toll-like receptor 2 activation by Chlamydia trachomatis is plasmid dependent, and plasmid-responsive chromosomal loci are coordinately regulated in response to glucose limitation by C. trachomatis but not by C. muridarum. Infect Immun 79:1044–1056. doi: 10.1128/IAI.01118-10. [DOI] [PMC free article] [PubMed] [Google Scholar]
- 24.O’Connell CM, Nicks KM. 2006. A plasmid-cured Chlamydia muridarum strain displays altered plaque morphology and reduced infectivity in cell culture. Microbiology 152:1601–1607. doi: 10.1099/mic.0.28658-0. [DOI] [PubMed] [Google Scholar]
- 25.Matsumoto A, Izutsu H, Miyashita N, Ohuchi M. 1998. Plaque formation by and plaque cloning of Chlamydia trachomatis biovar trachoma. J Clin Microbiol 36:3013–3019. [DOI] [PMC free article] [PubMed] [Google Scholar]
- 26.Jorgensen I, Valdivia RH. 2008. Pmp-like proteins Pls1 and Pls2 are secreted into the lumen of the Chlamydia trachomatis inclusion. Infect Immun 76:3940–3950. doi: 10.1128/IAI.00632-08. [DOI] [PMC free article] [PubMed] [Google Scholar]
- 27.da Cunha M, Milho C, Almeida F, Pais SV, Borges V, Maurício R, Borrego MJ, Gomes JP, Mota LJ. 2014. Identification of type III secretion substrates of Chlamydia trachomatis using Yersinia enterocolitica as a heterologous system. BMC Microbiol 14:40. doi: 10.1186/1471-2180-14-40. [DOI] [PMC free article] [PubMed] [Google Scholar]
- 28.da Cunha M, Pais SV, Bugalhão JN, Mota LJ. 2017. The Chlamydia trachomatis type III secretion substrates CT142, CT143, and CT144 are secreted into the lumen of the inclusion. PLoS One 12:e01788567. doi: 10.1371/journal.pone.0178856. [DOI] [PMC free article] [PubMed] [Google Scholar]
- 29.Zhong G, Fan P, Ji H, Dong F, Huang Y. 2001. Identification of a chlamydial protease-like activity factor responsible for the degradation of host transcription factors. J Exp Med 193:935–942. doi: 10.1084/jem.193.8.935. [DOI] [PMC free article] [PubMed] [Google Scholar]
- 30.Tan C, Hsia RC, Shou H, Carrasco JA, Rank RG, Bavoil PM. 2010. Variable expression of surface-exposed polymorphic membrane proteins in in vitro-grown Chlamydia trachomatis. Cell Microbiol 12:174–187. doi: 10.1111/j.1462-5822.2009.01389.x. [DOI] [PMC free article] [PubMed] [Google Scholar]
- 31.Abdelrahman YM, Rose LA, Belland RJ. 2011. Developmental expression of non-coding RNAs in Chlamydia trachomatis during normal and persistent growth. Nucleic Acids Res 39:1843–1854. doi: 10.1093/nar/gkq1065. [DOI] [PMC free article] [PubMed] [Google Scholar]
- 32.Albrecht M, Sharma CM, Reinhardt R, Vogel J, Rudel T. 2010. Deep sequencing-based discovery of the Chlamydia trachomatis transcriptome. Nucleic Acids Res 38:868–877. doi: 10.1093/nar/gkp1032. [DOI] [PMC free article] [PubMed] [Google Scholar]
- 33.Tattersall J, Rao GV, Runac J, Hackstadt T, Grieshaber SS, Grieshaber NA. 2012. Translation inhibition of the developmental cycle protein HctA by the small RNA IhtA is conserved across Chlamydia. PLoS One 7:e47439. doi: 10.1371/journal.pone.0047439. [DOI] [PMC free article] [PubMed] [Google Scholar]
- 34.Grieshaber NA, Grieshaber SS, Fischer ER, Hackstadt T. 2006. A small RNA inhibits translation of the histone-like protein Hc1 in Chlamydia trachomatis. Mol Microbiol 59:541–550. doi: 10.1111/j.1365-2958.2005.04949.x. [DOI] [PubMed] [Google Scholar]
- 35.Bastidas RJ, Valdivia RH. 2016. Emancipating Chlamydia: advances in the genetic manipulation of a recalcitrant intracellular pathogen. Microbiol Mol Biol Rev 80:411–427. doi: 10.1128/MMBR.00071-15. [DOI] [PMC free article] [PubMed] [Google Scholar]
- 36.Huang DW, Sherman BT, Lempicki RA. 2009. Systematic and integrative analysis of large gene lists using DAVID bioinformatics resources. Nat Protoc 4:44–57. doi: 10.1038/nprot.2008.211. [DOI] [PubMed] [Google Scholar]
- 37.Porcella SF, Carlson JH, Sturdevant DE, Sturdevant GL, Kanakabandi K, Virtaneva K, Wilder H, Whitmire WM, Song L, Caldwell HD. 2015. Transcriptional profiling of human epithelial cells infected with plasmid-bearing and plasmid-deficient Chlamydia trachomatis. Infect Immun 83:534–543. doi: 10.1128/IAI.02764-14. [DOI] [PMC free article] [PubMed] [Google Scholar]
- 38.Wagner EG, Romby P. 2015. Small RNAs in bacteria and archaea: who they are, what they do, and how they do it. Adv Genet 90:133–208. doi: 10.1016/bs.adgen.2015.05.001. [DOI] [PubMed] [Google Scholar]
- 39.Svensson SL, Sharma CM. 6 May 2016. Small RNAs in bacterial virulence and communication. Microbiol Spectr doi: 10.1128/microbiolspec.VMBF-0028-2015. [DOI] [PubMed] [Google Scholar]
- 40.Storz G, Vogel J, Wassarman KM. 2011. Regulation by small RNAs in bacteria: expanding frontiers. Mol Cell 43:880–891. doi: 10.1016/j.molcel.2011.08.022. [DOI] [PMC free article] [PubMed] [Google Scholar]
- 41.Grieshaber NA, Tattersall JS, Liguori J, Lipat JN, Runac J, Grieshaber SS. 2015. Identification of the base-pairing requirements for repression of hctA translation by the small RNA IhtA leads to the discovery of a new mRNA target in Chlamydia trachomatis. PLoS One 10:e0116593. doi: 10.1371/journal.pone.0116593. [DOI] [PMC free article] [PubMed] [Google Scholar]
- 42.Ferreira R, Borges V, Nunes A, Borrego MJ, Gomes JP. 2013. Assessment of the load and transcriptional dynamics of Chlamydia trachomatis plasmid according to strains’ tissue tropism. Microbiol Res 168:333–339. doi: 10.1016/j.micres.2013.02.001. [DOI] [PubMed] [Google Scholar]
- 43.Hertel R, Meyerjürgens S, Voigt B, Liesegang H, Volland S. 2017. Small RNA mediated repression of subtilisin production in Bacillus licheniformis. Sci Rep 7:5699. doi: 10.1038/s41598-017-05628-y. [DOI] [PMC free article] [PubMed] [Google Scholar]
- 44.Liu Y, Chen C, Gong S, Hou S, Qi M, Liu Q, Baseman J, Zhong G. 2014. Transformation of Chlamydia muridarum reveals a role for Pgp5 in suppression of plasmid-dependent gene expression. J Bacteriol 196:989–998. doi: 10.1128/JB.01161-13. [DOI] [PMC free article] [PubMed] [Google Scholar]
- 45.Jorgensen I, Rayamajhi M, Miao EA. 2017. Programmed cell death as a defence against infection. Nat Rev Immunol 17:151–164. doi: 10.1038/nri.2016.147. [DOI] [PMC free article] [PubMed] [Google Scholar]
- 46.Patton MJ, McCorrister S, Grant C, Westmacott G, Fariss R, Hu P, Zhao K, Blake M, Whitmire B, Yang C, Caldwell HD, McClarty G. 2016. Chlamydial protease-like activity factor and type III secreted effectors cooperate in inhibition of p65 nuclear translocation. mBio 7:e01427-16. doi: 10.1128/mBio.01427-16. [DOI] [PMC free article] [PubMed] [Google Scholar]
- 47.Webster SJ, Brode S, Ellis L, Fitzmaurice TJ, Elder MJ, Gekara NO, Tourlomousis P, Bryant C, Clare S, Chee R, Gaston HJS, Goodall JC. 2017. Detection of a microbial metabolite by STING regulates inflammasome activation in response to Chlamydia trachomatis infection. PLoS Pathog 13:e1006383. doi: 10.1371/journal.ppat.1006383. [DOI] [PMC free article] [PubMed] [Google Scholar]
- 48.Tang L, Chen J, Zhou Z, Yu P, Yang Z, Zhong G. 2015. Chlamydia-secreted protease CPAF degrades host antimicrobial peptides. Microbes Infect 17:402–408. doi: 10.1016/j.micinf.2015.02.005. [DOI] [PubMed] [Google Scholar]
- 49.Xia M, Bumgarner RE, Lampe MF, Stamm WE. 2003. Chlamydia trachomatis infection alters host cell transcription in diverse cellular pathways. J Infect Dis 187:424–434. doi: 10.1086/367962. [DOI] [PubMed] [Google Scholar]
- 50.Bastidas RJ, Elwell CA, Engel JN, Valdivia RH. 2013. Chlamydial intracellular survival strategies. Cold Spring Harb Perspect Med 3:a010256. doi: 10.1101/cshperspect.a010256. [DOI] [PMC free article] [PubMed] [Google Scholar]
- 51.Yang C, Starr T, Song L, Carlson JH, Sturdevant GL, Beare PA, Whitmire WM, Caldwell HD. 2015. Chlamydial lytic exit from host cells is plasmid regulated. mBio 6:e01648-15. doi: 10.1128/mBio.01648-15. [DOI] [PMC free article] [PubMed] [Google Scholar]
- 52.Peterson EM, Markoff BA, Schachter J, de la Maza LM. 1990. The 7.5-kb plasmid present in Chlamydia trachomatis is not essential for the growth of this microorganism. Plasmid 23:144–148. doi: 10.1016/0147-619X(90)90033-9. [DOI] [PubMed] [Google Scholar]
- 53.Caldwell HD, Schachter J. 1982. Antigenic analysis of the major outer membrane protein of Chlamydia spp. Infect Immun 35:1024–1031. [DOI] [PMC free article] [PubMed] [Google Scholar]
- 54.Nesvizhskii AI, Keller A, Kolker E, Aebersold R. 2003. A statistical model for identifying proteins by tandem mass spectrometry. Anal Chem 75:4646–4658. doi: 10.1021/ac0341261. [DOI] [PubMed] [Google Scholar]
- 55.Shadforth IP, Dunkley TP, Lilley KS, Bessant C. 2005. i-Tracker: for quantitative proteomics using iTRAQ. BMC Genomics 6:145. doi: 10.1186/1471-2164-6-145. [DOI] [PMC free article] [PubMed] [Google Scholar]
- 56.Oberg AL, Mahoney DW, Eckel-Passow JE, Malone CJ, Wolfinger RD, Hill EG, Cooper LT, Onuma OK, Spiro C, Therneau TM, Bergen HR. 2008. Statistical analysis of relative labeled mass spectrometry data from complex samples using ANOVA. J Proteome Res 7:225–233. doi: 10.1021/pr700734f. [DOI] [PMC free article] [PubMed] [Google Scholar]
- 57.Cleveland WS, Devlin SJ, Grosse E. 1988. Regression by local fitting. J Econometrics 37:87–114. doi: 10.1016/0304-4076(88)90077-2. [DOI] [Google Scholar]
- 58.Smyth GK. 2004. Linear models and empirical Bayes methods for assessing differential expression in microarray experiments. Stat Appl Genet Mol Biol 3:Article3. doi: 10.2202/1544-6115.1027. [DOI] [PubMed] [Google Scholar]
- 59.Ritchie ME, Phipson B, Wu D, Hu Y, Law CW, Shi W, Smyth GK. 2015. Limma powers differential expression analyses for RNA-sequencing and microarray studies. Nucleic Acids Res 43:e47. doi: 10.1093/nar/gkv007. [DOI] [PMC free article] [PubMed] [Google Scholar]
- 60.Benjamini Y, Hochberg Y. 1995. Controlling the false discovery rate: a practical and powerful approach to multiple testing. J R Stat Soc 57:289–300. [Google Scholar]
- 61.Walter W, Sánchez-Cabo F, Ricote M. 2015. GOplot: an R package for visually combining expression data with functional analysis. Bioinformatics 31:2912–2914. doi: 10.1093/bioinformatics/btv300. [DOI] [PubMed] [Google Scholar]
- 62.Chronopoulou E, Uribe-Benninghoff A, Corbett CR, Berry JD. 2014. Hybridoma technology for the generation of rodent mAbs via classical fusion. Methods Mol Biol 1131:47–70. doi: 10.1007/978-1-62703-992-5_4. [DOI] [PubMed] [Google Scholar]
Associated Data
This section collects any data citations, data availability statements, or supplementary materials included in this article.
Supplementary Materials
Differential chlamydial protein expression following infection of HeLa cells. Differentially expressed proteins for chlamydiae are reported for group pair comparison in each tab (group 1 versus group 2). Full normalized protein expression of identified proteins and the significant results are reported for each strain in tabs within the table for chlamydial proteins. Download TABLE S1, XLSX file, 1.3 MB (1.4MB, xlsx) .
This is a work of the U.S. Government and is not subject to copyright protection in the United States. Foreign copyrights may apply.
Differential HeLa cell protein expression following infection with P+ and P− chlamydiae. Differentially expressed proteins for host HeLa cell are reported for group pair comparison in each tab (group 1 versus group 2). Full normalized protein expression of identified proteins and the significant results are reported for each strain in tabs within the table for human proteins. Where no differentially expressed proteins were found between two groups, no differential expression tab is reported. Download TABLE S2, XLSX file, 15 MB (15.3MB, xlsx) .
This is a work of the U.S. Government and is not subject to copyright protection in the United States. Foreign copyrights may apply.