

Abstract
Functional imaging computational fluid dynamics simulations of right ventricular (RV) inflow fields were obtained by comprehensive software using individual animal-specific dynamic imaging data input from three-dimensional (3-D) real-time echocardiography (RT3D) on a CRAY T-90 supercomputer. Chronically instrumented, lightly sedated awake dogs (n = 7) with normal wall motion (NWM) at control and normal or diastolic paradoxical septal motion (PSM) during RV volume overload were investigated. Up to the E-wave peak, instantaneous inflow streamlines extended from the tricuspid orifice to the RV endocardial surface in an expanding fanlike pattern. During the descending limb of the E-wave, large-scale (macroscopic or global) vortical motions ensued within the filling RV chamber. Both at control and during RV volume overload (with or without PSM), blood streams rolled up from regions near the walls toward the base. The extent and strength of the ring vortex surrounding the main stream were reduced with chamber dilatation. A hypothesis is proposed for a facilitatory role of the diastolic vortex for ventricular filling. The filling vortex supports filling by shunting inflow kinetic energy, which would otherwise contribute to an inflow-impeding convective pressure rise between inflow orifice and the large endocardial surface of the expanding chamber, into the rotational kinetic energy of the vortical motion that is destined to be dissipated as heat. The basic information presented should improve application and interpretation of noninvasive (Doppler color flow mapping, velocity-encoded cine magnetic resonance imaging, etc.) diastolic diagnostic studies and lead to improved understanding and recognition of subtle, flow-associated abnormalities in ventricular dilatation and remodeling.
Keywords: ventricular function, diastole, cardiac mechanics, cardiac blood flow, endocardial mechanoreceptors
The fluid dynamics of diastolic filling are essentially unexplored for the right ventricle (RV) (10, 11), although in the context of the left ventricle (LV), they have been shown to hold great importance for proper evaluations of diagnostic studies and in pathophysio-logical investigations of ventricular function (17, 18, 21, 22). The elegant, classic experimental in vitro findings on mechanical left heart models and their analytical interpretation reported by Bellhouse (1) have shown that ventricular dilatation, common in heart failure, induces a decrease in the diastolic filling vortex strength. The diastolic filling vortices of interest here are “global” or “macroscopic” in the sense that they occupy a sizeable region within the chamber. They are “large-scale” structures in contrast to “microscopic” high-frequency disturbances (eddies) within the turbulent regime downstream of a stenotic valve. Knowledge concerning diastolic RV flow field characteristics under normal conditions and changes induced by chamber dilatation should improve application and interpretation of noninvasive diagnostic studies (Doppler color flow mapping, velocity-encoded cine magnetic resonance imaging, etc.) under these conditions. They should also lead to better insights into factors limiting the accuracy of indicator dilution measurements in RV dilatation, and point toward new research areas on aspects of intracardiac flow that could be implicated in the pathophysiology of failure characterized by chamber dilatation and remodeling and their sequelae.
For these reasons, RV intraventricular diastolic filling flow patterns were investigated under normal conditions and during volume overload with or without paradoxic septal motion (PSM) as an extension of our previously published work (15). Functional imaging of the diastolic RV flow field involving computational fluid dynamic simulations in individual animals was carried out, utilizing three-dimensional (3-D) real-time echocardiography (RT3D) for dynamic RV chamber reconstructions, which were validated by simultaneous sonomicrometry, as described in a recent publication (15). The simulations yielded high spatial and temporal resolution data on the filling vortex and the evolution of the RV diastolic flow field throughout the E-wave, and quantitative visualizations elucidated its detailed dynamic characteristics in the hearts of lightly sedated, awake dogs under control conditions and in experimentally induced chamber dilatation.
METHODS
Instrumentation and data acquisition
Because of the complicated dynamic RV geometry, this investigation required application of a recently developed functional imaging method (15), which comprises real-time 3-D cardiac imaging and computational fluid dynamics. Figure 1 summarizes the method.
Fig. 1.

Schematic summary of the functional imaging method, which comprises three parts. First, a semiautomated segmentation aided by intraluminal contrast medium locates the right ventricular (RV) endocardial surface. Second, a geometric scheme for dynamic RV chamber reconstruction applies a time interpolation procedure to the 3-dimensional real-time echocardiography (RT3D) data to quantify wall geometry and motion at 400 Hz. Finally, RV endocardial border motion information is used for mesh generation on a computational fluid dynamics solver to simulate development of the early RV diastolic inflow field. Boundary conditions (tessellated endocardial surface nodal velocities) for the solver are directly derived from the endocardial geometry and motion information. Method is independent of digital imaging modality used. IR, isovolumic relaxation; RF, rapid filling period; D, diastasis; A, atrial filling period.
Experiments were performed on seven 20- to 30-kg dogs, and the functional imaging method was experimentally validated (15) on these same animals, as described in a previous publication. All procedures and animal care were in accordance with the Duke University IACUC guidelines, conforming to the “Position of the American Heart Association on Research Animal Use,” American Heart Association, November 11, 1984. The dogs were premedicated with cefazolin (500 mg) and anesthetized with intravenous pentobarbital (20 mg/kg) and succinylcholine (1 mg/kg). They were ventilated with a respirator (MA 1TM, Puritan-Bennett; Los Angeles, CA). Sonomicrometric transducers were sewn across the base-apex, anterior-posterior, and septal-free wall axes of the LV and across the RV septal-free wall axis for validation of the dynamic RV chamber reconstruction (2, 5, 15). Each dog recovered for 7–10 days before being subjected to control data acquisition in a lightly sedated (morphine 0.7 mg/kg), conscious state. Control data were obtained and digitized at 400 Hz. Subsequently, volume overload was induced by tricuspid regurgitation (13–15). Volume overload data were taken 2–3 wk later in a similar manner to control.
3-D real-time echocardiography and image segmentation
Real-time 3-D images of the RV were obtained using the RT3D ultrasound scanner (Volumetrics Medical Imaging; Durham, NC). Endocardial border detection involved proprietary software, which displayed one RV frame at a time. A two-dimensional “(2-D) Swath” algorithm (15) located the most likely position of the endocardial border. The individual points were converted into 3-D cartesian coordinates and stored in a file. Each file was a four-dimensional (4-D) matrix containing a sequence of 3-D RV chamber “volumes” ordered chronologically. Each “volume” was a succession of endocardial border layers from apex to base (Fig. 1, inset 1).
Reconstruction of endocardial border points
The data representing the extracted endocardial edges were in layered form and were further processed to generate the desired coordinates in 3-D. To obtain RV diastolic flow field simulations at a temporal resolution of 400 Hz, it was necessary to approximate the 3-D RV geometry at time instants between successive RT3D images. Under steady-state conditions, RV geometry was calculated at these instants as a quadratic weighted average of the dynamic geometry in contiguous RT3D frames. Representative RV reconstructions are depicted in Fig. 1, inset 2.
Dynamic RV chamber volume, using shell subtraction model (SSM) and sonomicrometric dimensions, and its time derivative or “inflow rate” were also calculated and compared with those obtained using RT3D data (cf. Fig. 1, inset 3). This allowed adjusting the instantaneous volume and velocity boundary conditions in the computational fluid dynamic (CFD) simulations of the flow field, as needed, according to a previously detailed scheme (15). The final set of endocardial border points served as input for mesh generation.
Mesh generation and determination of boundary conditions
A combination of FIDAP (8, 9) and custom software (15) generated the mesh representing the 3-D domain for simulation of RV intraventricular diastolic flow (Fig. 1, inset 4). The instantaneous geometry defined the external nodal points of the mesh, to which were assigned boundary conditions, i.e., nodal velocity vectors describing direction and speed of instantaneous motion (Fig. 1, inset 4).
Computer simulations and flow visualization
Simulations were carried out using the CRAY T-90 supercomputer running FIDAP on the UNICOS operating system (Cray; Mendota Heights, MN) at the North Carolina Supercomputing Center. They had to be completed through consecutive runs, each advancing the solution by two to four 2.5-ms time steps. It was assumed that blood is a Newtonian, incompressible fluid with kinematic viscosity of 0.04 Stokes and mass density of 1.05 g/cm3 and that flow is governed by the Navier-Stokes equations. The flow field was visualized using the FIDAP postprocessing module, which extracts the field variables on any specified visualization plane or “cut” within the field (Fig. 1, inset 5; Figs. 2 and 3).
Fig. 2.

Representative fanlike frontal plane RV flow velocity fields during early stage of filling (top) and at E-wave peak volumetric inflow rate 136 cm3/s for normal wall motion (NWM) and 216 cm3/s for paradoxical septal motion (PSM) (bottom). Left, NWM; right, chamber dilatation with PSM in the same dog.
Fig. 3.

Frontal plane RV flow velocity fields (top), and color maps (middle) near end of E-wave, from same dog as Fig. 2. Instantaneous inflow rate was 39.0 cm3/s for NWM (left) and 71 cm3/s for PSM (right). Both visualization planes and color coding are identical to those in Fig. 2. Bottom, simultaneous transverse “cut” color maps in a plane 2.5 cm below the inflow orifice show to advantage the higher axial core velocities in the normal and the larger core cross-sectional area in the volume-overloaded chamber (cf. Fig. 5).
RESULTS
Wall motion patterns
All seven lightly sedated, awake animals exhibited normal wall motion (NWM) at control; three also had normal and four exhibited diastolic PSM in volume overload with chamber dilatation. PSM and NWM differ qualitatively from each other in the direction of septal movement. In PSM, the septum moves toward the LV in diastole. The NWM condition exhibits the opposite scenario in which the septum functions as part of the LV and moves into the right ventricle.
RV diastolic flow field simulations
The functional imaging simulations allowed examination of the dynamic evolution of the RV diastolic flow field throughout the E-wave in individual dog hearts under control and failure conditions characterized by RV dilatation. By taking the time derivative of the instantaneous RV volume calculated with the RT3D-based dynamic reconstruction method, the RV diastolic filling rate could be calculated. Representative plots of instantaneous RV volumetric filling rate (dV/dt) and volume (V) are shown in Fig. 1, insets 3a and b, respectively. Both control and volume overload simulations extended throughout the E-wave (cf. arrows in Fig. 4). RV flow field information was extracted from the databases obtained through the individual simulations. Scientific visualization of each simulated RV flow field disclosed the existence of large-scale vortical motions inside the filling right ventricles of the individual dog hearts both at control and under volume overload conditions.
Fig. 4.
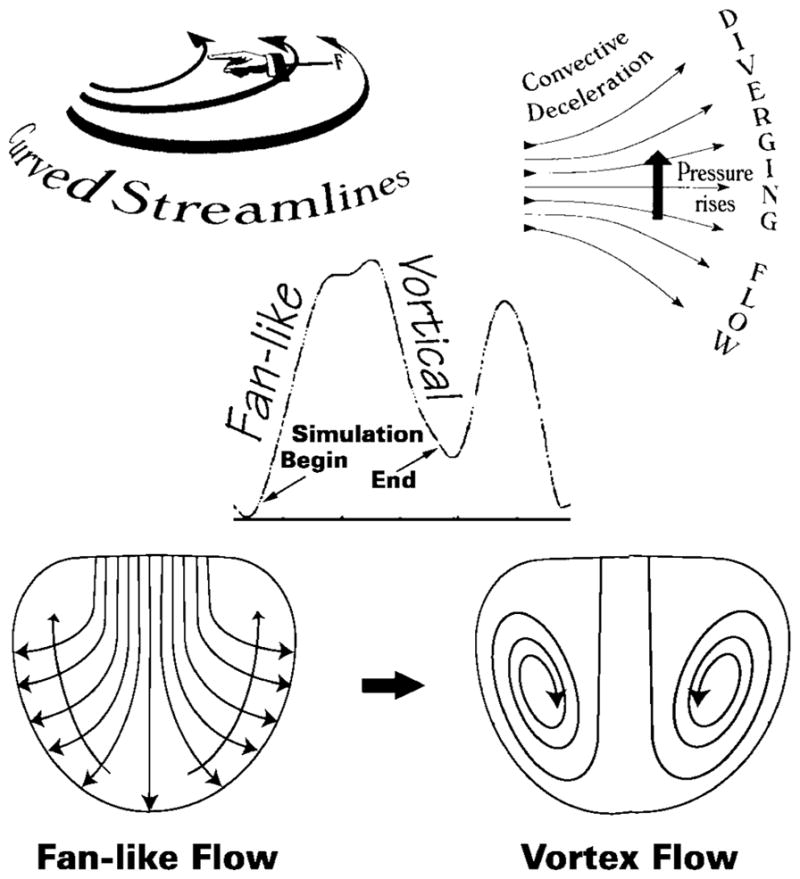
As blood fans away from the central stream toward the endocardial walls, the convective deceleration effect tends, by the Bernoulli mechanism, to elevate downstream pressure opposing ventricular inflow (top right). There is an additional convective pressure decrease normal to the curved fanning streamlines (top left), which tends to decrease pressure in the direction of the chamber’s base and away from the endocardial walls (long arrows crossing streamlines, lower left). During the upstroke of the E-wave, these combined adverse convective pressure effects are opposed by the local acceleration gradient, which favors forward flow. During the E-wave down-stroke, they are joined in sense and augmented by the local deceleration gradient and can now reverse the flow. This leads to disruption of the boundary between oncoming blood and endocardial walls, or “flow separation,” and to the formation of a toroidal vortex that surrounds the central core. Center inset, volumetric filling rate calculated by numerical differentiation of RV chamber volume obtained from dynamic representations using RT3D measurements; small arrows point to representative beginning and ending points of simulations.
Intraventricular flow field
In the following sections, illustrative functional imaging visualizations from the individual simulations are considered together in the context of the filling process throughout the entire E-wave, for a comparison of the RV diastolic flow field characteristics in ventricular dilatation with PSM to those with NWM. We examine snapshots of the RV flow field at the following three informative points of the E-wave: early in the upstroke, at peak volumetric inflow, and late in the downstroke.
Early upstroke through the peak of the E-wave
Figure 2 illustrates typical RV flow fields developing during the early upstroke of the E-wave soon after the onset of filling (top) and at peak volumetric inflow rate (bottom). Figure 2, left, shows the flow fields applying at control with NWM and, right, the fields applying under conditions of RV dilatation with PSM in the same animal. The velocity fields are visualized on an RV coronal (frontal) plane. The arrows indicate both direction and magnitude of the flow velocity at each node within the plane. Such arrow maps are effective in revealing the spatial organization of flow within the entire flow field. Flow velocity is encoded in the length of an arrow, whereas its color is assigned according to the z component of the velocity vector. A negative z component (i.e., the blue-green region of the spectrum) maps flow toward the apex, whereas a positive one (red-orange region) represents a velocity pointing toward the RV base (see color scale inset in Fig. 2).
Figure 2, top, shows that the computed flow fields on an RV frontal plane were quite similar for both wall motion patterns. In both, the inflow velocities in the region of the tricuspid anulus and below have a balanced distribution, being directed approximately equally in each of the following directions: the anterior wall, the apex, and the posterior wall. Essentially all inflow velocity vectors are directed in a fan-like shape toward the chamber walls, which they meet perpendicularly satisfying the “no slip” condition. This pattern is consistent with the motion of intraventricular blood similar to displacement of a laminar telescoping fluid trunk peeling off successive layers that flare out laterally and meet the receding endocardium at right angles (cf. also Fig. 4). On the other hand, NWM and PSM exhibited dissimilar flow fields in the (median) sagittal plane: blood velocities were slanted toward the RV free wall in the NWM model and toward the septum in the PSM model, as previously described (15).
The bottom panels in Fig. 2 pertain to peak volumetric inflow rate: the peak volumetric inflow velocity was 136 cm3/s for NWM and 216 cm3/s for PSM. Because of the higher inflow rates compared with the early inflow stage, stronger velocity fields are observed with both NWM and PSM. The magnitudes of the axial (z components) of the velocity vectors were predictably larger (dark blue) in PSM than NWM because of the much higher peak volumetric inflow rate in the volume overloaded (tricuspid regurgitation) condition.
As earlier in the E-wave, NWM and PSM yield fundamentally similar fan-shaped flow velocity fields in the coronal (frontal) plane. The inflow velocity profiles in the region of the tricuspid orifice remain balanced. In a sagittal plane, with NWM the motion of the septum induced strong flow velocities toward the RV free wall, whereas with PSM the septal motion away from the RV free wall caused the individual velocity vectors to be slanted in the reverse direction, toward the septum and the left ventricle.
Late downstroke of the E-wave
Figure 3, top, illustrates representative simulation plots of velocity vectors in the frontal plane. These results were obtained in the same dog as those in Fig. 2 but at instants close to the end of the E-wave. Figure 3, left, shows the flow field applying at control with NWM; the right shows the field applying under conditions of RV dilatation with PSM. The instantaneous volumetric inflow velocity was 39 cm3/s at control (NWM) and 71 cm3/s in the dilated chamber.
The most distinct feature of both flow fields at this later instant of the E-wave is the existence of large-scale vortical motions. In both the NWM and the PSM situations, streams roll up from regions near the apex toward the base. These streams are directed toward the plane of the inflow orifice, and some regurgitant flow was present under both control and volume overload conditions. In addition, the streams directed toward the inflow orifice interact with the incoming flow directed toward the apex. This interaction results in strong swirling motions, visualized nicely in Fig. 3. The extent of vortex formation appears to be stronger for the NWM case. Surprisingly, although the applying instantaneous volumetric inflow rate in NWM was much smaller than in PSM, higher (dark blue) velocity vector magnitudes are present within the control (NWM) flow field than in the dilated ventricle. The reason for this is discussed shortly.
The formation of large-scale vortices results in a highly complex flow field. The general characteristics of the velocity field are better revealed using color mapping as is shown in Fig. 3, middle and bottom.
Color mapping
Figure 3, middle and bottom, shows color maps of the velocity fields at the same instants as the corresponding velocity plots of the top panels. Such mappings are familiar to echocardiographers and suitable for revealing the global organization of the flow. The regions with red and orange colors represent blood flow toward the base of the right ventricle, whereas regions with blue and green colors represent blood flow toward the apex. Comparison between NWM and PSM simulations showed that the vortical motion was stronger in the former, with a high intensity in the region surrounding the main incoming stream below the inflow orifice. This effectively encroaches on the available central core area beyond the inflow orifice that is available for flow toward the apex. The encroaching effect was more pronounced in the simulations under control conditions than in the dilated volume-overloaded ventricles (cf. Fig. 5). This is responsible for the higher velocity vector magnitudes present within the normal flow field, referred to in the preceding paragraph. As illustrated in the representative case shown in Fig. 3, the vortical motion generated in the dilated ventricles with PSM had a more even spatial distribution. In addition, the space available for flow toward the apex, marked by the blue, green, and yellow zones, was significantly greater for the volume-overloaded situation.
Fig. 5.

Although applying instantaneous volumetric inflow rate at control was much smaller than with volume overload, higher core velocities were present in the control flow field after vortex development. Visualization of simulation results from NWM and PSM (cf. Fig. 3) showed that the vortical motion was stronger in the former. Vortex ring encroaches on the available central core area for flow toward the apex: more substantially so in NWM (A) than in the dilated ventricle (B). Width of each arrow is proportional to the central core area beyond the inflow orifice that is available for flow toward the apex; the length, to linear inflow velocity in the central core.
DISCUSSION
We have recently developed a comprehensive software environment that is able to model complex diastolic intracardiac flows in individual animal or human hearts (15). The integrated software system can accept data from RT3D and other digital imaging sources, such as computed tomography or magnetic resonance imaging, to generate dynamic geometric reconstructions of the cardiac chambers, which are then passed on to an automatic finite element mesh generator and a finite element solver. The flow fields of interest are then displayed using scientific visualization techniques. In the present investigation, simulations using this functional imaging system have yielded important information about the detailed diastolic RV flow fields of specific hearts in lightly sedated, awake dogs under control and volume overload conditions.
This research produced for the first time finite element 3-D simulations of diastolic blood flow into the RV chamber using in vivo, real-time 3-D dynamic RV geometric data. Completed, for the first time, were simulations of the evolution of the RV diastolic flow field throughout the entire E-wave in individual animal hearts under control and volume overload conditions associated with surgically induced experimental chronic tricuspid insufficiency. Simulations through the entire duration of the E-wave have allowed us to demonstrate the existence of large-scale 3-D vortical motions, which develop inside the RV chamber during diastole both at control and volume overload.
This study has also provided strong and important evidence regarding the impact of the applying chamber size and wall motion patterns on the development of the RV velocity field during diastole. The functional imaging approach can also be used to study the flow field in the left ventricle.
Reynolds number and distribution of nodal points
The local Reynolds number, Re ∝ D × v, of the RV diastolic inflow field (6, 12) constitutes a very important parameter in our computational fluid dynamic analysis. The characteristic length, D, in Re is proportional to the square root of flow cross-sectional area, whereas the velocity, v, in a diverging flow field decreases linearly as the area increases. Because the RV endocardial surface area is much larger than the tricuspid orifice area (area of walls/area of orifice ≥ 10), blood entering the chamber especially during the upstroke of the E-wave (before the flow breaks down into the vortical pattern, see Fig. 4) experiences powerful convective deceleration (6, 12). The net effect of a rapidly decreasing velocity v and a slowly increasing characteristic length D is a decrease in Re away from the orifice along the streamlines of the blood flow. The drop in Re is proportional to the square root of upstream to downstream flow cross-sectional areas. The local Re is therefore highest near the tricuspid orifice.
The large velocities of flow combined with the asymmetric 3-D nature of the complex dynamic RV geometry call for the use of a large number of finite element nodes for numerical stability and convergence of the simulations. Within our finite element analysis, the number of nodes along each axis must be of the order of the maximum Re to ensure numerical stability (6, 12, 15). The highest nodal densities are thus reserved for regions with the highest Re (near the inflow orifice). Consequently, to keep the problem tractable we used adaptive gridding (6, 15): the nodal density near the inflow orifice varied from 6 to 10 times that in the apical region.
The RV diastolic vortex
In all simulations conducted in the seven dog hearts under control and volume overload conditions, development of large-scale vortical motions was observed during the downstroke of the E-wave. During this period, inflow velocity decreases and the pressure level rises within the flow field. As one moves away from the central stream toward the endocardial wall, convective pressure rise by the Bernoulli mechanism raises the pressure energy opposing ventricular inflow along any streamline. An adverse convective (11, 12) pressure gradient develops, and this is augmented by the local deceleration (11, 12) gradient during the downstroke of the E-wave. As is shown diagrammatically in Fig. 4, bottom left, the fanning streamlines are curved. This implies that the streaming blood is acted upon by a centripetal force and that the convective pressure gradient has a component normal to the concave streamlines also, which tends to drive the blood toward the base of the chamber (Fig. 4). Ultimately, the combined adverse pressure gradient forces arrest forward flow and deflect the direction of blood near the endocardial surface toward the base, leading to flow separation, roll up, and recirculating vortical motions within the chamber. Large-scale vortices form, as shown in Figs. 3 and 4.
Our RV simulation findings exemplified in the panels of Figs. 2 and 3 are corroborated by the adroit and elegant measurements of Rodevand et al. (17) who identified LV diastolic flow patterns in healthy human subjects with the use of high frame-rate 2-D color Doppler and color M-mode Doppler echocardiography. Intraventricular velocities were measured with pulsed Doppler at three levels in both posterolateral and an-teroseptal parts of the left ventricle. During early transmitral flow acceleration, all intraventricular velocities were directed toward the apex. However, retrograde peripheral velocities representing diastolic vortex formation were documented after the peak of the E-wave. These LV findings, which are further discussed in a clinical survey of filling dynamics by Smiseth and Thompson (21), are thus seen to be in complete agreement with our RV functional imaging results in awake dogs.
To look now at why a vortex display comes about, we invoke the Theory of Dissipative Structures, formulated by Ilya Prigogine (16). Because of the movement and exchange of energy, when the simple fanlike pattern breaks down, the flow is likely to reorganize itself in a more complex interactive form and achieves coherence in the vortical arrangement. Blood moves through the filling vortex and forms it at the same time. Energy moves likewise through the vortical structure and the latter embodies the energy, highly organized and in motion, as rotational kinetic energy of the vortex.
Physiological significance
With the use of functional imaging (15), this study is the first to show the existence of vortical motion inside the right ventricle. The physiological repercussions of the vortical motion are most intriguing. Bellhouse (1), who conducted experimental studies on the LV diastolic vortex in the context of cardiac physiology in the early 1970s, proposed that vortical motion might assist in valve closure. Others (25) have suggested that the presence of LV diastolic vortical motions helps in the ensuing process of ejection, by conversion of vortex kinetic energy into kinetic energy of outflow after aortic valve opening. According to this view, vortices within the ventricle would act as energy-preserving flow structures (4). It is well known in fluid mechanics, however, that large vortices never unwind smoothly. Instead, they break up into smaller eddies, and this process is continued, until the vortices are reduced to micron-size eddies and at that level (Kolmogorov “microscale”) they dissipate under the action of viscous forces (19). The process is known as the vortical cascade mechanism. This implies that vortices are essentially “traps” or “sinks of energy.” Whatever kinetic energy is trapped in the recirculating motion of a vortex is bound to be converted to heat and lost from the motion and therefore cannot in fact aid ejection.
We propose a new hypothesis concerning the useful role played by the vortices in overall diastolic function. According to the hypothesis, the difference between the inflow orifice area (Ai) and the endocardial surface area (Aendo) is responsible for generating strong convective deceleration before transition to vortical flow in diastole (cf. Fig. 4). The diastolic intraventricular pressure gradient resulting from this convective deceleration, termed “convective deceleration load,” adversely impacts diastolic inflow. This adverse impact is amplified in the presence of ventricular dilatation with attendant diastolic “ventriculoannular disproportion.” The concept is analogous to the systolic one introduced in earlier studies (12). The key to the proposed useful physiological role of the vortices lies within their impounding of a certain amount of energy, and this becomes manifest as a decrease in the pressure energy of the inflowing blood. By shunting the inflow work and kinetic energy, which would otherwise contribute an inflow-impeding, pressure-rise between inflow orifice and the endocardial surface of the expanding chamber, into the kinetic energy of the vortical motion (Figs. 4 and 5) that is destined to be dissipated as heat, the diastolic vortex actually facilitates filling and the attainment of higher end-diastolic volume.
Clinical impact of RV size and wall motion patterns
Using functional imaging, we have demonstrated that not just quantitative but qualitative important alterations in the intraventricular velocity field result from changes in applying RV dynamic geometry and wall motion patterns. As shown by the results presented, the impact of abnormal chamber dilatation and wall motion patterns on RV flow is manifested throughout the entire E-wave. In this study, we have been able to characterize extensively the resultant alterations of the diastolic flow field. Our functional imaging simulation findings are in agreement with the classic studies of Bellhouse (1), who reported reduced vortex strength and extent in dilated ventricles.
The reduced extent and strength of the diastolic vortex in RV chamber dilatation with diastolic PSM (cf. Fig. 5) may have notable clinical implications. Thus, in a meticulous clinical study (7), RV end-diastolic and end-systolic volume indexes in patients with dilated cardiomyopathy were significantly higher by thermodilution compared with MRI, and exclusion of patients with atrial fibrillation did not reduce the mean difference between both methods. Impaired indicator mixing associated with weakened vortical motions (Fig. 6) in the dilated cardiomyopathic ventricles could be responsible by introducing a strong violation of the underlying assumption of “perfect mixing” between injection and sampling sites.
Fig. 6.

Rotation in the intraventricular blood stream may naturally encourage a gentle scouring (shear) of the endocardial lining of the chamber (left); vortical spinning may promote chemical mixing and keep formed and unformed blood elements suspended as sugar and tea leaves are kept suspended by vigorous stirring, which sets up secondary vortical motions in a tea cup (right). P, pressure: acts perpendicularly; WS, wall shear: acts tangentially on the endocar-dial lining.
Similarly, vortical rotation in the intraventricular blood may naturally encourage gentle tangential scouring (shear) of the endocardial lining of the chamber (Fig. 6, left). In endothelial cells, fluid shear stress has been shown to activate cytoskeletal and biochemical mechanoreceptors, which activate multiple signal transduction pathways, involving sequentially activated protein kinases and transcription factors that form a highly interconnected signaling system and result in various cellular physiological responses (26, 27). Similar actions might well apply to endocardial cells and could affect ventricular function and remodeling in failure in as yet unknown ways, which remain to be explored in future investigations.
Moreover, vortical rotation may keep formed and unformed blood elements suspended like sugar and tea leaves are kept suspended by stirring (Fig. 6, right). Its weakening in chamber dilatation may therefore contribute to thrombus formation and thromboembolic phenomena. Not only might vortical flow have bearing on the avoidance of thrombosis, but also, by being responsible for the swirling flow (augmented shear) arriving at the nearby pulmonary arterial branches in the ensuing ejection, it might be a factor contributing to the well-known avoidance of atherogenicity in the pulmonary arterial system. This would be a corollary of the notion (3) that a fluid dynamic wall shear near zero for an appreciable part of the pulsatile cycle favors atherogenicity.
In conclusion, our present findings should improve application and interpretation of diagnostic studies and measurements and lead to improved understanding of the flow-pattern associated implications of ventricular dilatation and failure on the energetics of diastolic filling. They should also stimulate further work leading to improved recognition of subtle flow-associated abnormalities and their multifaceted sequelae in dilatation. Future clinical functional imaging studies should provide further insights useful in the diagnosis and management of filling abnormalities associated with diverse types of ventricular dysfunction.
Developments in computer software and hardware and in imaging will undoubtedly accelerate such contributions to the understanding and management of ventricular dysfunction and failure.
Acknowledgments
This work was supported in part by National Heart, Lung, and Blood Institute Grant R01-HL-50446 (to A. Pasipoularides), the North Carolina Supercomputing Center/Cray Research (to A. Pasipoularides), and the Duke/National Science Foundation Engineering Research Center for Emerging Cardiovascular Technologies (to A. Pasipoularides and M. Shu).
References
- 1.Bellhouse BJ. Fluid mechanics of model aortic and mitral valves. Proc R Soc Med. 1970;63:996–1013. doi: 10.1177/003591577006301009. [DOI] [PMC free article] [PubMed] [Google Scholar]
- 2.Feneley MP, Elbeery JR, Gaynor JW, Gall SA, Davis JW, Rankin JS. Ellipsoidal shell subtraction model of right ventricular volume. Comparison with regional free wall dimensions as indexes of right ventricular function. Circ Res. 1990;67:1427–1436. doi: 10.1161/01.res.67.6.1427. [DOI] [PubMed] [Google Scholar]
- 3.Friedman MH, Brinkman AM, Qin JJ, Seed WA. Relation between coronary artery geometry and the distribution of early sudanophilic lesions. Atherosclerosis. 1993;98:193–199. doi: 10.1016/0021-9150(93)90128-h. [DOI] [PubMed] [Google Scholar]
- 4.Fyrenius A, Wigström L, Ebbers T, Karlsson M, Engvall J, Bolger AF. Three dimensional flow in the human left atrium. Heart. 2001;86:448–455. doi: 10.1136/heart.86.4.448. [DOI] [PMC free article] [PubMed] [Google Scholar]
- 5.Gaynor JW, Feneley MP, Gall SA, Maier GW, Kisslo JA, Davis JW, Rankin JS, Glower DD. Measurement of left ventricular volume in normal and volume-overloaded canine hearts. Am J Physiol Heart Circ Physiol. 1994;266:H329–H340. doi: 10.1152/ajpheart.1994.266.1.H329. [DOI] [PubMed] [Google Scholar]
- 6.Georgiadis JG, Wang M, Pasipoularides A. Computational fluid dynamics of left ventricular ejection. Ann Biomed Eng. 1992;20:81–97. doi: 10.1007/BF02368507. [DOI] [PubMed] [Google Scholar]
- 7.Globits S, Pacher R, Frank H, Pacher B, Mayr H, Neuhold A, Glogar D. Comparative assessment of right ventricular volumes and ejection fraction by thermodilution and magnetic resonance imaging in dilated cardiomyopathy. Cardiology. 1995;86:67–72. doi: 10.1159/000176833. [DOI] [PubMed] [Google Scholar]
- 8.Hampton TG, Shim Y, Straley CA, Pasipoularides A. Finite element analysis of cardiac ejection dynamics: ultrasonic implications. Adv Eng. 1992;22:371–374. [Google Scholar]
- 9.Hampton TG, Shim Y, Straley CA, Uppal R, Craig D, Glower DD, Smith PK, Pasipoularides A. Finite element analysis of ejection dynamics on the CRAY Y-MP. Computers Cardiol Proc. 1992;19:295–298. [Google Scholar]
- 10.Mirsky I, Pasipoularides A. Clinical assessment of diastolic function. Prog Cardiovasc Dis. 1990;32:291–318. doi: 10.1016/0033-0620(90)90018-w. [DOI] [PubMed] [Google Scholar]
- 11.Pasipoularides A. Cardiac mechanics: basic and clinical contemporary research. Ann Biomed Eng. 1992;20:3–17. doi: 10.1007/BF02368503. [DOI] [PubMed] [Google Scholar]
- 12.Pasipoularides A. Clinical assessment of ventricular ejection dynamics with and without outflow obstruction. J Am Coll Cardiol. 1990;15:859–882. doi: 10.1016/0735-1097(90)90287-y. [DOI] [PubMed] [Google Scholar]
- 13.Pasipoularides AD, Shu M, Shah A, Glower DD. Right ventricular diastolic relaxation in conscious dog models of pressure overload, volume overload and ischemia. J Thorac Cardiovasc Surg. 2002;124:964–972. doi: 10.1067/mtc.2002.126677. [DOI] [PMC free article] [PubMed] [Google Scholar]
- 14.Pasipoularides A, Shu M, Shah A, Silvestry S, Glower DD. Right ventricular diastolic function in canine models of pressure overload, volume overload and ischemia. Am J Physiol Heart Circ Physiol. 2002;283:H2140–H2150. doi: 10.1152/ajpheart.00462.2002. [DOI] [PMC free article] [PubMed] [Google Scholar]
- 15.Pasipoularides AD, Shu M, Womack MS, Shah A, von Ramm O, Glower DD. RV functional imaging: 3-D echo-derived dynamic geometry and flow field simulations. Am J Physiol Heart Circ Physiol. 2003;284:H56–H65. doi: 10.1152/ajpheart.00577.2002. [DOI] [PMC free article] [PubMed] [Google Scholar]
- 16.Prigogine I. Time, structure, and fluctuations (Nobel Lecture Chemistry) Science. 1978;201:777–785. doi: 10.1126/science.201.4358.777. [DOI] [PubMed] [Google Scholar]
- 17.Rodevand O, Bjornerheim R, Edvardsen T, Smiseth OA, Ihlen H. Diastolic flow pattern in the normal left ventricle. J Am Soc Echocardiogr. 1999;12:500–507. doi: 10.1016/s0894-7317(99)70087-8. [DOI] [PubMed] [Google Scholar]
- 18.Rusk RA, Li XN, Mori Y, Irvine T, Jones M, Zetts AD, Kenny A, Sahn DJ. Direct quantification of transmitral flow volume with dynamic 3-dimensional digital color doppler: a validation study in an animal model. J Am Soc Echocardiogr. 2002;15:55–62. doi: 10.1067/mje.2002.116716. [DOI] [PubMed] [Google Scholar]
- 19.She ZS, Waymire EC. Quantized energy cascade and Log-Poisson statistics in fully developed turbulence. Phys Rev Lett. 1995;74:262–265. doi: 10.1103/PhysRevLett.74.262. [DOI] [PubMed] [Google Scholar]
- 20.Shiota T, Jones M, Chikada M, Fleishman CE, Castellucci JB, Cotter B, DeMaria AN, von Ramm OT, Kisslo J, Ryan T, Sahn D. Real-time three-dimensional echocardiography for determining right ventricular stroke volume in an animal model of chronic right ventricular volume overload. Circulation. 1998;97:1897–1900. doi: 10.1161/01.cir.97.19.1897. [DOI] [PubMed] [Google Scholar]
- 21.Smiseth OA, Thompson CR. Atrioventricular filling dynamics, diastolic function and dysfunction. Heart Fail Rev. 2000;5:291–299. doi: 10.1023/a:1026531511226. [DOI] [PubMed] [Google Scholar]
- 22.Steine K, Stugaard M, Smiseth OA. Mechanisms of diastolic intraventricular regional pressure differences and flow in the inflow and outflow tracts. J Am Coll Cardiol. 2002;40:983–990. doi: 10.1016/s0735-1097(02)02046-6. [DOI] [PubMed] [Google Scholar]
- 23.Stetten G, Morris R. The shape detection with the flow integration transform. Inform Sci. 1995;85:203–221. [Google Scholar]
- 24.Stetten GD, Drezek R. Active fourier contour applied to real time 3D ultrasound of the heart. Int J Imag Graph. 2001;1:647–658. [Google Scholar]
- 25.Taylor TW, Yamaguchi T. Flow patterns in three-dimensional left ventricular systolic and diastolic flows determined from computational fluid dynamics. Biorheology. 1995;32:61–71. doi: 10.3233/bir-1995-32105. [DOI] [PubMed] [Google Scholar]
- 26.Tseng H, Peterson TE, Berk BC. Fluid shear stress stimulates mitogen-activated protein kinase in endothelial cells. Circ Res. 1995;77:869–78. doi: 10.1161/01.res.77.5.869. [DOI] [PubMed] [Google Scholar]
- 27.Ueba H, Kawakami M, Yaginuma T. Shear stress as an inhibitor of vascular smooth muscle cell proliferation: role of transforming growth factor-b1 and tissue type plasminogen activator. Arterioscler Thromb Vasc Biol. 1997;17:1512–1516. doi: 10.1161/01.atv.17.8.1512. [DOI] [PubMed] [Google Scholar]