Abstract
By limiting filling, abnormalities of right ventricular (RV) diastolic function may impair systolic function and affect adaptation to disease. To quantify diastolic RV pressure-volume relations and myocardial compliance (MC), a new sigmoidal model was developed. RV micromanometric and sonomicrometric data in alert dogs at control (n = 16) and under surgically induced subacute (2–5 wk) RV pressure overload (n = 6), volume overload (n = 7), and ischemia (n = 6) were analyzed. The conventional exponential model detected no changes from control in the passive filling pressure-volume (Ppf -V) relations. The new sigmoidal model revealed significant quantifiable changes in Ppf -V relations. Maximum RV MC (MCmax), attained during early filling, is reduced from control in pressure overload (P = 0.0016), whereas filling pressure at maximum MC (PMCmax) is increased (P = 0.0001). End-diastolic RV MC increases significantly in volume overload (P = 0.0131), whereas end-diastolic pressure is unchanged. In ischemia, MCmax is decreased (P = 0.0102), with no change in PMCmax. We conclude that the sigmoidal model quantifies important changes in RV diastolic function in alert dog models of pressure overload, volume overload, and ischemia.
Keywords: diastole, dynamics, heart failure, myocardial compliance, right ventricle
Right ventricular (RV) diastolic abnormalities such as reduced myocardial compliance (MC) may impair systolic function by limiting filling and play an integral role in cardiac adaptations to disease. Nevertheless, the development of indexes for RV function has evolved slowly, and numerous gaps remain in our understanding of RV diastolic function (10, 13, 28). Limitation of our understanding of the right ventricle can be attributed to the paucity of information from animal analogs of human RV disease and the lack of mathematical models for the analysis of RV performance. In contrast, comparable aspects relating to the left ventricle (3, 9, 17, 23) are much more highly developed. However, the simple application of indexes developed for the left ventricle to RV function has led to confusing and conflicting results.
The primary aim of the current study is to derive and validate new mathematical models and indexes specifically for the analysis of RV diastolic dynamics and the quantitative assessment of diastolic RV dysfunction and failure. Recognizing that a consensus has not been reached on what constitutes a correct mathematical descriptor of diastolic pressure-volume relations even for the extensively studied left ventricle, we propose that these new conceptual approaches will also contribute to the study of left ventricular function. Our present focus, however, is on RV diastolic pressure-volume relations and corresponding myocardial properties utilizing newly developed, chronically instrumented, awake dog models of RV volume overload (VO) and RV free-wall ischemia (IS) and a conventional model of RV pressure overload (PO).
METHODS
Sensor Implantation
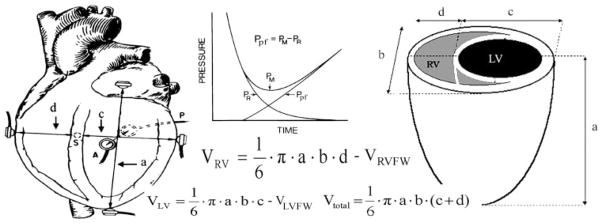
Experimental animals (20–30 kg dogs) were premedicated with cefazolin (500 mg) and iron dextran (100 mg) and anesthetized with intravenous pentobarbital (20 mg/kg) and succinylcholine (1 mg/kg). The animals were then ventilated with a respirator (model MA1, Puritan-Bennett; Los Angeles, CA). During the thoracotomy, Silastic tubes were positioned for later introduction of micromanometric catheters into the right atrium and ventricle. Sonomicrometric transducers were sewn across the base-apex, anterior-posterior, and septal-free wall axes of the left ventricle and across the RV septal-free wall axis (see Fig. 1) for derivation of dimensional data to use with the shell subtraction model (6, 18, 29). All connectors, tubes, and cables exited the chest wall through a dorsal Teflon skin button. Each dog recovered for 7–10 days before control (CL) data acquisition and induction of RV, PO, and VO. IS was induced at the end of sensor implantation.
Fig. 1.
Diagram of the instrumented dog heart demonstrating the sonomicrometric implanted sensors (left) and measured dimensions of the shell subtraction model (right). VRVFW denotes the right ventricular (RV) free wall volume, determined by water displacement during autopsy. Inset, the derivation of the passive filling pressure (Ppf) from the measured pressure (PM) by subtracting the relaxation pressure (PR). LV, left ventricular; Vtotal, total volume.
CL Data Acquisition
Lying on its right side, each dog was sedated with morphine (0.7 mg/kg) and the ultrasonic transducers were connected to a sonomicrometer (Physiologic Systems; Durham, NC) (29). Through a jugular vein cutdown, a 30-cm 8-Fr sheath was introduced into the right ventricle to allow passage of a custom-designed right heart Millar catheter (Millar Instruments; Houston, TX) with two micromanometers that were 5 cm apart. The distal micromanometer is at the tip.
Attenuation of autonomic reflexes was accomplished by intravenous propranolol and atropine. The catheter was advanced, under fluoroscopy, ensuring that the two micromanometers were located inside the right atrium and ventricle. Multiple data sets were recorded under steady-state conditions and digitized at 400 Hz. Each set was 20–30 s long to provide sufficient beats for analysis. After CL data acquisition, RV PO or VO was induced.
Induction of PO
During the thoracotomy, each animal was instrumented with a silicone rubber pneumatic occluder. The pulmonary trunk beneath the occluder was wrapped with Gore-Tex fabric (Gore and Associates; Flagstaff, AZ) to prevent rupture. The occluders were filled with hypertonic glycerin. This kept balloon volumes very stable; few leaked, and a few even swelled by drawing in fluid. We recorded the inflation volume and checked the balloon volume weekly to maintain inflation. If any leak was detected, the degree of occlusion was readjusted by using either echocardiography or catheterization. An additional check was on the volume of glycerin in the balloon, which could be briefly deflated and then reinflated with the original volume found to provide the desired RV systolic pressure. At the time of study, echocardiography and right heart catheterization confirmed stable pulmonary artery stenosis. The occluder was inflated until the peak RV systolic pressure was at least 8 kPa (60 mmHg) or approximately twice the CL level. It remained inflated throughout the study. PO data were collected 3–5 wk after its induction.
Induction of VO
At the time of thoracotomy, an 8-Fr 25-cm sheath was advanced into the right ventricle via the right jugular vein under fluoroscopy. A 6-Fr urological biopsy forceps (Circon Instruments; Santa Barbara, CA) was placed into the right ventricle and through it, and multiple passes were taken to sever the chordae, until 3–4+ tricuspid regurgitation. Tricuspid regurgitation yielded complete contrast-medium filling of the atrium within several cycles (29) and an elevation of peak RA pressures to over 15 mmHg. This was accompanied by x and y descent obliteration, elevated v waves, and/or ventricularization of the atrium (Fig. 2). The hemodynamic data were collected 2–3 wk after tricuspid regurgitation.
Fig. 2.
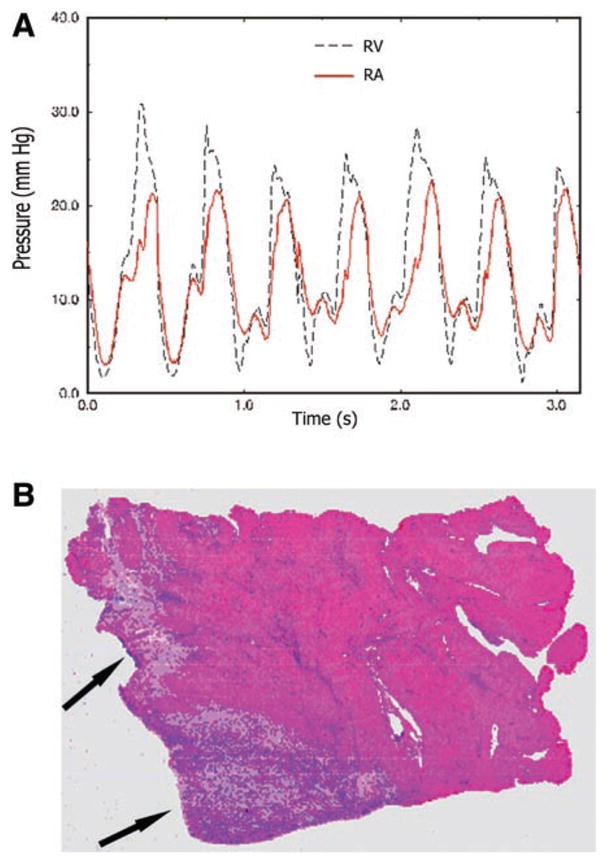
A: pressure waveforms at the time of induction of RV volume overload through surgical tricuspid chordal rupture. Note the elevation of the right atrial (RA) pressure level and the striking shape similarity between RA and RV pressures. B: hematoxylin and eosin histopathological staining. The arrows point to infarcted myocardium.
Induction of IS
IS was induced at the end of sensor implantation. This enhanced the surgeon’s ability to produce controllable IS of only the RV free wall without affecting the left ventricle. Lidocaine (50 mg iv) was administered and the right coronary artery ligated. After stabilization, multiple branches off the left anterior and posterior descending coronary arteries were ligated to limit collateral flow. IS data were collected in the second week after induction. At the time of autopsy, the condition of IS was assessed by visual inspection of infarcted myocardium. IS was confirmed by histopathological (hematoxylin and eosin) staining (Fig. 2), showing a 35% or greater infarcted cross-sectional myocardial region of the RV free wall (20).
Mathematical Modeling of RV Filling Pressure-Volume Relations
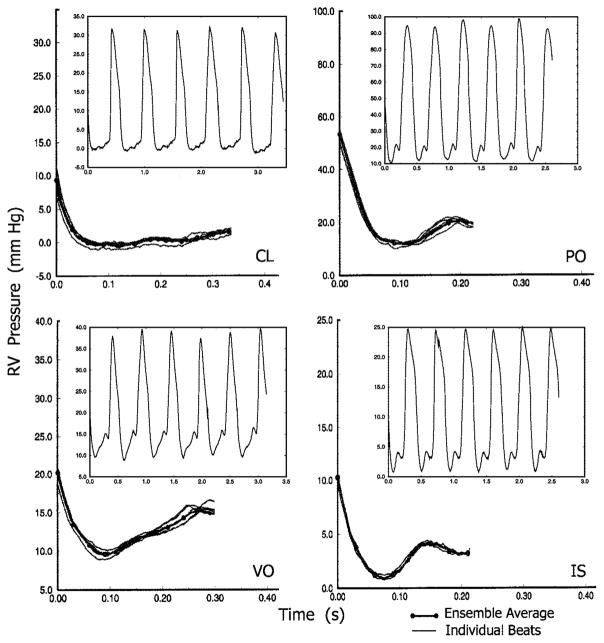
Hemodynamic data processing began with selection of steady-state beats and ensemble averaging (20). Representative ensemble averages, with individual beat tracings superimposed, are presented in Fig. 3. With the use of the ensemble-averaged RV pressure waveform, the relaxation pressure was first determined with the exponential model with asymptote, which accurately described RV isovolumic pressure decay (20). The passive filling pressure (Ppf) was then calculated (Fig. 1, inset) using the formula Ppf = PM − PR, where PM and PR are the measured and the relaxation pressure, respectively (8, 17, 21–23, 25). Once the Ppf versus RV volume (Ppf -V) relationship was calculated, regression was performed for parameter estimation in both the conventional exponential (Eq. 1) and the new sigmoidal model (Eq. 2). Sigmoidal model symbols and their definitions, including parametric variations of coefficients (parameters A–C, K1, and K2), are also shown in Figs. 4 and 6–8 and in Tables 2 and 3.
Fig. 3.
Representative ensemble averages of measured diastolic RV pressure obtained under control (CL), pressure overload (PO), volume overload (VO), and ischemia (IS) conditions. Superimposed on each ensemble average are the individual diastolic pressures in the ensemble. Insets, typical RV pressure pulse trains.
Fig. 4.
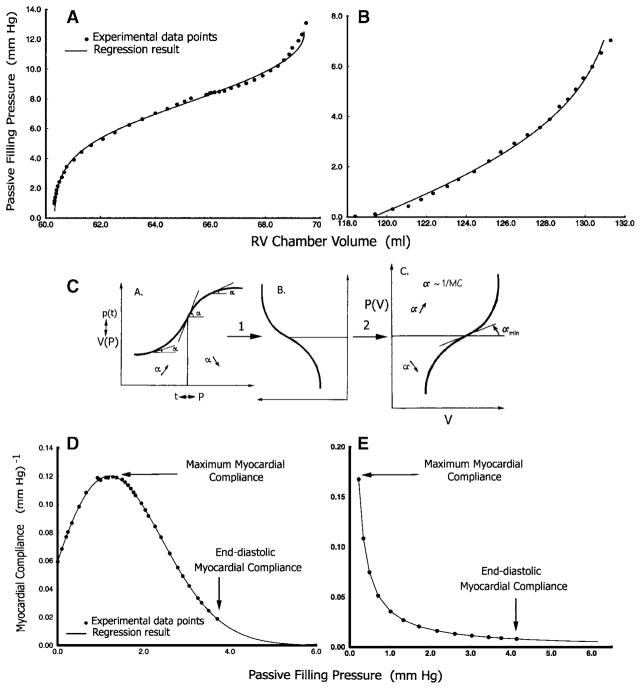
Representative shapes of Ppf -V relationships. A: sigmoidal Ppf -V in PO. B: Ppf -V in VO fitted as an exponential; this can also be viewed as the upper portion of a sigmoidal curve. Experimental data points are displayed along with the fitted curves. C: demonstration of how the sigmoidal pressure-volume [P(V)] curve is derived from the logistic curve after substituting pressure (P) for time and volume [V(P)] for population [p(t)] by a 90° counterclockwise rotation and a horizontal 180° flip. D and E: representative myocardial compliance data and curves calculated using curve-fit parameters from a sigmoidal and an exponential Ppf -V relationship, respectively. Approximate maximum and end-diastolic myocardial compliances are labeled.
Fig. 6.
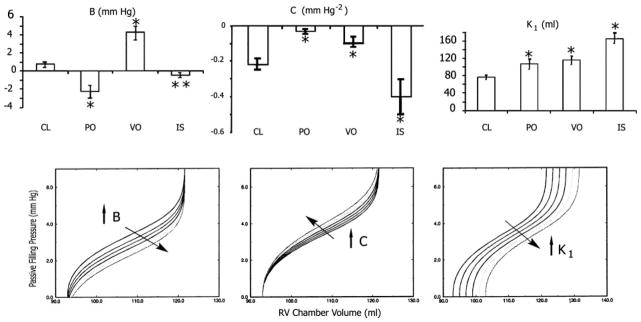
Top: all three of the RV disease modalities studied significantly changed parameters B, C, and K1 of the sigmoidal model. Bottom: the impact of corresponding parametric changes on the overall shape of the sigmoidal curve. Bottom left, an increase in B resulting in a submersion of the lower portion of the curve. As a result, the portion of the sigmoidal curve remaining above the zero pressure line may resemble an exponential. Bottom middle, an increase in C resulting in elevation with leftward rotation of the middle portion of the curve without altering the position of the asymptotes; as a result, the slope dP/dV increases, implying reduced myocardial compliance. Bottom right, an increase in K1 resulting in a parallel, rightward displacement of the entire curve to higher operating volumes.
Fig. 8.
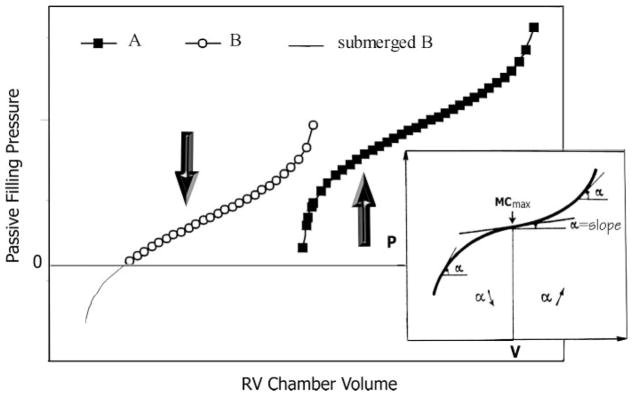
The universal sigmoidal curve: if a sigmoidal curve is displaced as shown from A to B, the portion of the overall sigmoidal Ppf -V relation actually manifested above the x-axis may appear to be quasiexponential. Inset, MCmax corresponds to the inflection point of the universal sigmoidal curve where α = dP/dV is at its minimum.
Table 2.
Changes from control in sigmoidal model parameter values
| A | B, Pa | C, kPa−2 | K1, ml | K2, ml | |
|---|---|---|---|---|---|
| Condition | |||||
| CL | −0.438±2.67 | 101±170 | −12.4±7.10 | 76.1±22.0 | −92.4±80.8 |
| PO | −0.747±2.08 | −297±216 | −1.91±1.68 | 106.5±27.0 | −46.3±35.0 |
| VO | −1.817±3.66 | 572±301 | −5.29±4.53 | 115.4±29.8 | −102±110 |
| IS | −2.086±1.76 | −60±90 | −22.3±13.2 | 165.2±28.1 | −29.7±14.6 |
Values are means ± SD. Bold values are significantly changed from CL.
Table 3.
RV myocardial compliance in PO, VO, and IS
| MCmax, kPa−1 | PMCmax, Pa | MCed, kPa−1 | PMCed, Pa | |
|---|---|---|---|---|
| Condition | ||||
| CL | 0.7276±0.217 | 315±226 | 0.0466±0.0633 | 773±346 |
| PO | 0.2850±0.382 | 1,507±785 | 0.0235±0.0254 | 2,427±973 |
| VO | 0.502±0.263 | 137±168 | 0.1770±0.1935 | 760±453 |
| IS | 0.502±0.120 | 352±227 | 0.0563±0.0689 | 680±187 |
| ANOVA | ||||
| F statistic | 5.02 | 18.73 | 3.38 | 18.52 |
| P value | 0.0060 | 0.0001 | 0.0306 | 0.0001 |
| PBonf = 0.0167 | ||||
| PO vs. CL | 0.0016 | 0.0001 | 0.2020 | 0.0001 |
| VO vs. CL | 0.0232 | 0.0407 | 0.0131 | 0.4768 |
| PHolm = 0.0250 | ||||
| IS vs. CL | 0.0102 | 0.3619 | 0.3731 | 0.2714 |
Values are means ± SD. MCmax, maximum right ventricular (RV) myocardial compliance; PMCmax, RV passive filling pressure at MCmax; MCed, end-diastolic RV myocardial compliance; PMCed, RV passive filling pressure at MCed (end diastolic). Bold values are significantly changed from CL.
| (1) |
| (2) |
The new sigmoidal function was derived from the logistic equation
by solving for Ppf in terms of V. A logistic curve is a sigmoidal (S shaped) growth curve that can be used to model functions that increase gradually at first, more rapidly in a middle growth period, and slowly at the end, leveling off at an asymptotic maximum value after some time. Such a curve is classically applied to the growth of a bacterial population, p(t), in culture as a function of time (Fig. 4C, plot A). The rate of growth accelerates as it approaches the inflection point of the curve. At the inflection point, it begins to decelerate but continues to grow until it reaches an asymptote, the “carrying capacity” for the culture environment. This forms the mechanistic basis for the sigmoidal model. Substituting pressure (P) for time and volume [V(P)], for population [p(t)], we obtain the sigmoidal P(V) curve in plot C of Fig. 4C after a 90° counterclockwise rotation (plot B), followed by a horizontal 180° flip. In the P(V) plot, the slope (α = dP/dV) is now at its minimum (α min) at the inflection point, and this corresponds to maximum MC (MCmax) (see Fig. 8, inset).
Calculation of MC
Global MC (17) was defined as
obtained by taking the derivative of the inverse function of Eqs. 1 and 2. For the simple exponential model, MC can be modeled using Eq. 3
| (3) |
Similarly, for the sigmoidal model, MC is
| (4) |
Throughout the passive filling process, both V and Ppf are positive and increasing. Equation 4, therefore, is always positive. On the right-hand side of Eq. 4, the exponential terms in the numerator and the denominator are both positive. To keep its right side positive, the signs of K2, C, and (Ppf + B) had to be selected properly and consistently, so as to fall into one of the four categories outlined in Table 4. This allowed direct comparability of the estimated model parameters.
Table 4.
Sign combinations of parameters in the sigmoidal model
| Case | Ppf + B | C | K2 |
|---|---|---|---|
| 1 | + | + | + |
| 2 | + | − | − |
| 3 | − | + | − |
| 4 | − | − | + |
Ppf, RV passive filling pressure. The impact of any individual sigmoidal parameter on the overall shape of the curve depends not only on its own value, but also on those taken by the other parameters. For comparability and consistent interpretation of changes in the sigmoidal model parameters, investigators must commit to one of the four parameter combination cases shown.
For each condition, once the sigmoidal model coefficients were obtained, RV MC was calculated point by point for the same Ppf range as in the Ppf -V relationship. The following diastolic properties were evaluated: 1) MCmax, 2) Ppf at maximum compliance (PMCmax), which demarcates the region of the curve that is concave downward from that which is concave upward, 3) MC at end diastole (MCed), and 4) the corresponding Ppf at end diastole (PMCed), which generally coincides with the clinically measured end-diastolic pressure (EDP).
Regression and Statistics Methods
Regression was performed (4) with SAS Software (SAS; Cary, NC). All data sets are presented as means ± SD. ANOVA was performed, with four groups of data being CL (n = 16), PO (n = 6), VO (n = 7), and IS (n = 6). Student’s unpaired t-test was used for significance of differences between CL and each disease state. The α-level for Student’s t-test was adjusted first with the Bonferronian inequality (2), thus using a conservative critical value for the t-statistics, to accommodate the fact that three comparisons were made against the CL set for each variable. With this adjustment, the critical level for significance, PBonf, was reduced from the usual 0.05 to 0.0167 (i.e., 0.05/3). After the first comparison at 0.0167, a subsequent comparison at PHolm = 0.0250 (0.05/2) was performed according to the Holm modification (11) of the Bonferroni procedure, which may reduce type II error compared with Bonferroni while moderating type I error compared with unmodified α-levels.
RESULTS
RV Hemodynamics
Representative steady-state RV pressure pulse tracings from CL, PO, VO, and IS are presented in Fig. 3, insets. The most distinctive difference between PO and CL was in pressure levels. While at CL the measured RV pressure decayed to around 0 kPa, the lowest level under PO remained > 1.3 kPa (10 mmHg). In addition, peak RV systolic pressure was > 12 kPa (90 mmHg) compared with <4.7 kPa (35 mmHg) at CL. Although peak RV systolic pressure in VO was not significantly higher than CL, the pressure minimum was significantly elevated to ~1.3 kPa (10 mmHg). There was also a steeper rising pressure slope during filling. In VO, the pressure difference between the peak of the a wave and the nadir of diastolic pressure was ~5 mmHg, or twice CL. The peak RV systolic pressure in IS was significantly depressed compared with CL. The magnitude of the pressure rise during diastolic filling was similar to CL.
Ppf -V Relations and MC
The diastolic Ppf -V relationship was obtained by plotting Ppf against volume. Figure 4 displays the two primary types of Ppf -V relationships observed. One is strongly sigmoidal (Fig. 4A), whereas the other appears exponential (Fig. 4B). The sigmoidal curve is the result of a sharp rise in Ppf during early filling, whereas the change in volume is disproportionately small. In the exponential Ppf -V relationship, the change in volume in early filling is large compared with that in Ppf. It is essential to note that the portion of the sigmoidal curve for Ppf >5 mmHg appears similar in shape to the exponential curve. Therefore, the exponential curve may be regarded as a sigmoidal curve partially submerged below the x-axis (Fig. 8).
Figure 4 also shows representative curves of RV MC, calculated using the results obtained from the Ppf -V relationships for CL, PO, VO, and IS. Figure 4D shows the curve resulting from the sigmoidal model (Eq. 4) and Fig. 4E shows the curve using a simple exponential model (Eq. 3). The most striking difference between these curves is the chamber volume at which MCmax occurs. For an exponential Ppf -V relationship, the maximum is found right at the beginning of the process and declines throughout the entire filling period. With the sigmoidal relationship, the MC reaches a maximum well into the filling process. The maximum in compliance corresponds to the inflection point of the sigmoidal curve. The curves derived from both models show a continuous decline in MC after their respective maxima.
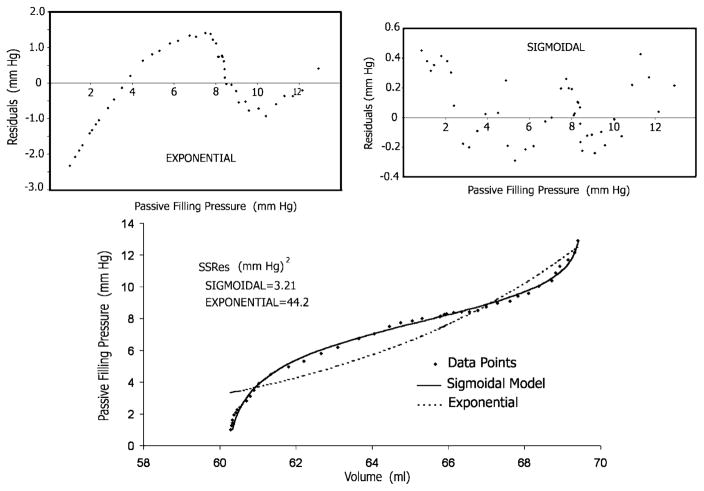
We compared the sensitivity of the conventional simple exponential model and the new sigmoidal model in detecting the changes in the Ppf -V relationship resulting from RV disease. As shown in Fig. 5, substantially better fits to the data points were obtained with the sigmoidal model than with the conventional exponential. The sum of the squares of the residuals with the former was smaller by one order of magnitude than with the latter. Moreover, as shown in Fig. 5, top, the residuals of the exponential (but not of the sigmoidal) fit are characterized by a strong correlation of sequential observations, indicating that a systematic effect is neglected by the exponential model. Statistical analysis (see Table 1) showed that in contradistinction to the sigmoidal model (see Table 1), the simple exponential model was not sensitive enough to detect the important Ppf -V alterations ensuing in RV disease. These included changes in sigmoidality and in relative elevation or depression of the Ppf -V data in the midrange of operating volume, leftward rotation, and shift to higher operating volumes. Accordingly, the data for MC derived from the exponential model were not included in further analyses. Figures 6 and 7 summarize significant changes from CL that were caused by the three RV disease modes in the sigmoidal model parameters and compliance values.
Fig. 5.
Bottom: the much closer agreement between the Ppf -V data points and the least-squares fitted curve when the sigmoidal model is used compared with the exponential. The residual sum of squares (SSRes) for the former was smaller by one order of magnitude than for the latter. Top: the residuals of the exponential fit are characterized by a strong correlation of sequential observations.
Table 1.
Statistical analysis of the exponential model compared with the sigmoidal model
| β | α | ||||
|---|---|---|---|---|---|
| Lack of significant changes in exponential parameter values | |||||
| ANOVA | |||||
| F statistic | 0.77 | 1.51 | |||
| P value | 0.5178 | 0.2290 | |||
| PBonf = 0.0167 | |||||
| PO vs. CL | 0.4352 | 0.0536 | |||
| VO vs. CL | 0.4850 | 0.3196 | |||
| PHolm = 0.0250 | |||||
| IS vs. Cl | 0.0773 | 0.0418 | |||
|
| |||||
| A | B | C | K1 | K2 | |
|
| |||||
| Significant changes in sigmoidal model parameter values | |||||
| ANOVA | |||||
| F statistic | 1.30 | 14.60 | 9.59 | 13.11 | 1.17 |
| P value | 0.2889 | 0.0001 | 0.0001 | 0.0001 | 0.3404 |
| PBonf = 0.0167 | |||||
| PO vs. CL | 0.4007 | 0.0001 | 0.0017 | 0.0065 | 0.0986 |
| VO vs. CL | 0.1514 | 0.0001 | 0.0125 | 0.0007 | 0.4015 |
| PHolm = 0.0250 | |||||
| IS vs. CL | 0.0895 | 0.0220 | 0.0161 | 0.0001 | 0.0380 |
PBonf = 0.0167 (i.e., 0.05/3), critical level for significance adjusted with the Bonferronian inequality; PHolm = 0.0250 (i.e., 0.05/2), critical level for significance adjusted according to the Holm modification; ANOVA, analysis of variance; CL, control; IS, ischemia; PO, pressure overload; VO, volume overload; α and β, exponential model parameters; A, B, C, K1, and K2, sigmoidal model parameters. Bold values denote significant change from CL.
Fig. 7.
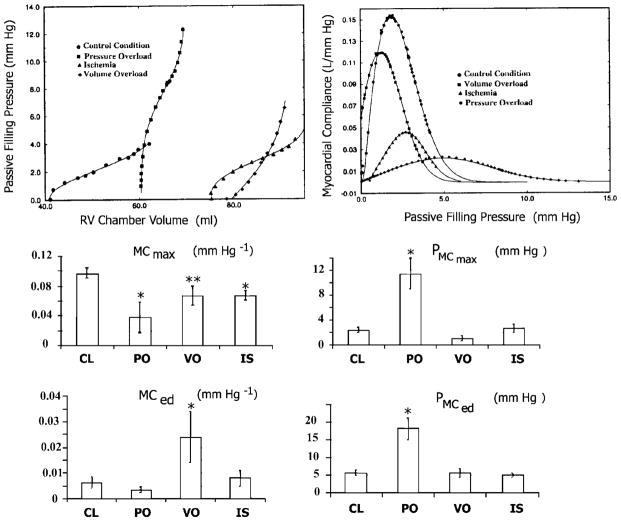
Top: representative shapes of RV Ppf -V relationships and corresponding global curves of myocardial compliance at CL, RV pressure overload, volume overload and RV free wall ischemia. Middle: changes in maximum myocardial compliance (MCmax) and the associated filling pressure (PMCmax at the inflection point). Bottom: changes in myocardial compliance (MCed) and the associated pressure (PMCed) at end diastole.
CL Condition
Table 2 shows the values of each parameter of the sigmoidal Ppf -V model. Table 3 shows the maximum and end-diastolic compliances as well as the corresponding levels of Ppf. The end-diastolic MC showed relatively wide variation. The same is true for the ratio of maximum to end-diastolic compliance. The minimum of this ratio in an individual animal was ~3. The levels of Ppf, both at the point of MCmax and at end diastole, were low.
Pressure Overload
Table 2 shows the values of each parameter of the sigmoidal model. It summarizes data for six PO animals. Similarly to CL, the signs of C, K1, and K2, are negative, positive, and negative, respectively. However, in contrast to CL, the values for B were uniformly negative in all animals. Table 3 shows diastolic properties in PO. The maximum compliance level decreased from CL. Other significant changes include the elevated PMCmax and PMCed.
Volume Overload
Table 2 summarizes the parameters of the sigmoidal model for the Ppf -V relationship. It summarizes data for seven VO animals. Similarly to CL and PO, the signs of C, K1, and K2 are negative, positive, and negative, respectively. In contrast to control, for which the signs in individual animals were mixed, individual values for B were uniformly positive. This is in even sharper contrast to PO, in which B was uniformly negative. Table 3 summarizes the findings for diastolic properties in VO. Similarly to CL, the levels of PMCmax and PMCed are low. The end-diastolic compliance shows a strongly significant increase from CL. However, noticeable variation exists in MCed and PMCmax.
Ischemia
Table 2 displays sigmoidal model parameter values for the Ppf -V relationship. Unlike CL and the other two disease states, the data for all five parameters in individual cases were uniform in sign. With the exception of K1, all parameters were negative. Similarly to PO, B values in individual animals were uniformly negative. In addition, the mean value of C is the most negative of all the RV disease models studied. It also appears that both K1 and K2 tend to increase in IS. Table 3 summarizes the analysis of MC in IS. Levels of PMCmax and PMCed are very similar to CL. The maximum compliance is decreased significantly from CL. With the exception of MCed, the diastolic properties exhibited relatively limited variation.
In summary, statistical analyses were performed on the impact of each RV disease modality on model parameters and indexes of RV diastolic function. ANOVA and Bonferroni-Holm statistics (Table 1 and Fig. 6, top) show that significant differences exist for three of the model coefficients: B, C, and K1. PO induced significant increases from CL in C and K1 and a decrease in B. VO provoked increases in B, C, and K1. IS caused a decrease in B and C from CL and an increase in K1. Coefficients A and K2 did not differ significantly from CL for any disease modality. Figure 6, bottom, shows the effects of parametric changes in each of these model coefficients on the shape and location of the sigmoidal curve on the Ppf -V plane.
Important changes in Ppf -V relations and diastolic properties are induced by the three RV failure modes (Table 3 and Fig. 7). PO alters RV MC properties more significantly than the other two conditions. It caused a decrease in RV MCmax as well as an increase in Ppf levels at both MCmax and MCed. VO exhibited a strong increase in MCed and a somewhat decreased maximal compliance compared with CL values. IS decreased the maximum compliance that was attained during the early filling process.
DISCUSSION
The material properties of the working myocardium during diastolic filling are important in the assessment of both diastolic and systolic function (24), but their determination presents challenging difficulties (8, 12, 15, 17, 21–26). A consensus has not been reached on what constitutes a correct mathematical descriptor of diastolic pressure-volume relations even for the extensively studied left ventricle. It is common practice to curve fit diastolic pressure-volume data in exponential form. Ostensibly, the reason behind the practice is because papillary muscle exhibits an exponential stress-strain relationship, so should the pressure-volume relations for the intact ventricle. This approach was adopted in 1969 by Noble et al. (19), whose work was often cited by subsequent investigators. However, even Noble cautioned that “pressure often differed from that predicted by the exponential equation,” suggesting that it is not a reliable descriptor of ventricular diastolic dynamics. In a comprehensive survey on the clinical assessment of diastolic ventricular function, Mirsky and Pasipoularides (17) noted several drawbacks of using an exponential model for pressure-volume relations during the filling period. In the present study, RV Ppf -V relations were examined on alert dogs at CL and in three models of RV disease.
Sigmoidal Model for RV Ppf -V Relations
The sigmoidal gave much better curve fits to the Ppf -V data than the exponential model. The sigmoidal curve models fittingly the dynamics of RV chamber volume, which increases gradually at first, more rapidly in the middle of its operating range, and slowly at the end, tending to level off toward a maximum value. Initially, the rate of change of volume with respect to pressure is low but it accelerates as it approaches the inflection point of the curve. At that point, the rate of change of volume begins to decelerate as the chamber volume continues to grow toward an asymptotic value. Sigmoidal pressure-volume relations had been in evidence, but not described mathematically in numerous studies involving pressure-volume data on excised blood vessels (1, 5, 16). Such sigmoidal EDP-volume relations are similarly not described explicitly but in plain evidence for both the right and the left ventricle in isolated, atrially paced, isovolumically (thin latex balloons) beating pig hearts undergoing retrograde aortic perfusion (see Fig. 5 in Ref. 14).
The most significant difference between the sigmoidal and the exponential model is that the sigmoidal model is concave toward the abscissa in the lower range of operating volume. The exponential model corresponds to the upper portion of the universal sigmoidal curve depicted in Fig. 8. Adjusting the values of the sigmoidal parameters shifts the portion of the sigmoidal curve that is concave toward the x-axis higher above or lower below the 0 Ppf level. As illustrated in Fig. 8, submerging the sigmoidal curve below the x-axis is equivalent to removing the lower operating volume segment of the sigmoidal curve. Therefore, the general sigmoidal model is robust and can describe specific Ppf -V curves manifesting an exponential form.
Quantitative Analysis of RV Diastolic Physiology
Significant changes from CL were detected and quantified in all three RV disease states by the sigmoidal model, whereas none was detected by the exponential. The increase in K1 in all three states indicates that the diseased right ventricle has increased its preload (Fig. 6) in an effort to maintain pumping, a manifestation of the Frank-Starling mechanism. Under RV PO and VO, C increased. This indicates an elevation of the Ppf -V relations in the midrange of operating volume (Fig. 6). In IS, C decreased, indicating a depression of the Ppf -V relations over the same range.
An essential advantage of using the sigmoidal equation to model the Ppf -V relation is the inclusion of the pressure shift parameter B, which effectively determines the vertical position of the curve. An upward shift (decreased B), regardless of compliance, indicates that a higher pressure is required to fill the ventricle. In the present study, most interesting changes were quantifiable by parameter B. The decrease in B in RV PO reflects a Ppf -V relationship with strongly manifest sigmoidality accruing from the rise of the universal sigmoidal curve out of the x-axis (Fig. 6). On the other hand, the increased B in VO reflects a less pronounced sigmoidality resulting from a submersion of the concave portion of the universal sigmoidal curve below the x-axis (Fig. 6). In IS, no significant change occurred in B.
In PO, higher filling pressure was required to force blood into the hypertrophied RV chamber in early filling, resulting in the increased sigmoidality of the Ppf -V relation. In VO, the change in the Ppf -V relation accrued from the increase in operating volume range, which caused a reduction in relative wall thickness. This reduction makes the right ventricle more compliant during early diastole, as manifested in the submersion of the Ppf -V curve below the x-axis (Fig. 8).
In IS, the factors considered in the previous two states work in directions opposite to each other. On one hand, there is an increase in the operating volume (i.e., reduction in relative wall thickness), resulting in a submersion of the Ppf -V relation. On the other hand, previous studies (8, 9, 17) have shown that regional hypertrophy eventually ensues under IS because nonischemic muscle compensates for pumping capability lost due to ischemic regions. On balance there was a statistically significant elevation of the Ppf -V relation, i.e., a decrease in B.
The impact of any individual sigmoidal parameter on the overall shape of the curve depends not only on its own value, but also on the values taken by the other parameters. To obtain comparability and a consistent interpretation of changes in the sigmoidal parameters, investigators must commit to one of the four parameter-combination cases shown in Table 4, because the impact of individual parameters on the overall curve is case dependent. This is another manifestation in cardiac mechanics of the critical need to pay attention to the range of applicability of model parameters (22). In the present study, the sign combination of parameters B, C, and K2 corresponded to case 2.
Myocardial Compliance
Myocardial viscoelastic creep and compliance
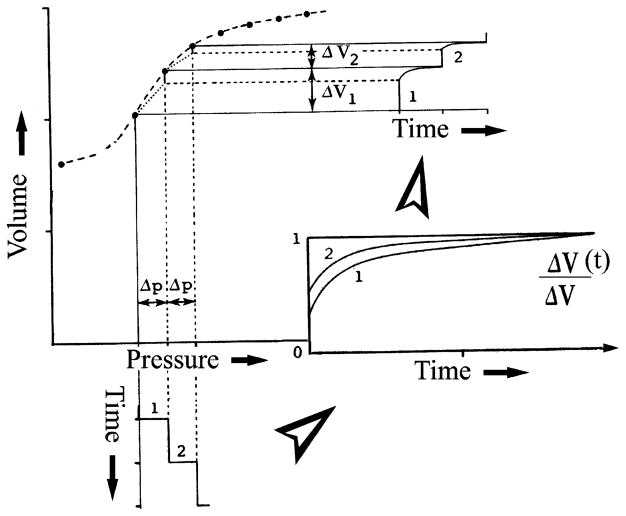
The aspect differentiating the sigmoidal from the exponential model is that the sigmoidal curve is concave toward the abscissa in the lower range of operating volume. The behavior evident in the lower portion of the sigmoidal curve may be conceived as a manifestation of viscoelastic creep. In general, viscoelastic behavior may be imagined as a spectrum having the elastic deformation as one limiting case and viscous flow the other extreme, with changeable combinations of the two spread over the intervening range. Thus viscoelastic creep embodies response patterns that characterize behavior blends of elastic deformation and viscous flow. According to the Boltzmann superposition principle (7), the behavior of a viscoelastic material loaded in a series of steps can be analyzed by summation of the time-dependent effects of each step. The creep deformation ε(t) is thus determined for incremental loads Δσ1, Δσ2, Δσ3,… applied at times t1, t2, and t3, … as
| (5) |
where J(t − t1) is the creep-response function that is analogous to compliance. Therefore, the deformation response of the viscoelastic myocardium is not manifested instantaneously in response to applied load; moreover, at any time t, it depends on all of the foregoing series of loading steps up to that time. Figure 9 provides a simplified depiction of the phenomenon using two pressure loading steps in time, the incremental viscoelastic response to each of them (inset) and the resulting chamber volume response in the pressure-volume diagram. In view of these considerations, it is to be expected that evaluation of myocardial diastolic properties is more likely to be clinically useful when it involves compliance curves spanning the entire diastolic period, as is shown in Figs. 4 and 6. With this in mind, the examination of specific indexes derived from such curves (MCmax, MCed, etc.) is operationally helpful in evaluating diastolic function in a clinical setting, as is illustrated in a subsequent segment.
Fig. 9.
Schematic representation of how a highly nonlinear pressure-volume curve embodies superposition of consecutive viscoelastic (time dependent) responses to successively imposed pressure steps. ΔV(t), time-dependent change in volume.
Morphomechanical correlations
It is premature at present to attempt to identify structural components of the RV muscle with the exhibited viscoelastic response because much more information is required for such an identification. A very broad interpretation of the viscoelastic relaxed myocardial response may, however, be offered: the viscoelastic creep embodies response patterns that characterize the interactions of elastic myocyte, elastin, and collagenous connective tissue formed elements with the viscous cardiac myocyte intracellular and tissue fluids. Furthermore, it is instructive to recall the demonstration by H. B. Bull in Remington’s (27) classic book on tissue elasticity that although a single nylon fiber is elastic, a stocking woven from nylon fibers exhibits viscoelastic behavior. Viscoelasticity may result from the histoarchitectonic rearrangement of elastic and viscous structural elements of RV muscle in response to the imposed pressure load.
Clinical implications of MC changes
The present study showed that the passive compliance of RV muscle changed significantly as a result of PO, VO, and IS. PO and IS resulted in decreased MCmax. Decreased MCmax in early diastole will have the direct clinical consequence of increasing central venous pressure and, in turn, decreasing cardiac output. Both of these effects will be exacerbated at higher heart rates. Because the Ppf -V relations were shifted upward in PO, the pressure levels applying at MCmax and at end diastole were both significantly increased, again tending to elevate central venous pressure clinically. In VO, a significant increase in operating end-diastolic compliance was observed, whereas the level of EDP remained unchanged. This is consistent with the increase in C observed in the Ppf -V relations, which causes an elevation of the middle segment of the sigmoidal curve. This is complemented by a reduction in the slope of the final segment of the curve and an increased end-diastolic compliance. Because of this diastolic compliance rise in VO there may be less of a tendency to elevate central venous pressure than in PO or IS. In VO due to tricuspid regurgitation it may be the regurgitant tricuspid flow (v wave) itself that will directly elevate central venous pressure and impair forward cardiac output.
In conclusion, this study is the first to characterize RV Ppf -V relations throughout diastole and the first to fit the relations with a sigmoidal function. MC curves were calculated from the sigmoidal function over the entire filling period. The new model parameters and related diastolic properties allowed accurate quantitative assessment of RV diastolic function abnormalities in canine surgical models of subacute RV free wall IS, PO, and VO. The method allows for a more complete evaluation of the diastolic properties of viscoelastic myocardium in the beating heart. Application of the new sigmoidal model to clinical investigations of ventricular diastolic function should provide a more sensitive diagnosis and a more thorough and quantitative pathophysiological characterization of diastolic property changes attendant to normal (aging) and abnormal disease states, involving both the right and the left ventricle, than those possible using the conventional exponential approach.
Acknowledgments
This work was supported in part by National Heart, Lung, and Blood Institute Grant R01-HL-50446 (to A. Pasipoularides) and the Duke/National Science Foundation Engineering Research Center for Emerging Cardiovascular Technologies.
References
- 1.Bader H. Handbook of Physiology. Circulation. II, chapt. 26. Washington, DC: Am. Physiol. Soc; 1963. The anatomy and physiology of the vascular wall; pp. 865–889. [Google Scholar]
- 2.Bland JM, Altman DG. Statistics notes: multiple significance tests: the Bonferroni method. BMJ. 1995;310:170. doi: 10.1136/bmj.310.6973.170. [DOI] [PMC free article] [PubMed] [Google Scholar]
- 3.Carabello BA, Crawford FA., Jr Valvular heart disease. N Engl J Med. 1997;337:32–41. doi: 10.1056/NEJM199707033370107. [DOI] [PubMed] [Google Scholar]
- 4.Chambers JM, Bates DM. Nonlinear models. In: Chambers DM, Hastie TJ, editors. Statistical Models in S. New York: Chapman and Hall; 1990. pp. 421–455. [Google Scholar]
- 5.Cox RH. Passive mechanics and connective tissue composition of canine arteries. Am J Physiol Heart Circ Physiol. 1978;234:H533–H541. doi: 10.1152/ajpheart.1978.234.5.H533. [DOI] [PubMed] [Google Scholar]
- 6.Feneley MP, Elbeery JR, Gaynor JW, Gall SA, Jr, Davis JW, Rankin JS. Ellipsoidal shell subtraction model of right ventricular volume. Comparison with regional free wall dimensions as indexes of right ventricular function. Circ Res. 1990;67:1427–1436. doi: 10.1161/01.res.67.6.1427. [DOI] [PubMed] [Google Scholar]
- 7.Ferry JD. Viscoelastic Properties of Polymers. New York: Wiley; 1980. [Google Scholar]
- 8.Gelpi RJ, Pasipoularides A, Lader AS, Patrick TA, Chase N, Hittinger L, Shannon RP, Bishop SP, Vatner SF. Changes in diastolic cardiac function in developing and stable perinephritic hypertension in conscious dogs. Circ Res. 1991;68:555–567. doi: 10.1161/01.res.68.2.555. [DOI] [PubMed] [Google Scholar]
- 9.Grossman W. Diastolic function and heart failure: an overview. Eur Heart J. 1990;11:2–7. doi: 10.1093/eurheartj/11.suppl_c.2. [DOI] [PubMed] [Google Scholar]
- 10.Hines R. Right ventricular function and failure: a review. Yale J Biol Med. 1991;64:295–307. [PMC free article] [PubMed] [Google Scholar]
- 11.Holm S. A simple sequentially rejective multiple test procedure. Scand J Stat. 1979;6:65–70. [Google Scholar]
- 12.Ihara T, Shannon RP, Komamura K, Pasipoularides A, Patrick T, Shen YT, Vatner SF. Effects of anaesthesia and recent surgery on diastolic function. Cardiovasc Res. 1994;28:325–336. doi: 10.1093/cvr/28.3.325. [DOI] [PubMed] [Google Scholar]
- 13.Jain D, Zaret BL. Assessment of right ventricular function. Cardiol Clin. 1992;10:23–39. [PubMed] [Google Scholar]
- 14.Joyce JJ, Ross-Ascuitto NT, Ascuitto RJ. A direct comparison of right and left ventricular performance in the isolated neonatal pig heart. Pediatr Cardiol. 2000;21:216–222. doi: 10.1007/s002460010043. [DOI] [PubMed] [Google Scholar]
- 15.Komamura K, Shannon RP, Pasipoularides A, Ihara T, Lader AS, Patrick TA, Bishop SP, Vatner SF. Alterations in left ventricular diastolic function in conscious dogs with pacing-induced heart failure. J Clin Invest. 1992;89:1825–1838. doi: 10.1172/JCI115787. [DOI] [PMC free article] [PubMed] [Google Scholar]
- 16.Ling SC, Atabek HB. Nonlinear analysis of pulsatile flow in arteries. J Fluid Mech. 1972;55:493–511. [Google Scholar]
- 17.Mirsky I, Pasipoularides A. Clinical assessment of diastolic function. Prog Cardiovasc Dis. 1990;32:291–318. doi: 10.1016/0033-0620(90)90018-w. [DOI] [PubMed] [Google Scholar]
- 18.Mirsky I, Pasipoularides A. Elastic properties of normal and hypertrophied cardiac muscle. Fed Proc. 1980;39:156–161. [PubMed] [Google Scholar]
- 19.Noble NIM, Milne ENC, Coerke RJ, Carlsson E, Domenech RJ, Saunders KB, Hoffman JIE. Left ventricular filling and diastolic pressure-volume relations in conscious dogs. Circ Res. 1969;24:269–283. doi: 10.1161/01.res.24.2.269. [DOI] [PubMed] [Google Scholar]
- 20.Pasipoularides AD, Shu M, Shah A, Glower DD. Right ventricular diastolic relaxation in conscious dog models of pressure overload, volume overload and ischemia. J Thorac Cardiovasc Surg. doi: 10.1067/mtc.2002.126677. In press. [DOI] [PMC free article] [PubMed] [Google Scholar]
- 21.Pasipoularides A, Mirsky I, Hess OM, Grimm J, Krayenbuehl HP. Myocardial relaxation and passive diastolic properties in man. Circulation. 1986;74:991–1001. doi: 10.1161/01.cir.74.5.991. [DOI] [PubMed] [Google Scholar]
- 22.Pasipoularides A, Mirsky I. Models and concepts of diastolic mechanics: pitfalls in their misapplication. Math Comp Model. 1988;11:232–234. [Google Scholar]
- 23.Pasipoularides A. Cardiac mechanics: basic and clinical contemporary research. Ann Biomed Eng. 1992;20:3–17. doi: 10.1007/BF02368503. [DOI] [PubMed] [Google Scholar]
- 24.Pasipoularides A. On mechanisms of improved ejection fraction by early reperfusion in acute myocardial infarction: myocardial salvage or infarct stiffening? J Am Coll Cardiol. 1988;12:1037–1038. doi: 10.1016/0735-1097(88)90473-1. [DOI] [PubMed] [Google Scholar]
- 25.Paulus WJ, Grossman W, Serizawa T, Bourdillon PD, Pasipoularides A, Mirsky I. Different effects of two types of ischemia on myocardial systolic and diastolic function. Am J Physiol Heart Circ Physiol. 1985;248:H719–H728. doi: 10.1152/ajpheart.1985.248.5.H719. [DOI] [PubMed] [Google Scholar]
- 26.Paulus WJ, Vantrimpont PJ, Rousseau MF. Diastolic function of the nonfilling human left ventricle. J Am Coll Cardiol. 1992;20:1524–1532. doi: 10.1016/0735-1097(92)90446-t. [DOI] [PubMed] [Google Scholar]
- 27.Remington JW. Tissue Elasticity. Baltimore, MD: Waverly; 1957. pp. 33–42. [Google Scholar]
- 28.Rigolin VH, Robiolio PA, Wilson JS, Harrison JK, Bashore TS. The forgotten chamber: the importance of the right ventricle. Cathet Cardiovasc Diagn. 1995;35:18–28. doi: 10.1002/ccd.1810350105. [DOI] [PubMed] [Google Scholar]
- 29.Shah AS, Atkins BZ, Hata JA, Tai O, Kypson AP, Lilly RE, Koch WJ, Glower DD. Early effects of right ventricular volume overload on ventricular performance and β-adrenergic signaling. J Thorac Cardiovasc Surg. 2000;120:342–349. doi: 10.1067/mtc.2000.107278. [DOI] [PubMed] [Google Scholar]


