Abstract
TGF-β is a key profibrotic factor, but targeting TGF-β to prevent fibrosis also abolishes its protective anti-inflammatory effects. Here, we investigated the hypothesis that we can redirect TGF-β signaling by preventing downstream profibrotic interaction of β-catenin with T cell factor (TCF), thereby enhancing the interaction of β-catenin with Foxo, a transcription factor that controls differentiation of TGF-β induced regulatory T cells (iTregs), and thus, enhance anti-inflammatory effects of TGF-β. In iTregs derived from EL4 T cells treated with recombinant human TGF-β1 (rhTGF-β1) in vitro, inhibition of β-catenin/TCF transcription with ICG-001 increased Foxp3 expression, interaction of β-catenin and Foxo1, binding of Foxo1 to the Foxp3 promoter, and Foxo transcriptional activity. Moreover, the level of β-catenin expression positively correlated with the level of Foxo1 binding to the Foxp3 promoter and Foxo transcriptional activity. T cell fate mapping in Foxp3gfp Ly5.1/5.2 mice revealed that coadministration of rhTGF-β1 and ICG-001 further enhanced the expansion of iTregs and natural Tregs observed with rhTGF-β1 treatment alone. Coadministration of rhTGF-β1 with ICG-001 also increased the number of Tregs and reduced inflammation and fibrosis in the kidney fibrosis models of unilateral ureteric obstruction and ischemia-reperfusion injury. Notably, ICG-001 prevented the fibrosis in distant organs (lung and liver) caused by rhTGF-β1. Together, our results show that diversion of β-catenin from TCF- to Foxo-mediated transcription inhibits the β-catenin/TCF–mediated profibrotic effects of TGF-β while enhancing the β-catenin/Foxo–mediated anti-inflammatory effects. Targeting β-catenin/Foxo may be a novel therapeutic strategy in the treatment of fibrotic diseases that lead to organ failure.
Keywords: chronic kidney disease, fibrosis, TGF-β
Fibrosis is an inevitable outcome of all chronic inflammatory diseases, such as CKDs, characterized with progressive parenchymal destruction leading to kidney failure.1 TGF-β plays a crucial role in the progression of organ fibrosis.2–4 However, therapies blocking TGF-β have been proven ineffective in clinical trials, including in kidney disease,5,6 consistent with the pleiotropic actions of TGF-β7; TGF-β is also a most potent anti-inflammatory cytokine.8,9 Inhibition of TGF-β will increase inflammation8,10 and thus, fibrosis.11,12 The multiple roles of TGF-β have been a dilemma for several decades, preventing the therapeutic use and targeting of TGF-β for human diseases.7,13
Recent studies revealed that β-catenin is a common transcription cofactor in various signaling pathways of TGF-β, with relative activity that depends on the transcription partners binding β-catenin. When β-catenin binds to the T cell factor (TCF), it promotes cell proliferation. However, after binding to Foxo, β-catenin/Foxo leads to cell cycle arrest, promoting cell survival under oxidative stress14,15; β-catenin/TCF is central to all profibrotic pathways, namely TGF-β/Smad, integrin/ILK, and Wnt/β-catenin pathways, converging at activation of β-catenin via β-catenin/TCF.16 Foxo is known to compete with TCF in binding β-catenin,15,17,18 and β-catenin binding enhances Foxo’s transcriptional activity in cancer cells.17 Importantly, Foxo is a newly identified, potent transcription factor for TGF-β induced regulatory T cells (iTregs), which are central to TGF-β’s anti-inflammatory function. We hypothesized that inhibition of β-catenin/TCF binding would prevent the profibrotic effects of TGF-β and at the same time, increase β-catenin/Foxo interaction, enhancing Foxo’s action on regulatory T cells (Tregs) and consequent anti-inflammatory action of TGF-β.
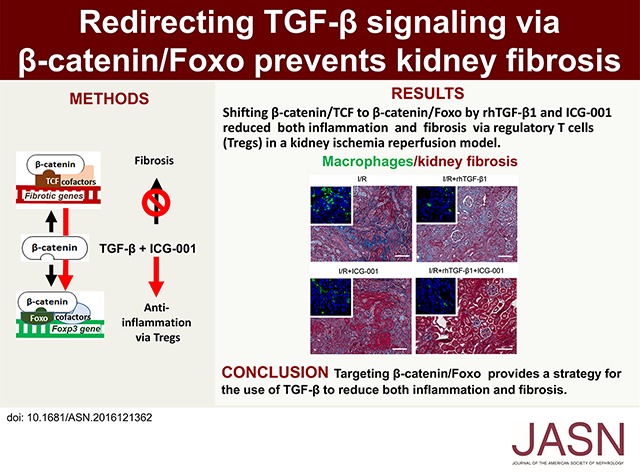
We tested the hypothesis in recombinant human TGF-β1 (rhTGF-β1) iTregs in vitro and then, in the kidney fibrosis models of unilateral ureteral obstruction (UUO) and kidney ischemia/reperfusion (I/R). We showed that inhibiting β-catenin/TCF interaction using ICG-001 enhanced rhTGF-β1 iTregs systemically and in the kidney interstitium, thus reducing inflammation and further reducing kidney fibrosis.
Results
β-Catenin Promotes TGF-β iTregs by Binding to Foxo1
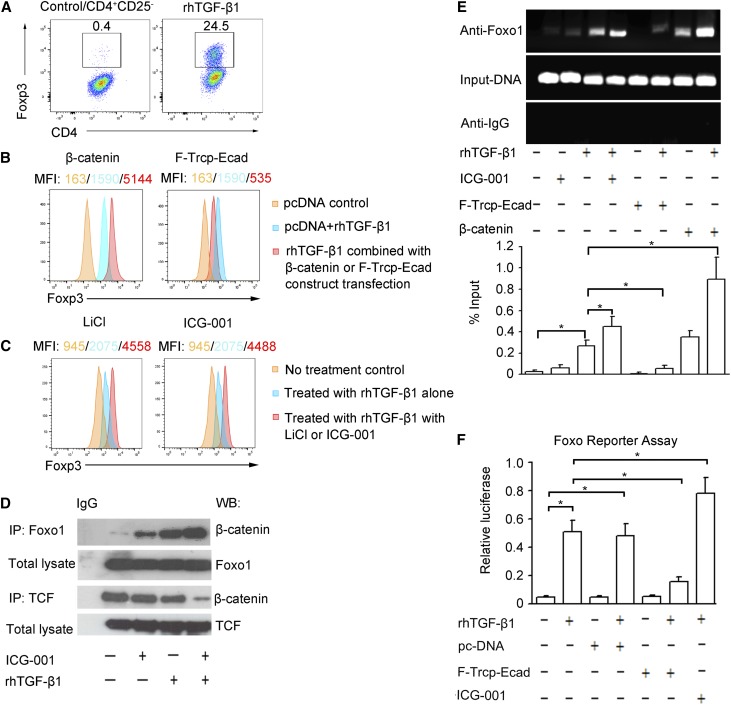
We first investigated the role of β-catenin in rhTGF-β1 iTregs. rhTGF-β1 significantly upregulated Foxp3 expression, the master transcription factor of Tregs, in iTreg induction from CD4+CD25− T cells (Figure 1A). In the EL4 T lymphocyte cell line, overexpression of β-catenin significantly increased Foxp3 expression, whereas targeted degradation of cytoplasmic β-catenin by F-Trcp-Ecad chimera markedly decreased Foxp3 levels (Figure 1B). Stabilization of β-catenin by LiCl (20 mM) and importantly, inhibition of β-catenin/TCF by ICG-001 (5 μM) also increased Foxp3 levels (Figure 1C), suggesting a negative regulation of Foxp3 expression by β-catenin/TCF. Foxo proteins are known to control the differentiation of Foxp3+ Tregs.19,20 We showed that inhibition of Foxo by its inhibitor AS1842856 reduced rhTGF-β1–induced Foxp3 expression in EL4 cells (Supplemental Figure 1). These results show an active role for β-catenin in TGF-β–induced Foxp3 expression in iTregs.
Figure 1.
β-catenin controls Foxp3 expression by binding to Foxo1 in TGF-β iTregs. (A) Flow cytometry analysis of Foxp3 in rhTGF-β1 iTregs arising from CD4+CD25− T cells. (B) Representative histogram analyses of Foxp3 in rhTGF-β1 iTregs arising from EL4 cells transfected with constructs of β-catenin or F-Trcp-Ecad (β-catenin degradation chimera). (C) Representative histogram analyses of Foxp3 in rhTGF-β1 iTregs arising from EL4 cells treated with LiCl or ICG-001. MFI, mean fluorescence intensity. (D) Lysates from nuclear extracts of EL4 cells immunoprecipitated with anti-IgG, anti-Foxo1, or anti-TCF antibodies and analyzed by Western blot using an anti–β-catenin antibody. IP, immunoprecipitation; WB, Western blot. (E) ChIP results for Foxo1 association with Foxp3 regulatory elements in rhTGF-β1–induced EL4 cells after treatment with plasmids of β-catenin or F-TrCP-Ecad transfection or with ICG-001. Quantitative ChIP data are presented. Data were normalized against input DNA and are presented as fold change. *P<0.05. (F) Foxo transcription activity measured by Foxo reporter using duo luciferase assay. *P<0.05.
To test that β-catenin promotes Tregs by binding to Foxo1, we coimmunoprecipitated Foxo1 or TCF with β-catenin from nuclear extracts of EL4 cells. The results show that rhTGF-β1 (10 ng/ml) promoted the association of Foxo1 with β-catenin (Figure 1D). However, the amount of TCF-associated β-catenin was not affected by rhTGF-β1 treatment. ICG-001 is known to inhibit β-catenin/TCF transcription by selectively blocking β-catenin/CBP interaction.21 We found here that ICG-001 also reduced β-catenin/TCF binding, while it increased the binding of β-catenin to Foxo1 in rhTGF-β1–treated EL4 cells (Figure 1D). This result shows that TCF competes with Foxo1 in binding to β-catenin in TGF-β–induced Foxp3 expression.
To investigate the mechanisms by which β-catenin regulates TGF-β iTregs, we examined the effect of β-catenin on Foxo1 binding to Foxp3 promoter by chromatin immunoprecipitation (ChIP) assay using Foxo1 antibody. rhTGF-β1 (10 ng/ml) increased Foxo1 binding to Foxp3 promoter (Figure 1E). Overexpression of β-catenin by transfection of β-catenin–expressing construct or inhibition of β-catenin/TCF by ICG-001 increased Foxo1 binding to Foxp3 promoter, whereas targeted degradation of cytoplasmic β-catenin by F-Trcp-Ecad markedly reduced its binding to Foxp3 promoter in rhTGF-β1–stimulated EL4 cells (Figure 1E). These results clearly show that β-catenin promotes Foxo1 binding to Foxp3 promoter in TGF-β iTregs.
In a functional Foxo reporter assay, we showed that rhTGF-β1 (10 ng/ml) significantly increased Foxo-luc activity (Figure 1F). Targeted degradation of cytoplasmic β-catenin by F-Trcp-Ecad gene transfer markedly reduced Foxo-luc transcriptional activity in rhTGF-β1–treated EL4 cells. Conversely, Foxo reporter activity was enhanced when β-catenin/TCF was inhibited by ICG-001 (Figure 1F). We conclude that β-catenin is required for Foxo transcriptional activation of Foxp3 in TGF-β iTregs.
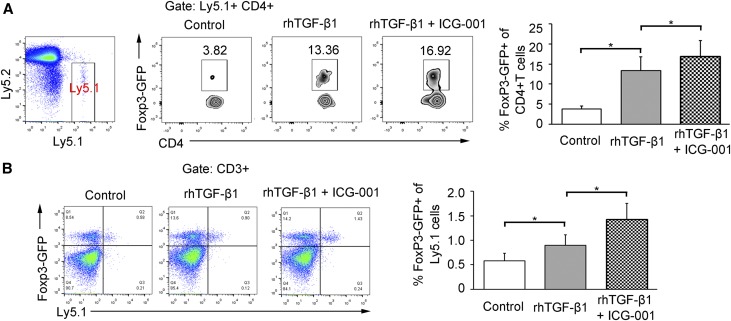
By T cell fate mapping, we examined whether inhibition of β-catenin/TCF interaction by ICG-001 could increase TGF-β iTregs or natural regulatory T cells (nTregs) in vivo. Foxp3green fluorescent protein (Foxp3gfp) Ly5.2 mice were adoptively transferred with green fluorescent protein− (GFP−) naïve CD4+ T cells or GFP+CD4+ T cells (nTregs) sorted from Foxp3gfp Ly5.1 mice and then treated with rhTGF-β1 (50 μg/kg intraperitoneally) with or without ICG-001 (5 mg/kg intraperitoneally) for 1 week. We showed by gating on Ly5.1 that these transferred Ly5.1 GFP−CD4+ T cells expressed a minimal level of GFP in untreated Ly5.1/Ly5.2 Foxp3gfp mice. rhTGF-β1 treatment induced them into GFP+ iTregs to a much greater extent. When β-catenin/TCF interaction was inhibited by ICG-001, the proportion of the GFP+ iTregs further increased (Figure 2A). By tracing GFP+CD4+ Ly5.1 T cells, these adoptively transferred nTregs were expanded in the Foxp3gfp Ly5.1/Ly5.2 mice by TGF-β treatment and further increased by the combined TGF-β plus ICG-001 treatment (Figure 2B). These results show that inhibition of β-catenin/TCF interaction increased TGF-β iTregs and nTregs.
Figure 2.
T cell fate mapping of GFP−CD4+ or GFP+CD4+ T cells from Ly5.1 mice adoptively transferred into Ly5.2 mice. (A) In vivo fate mapping of iTregs. Plots are representative of three independent experiments performed in triplicate. Plots are gated on Ly5.1+ cells. Data are presented as means±SEM. Statistical significance was determined by one-way ANOVA followed by Tukey post hoc test. *P<0.05. (B) In vivo fate mapping of nTregs. Data are presented as means±SEM. Statistical significance was determined by one-way ANOVA followed by Tukey post hoc test. *P<0.05.
TGF-β1–Induced Smad Reporter Activity Does Not Involve β-Catenin/Smad3 or β-Catenin/TCF Interaction in EL4 Cells
Because TGF-β–induced Foxp3 expression is dependent on Smad signaling,22 we investigated whether TGF-β/Smad signaling was affected by β-catenin in TGF-β iTregs using an SMAD reporter assay. Smad-dependent luciferase activities significantly increased by rhTGF-β1 treatments (Supplemental Figure 2). Neither degradation of cytoplasmic β-catenin using F-Trcp-Ecad chimera (Supplemental Figure 2A) nor disruption of β-catenin/TCF interaction using ICG-001 (Supplemental Figure 2B) had any effect on rhTGF-β1–induced Smad reporter activities. These results show that TGF-β/Smad signaling in iTregs does not involve β-catenin/Smad3 or β-catenin/TCF interaction.
rhTGF-β1 and ICG-001 Combined Treatment Reduces Inflammation in UUO and I/R Mice by Induction of Tregs
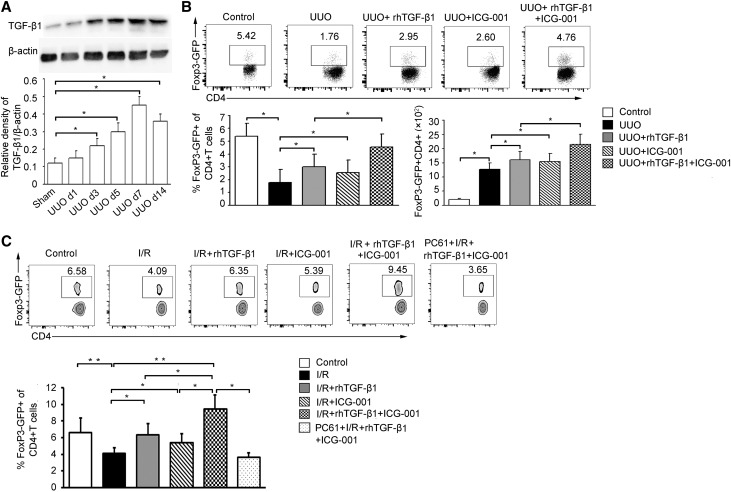
We then investigated whether β-catenin/TCF inhibition could increase the rhTGF-β1 iTregs and thereby, inhibit inflammation and subsequent kidney fibrosis in vivo. We first examined TGF-β1 levels in the obstructed kidney, showing that the TGF-β1 was increased, starting from day 1 after UUO. It peaked at 7 days after UUO and maintained a high level on day 14 (Figure 3A).
Figure 3.
Shift of β-catenin from TCF to Foxo increases TGF-β iTregs. (A) TGF-β1 expression in the obstructed kidney of UUO mice on days 1, 3, 5, 7, and 14. Representative immunoblots of total kidney protein lysates showing increased expression of TGF-β1 protein. The bar graph shows TGF-β1 band density normalized to β-actin. Statistical significance was determined by one-way ANOVA followed by Tukey post hoc test (n=6 per group). *P<0.05. (B) Representative flow cytometry plots (gating on CD3+ CD4+ cells) showing the percentage and bar graphs showing the percentage and the absolute number of Tregs in the obstructed kidney on day 3 after UUO (one of five experiments is shown). A pool of infiltrating cells from two kidneys in each group was analyzed. Statistical significance was determined by one-way ANOVA followed by Tukey post hoc test (n=6 per group). *P<0.05. (C) Representative flow cytometry plots (gating on CD3+ CD4+ cells) and bar graphs showing the percentage of Tregs in the blood on day 7 after I/R (one of five experiments is shown). Statistical significance was determined by one-way ANOVA followed by Tukey post hoc test. All data are expressed as the means±SEM. *P<0.05; **P<0.01.
Although TGF-β1 expression increased 3 days after UUO, the percentage of GFP+CD4+Foxp3+ (Treg) cells decreased in the obstructed kidney (Figure 3B). Both the frequency and the absolute number of Tregs in obstructed kidney were increased in rhTGF-β1–treated (50 μg/kg) UUO mice compared with untreated controls. These results indicate that increased endogenous TGF-β1 was insufficient to induce an effective level of Tregs during the inflammatory stage of UUO. Importantly, combined treatment with rhTGF-β1 and ICG-001 further increased the proportion and number of Tregs compared with rhTGF-β1–only treatment (Figure 3B). These results indicate that TGF-β alone is able to induce Tregs in UUO, and shifting of β-catenin from TCF to Foxo further increased Treg numbers. The systemic anti-inflammatory effects were then assessed by analysis of Tregs in splenocytes of UUO mice. Flow cytometry analysis revealed decreased proportions but increased absolute numbers of Tregs in spleens of untreated UUO mice compared with sham controls. rhTGF-β1 treatment increased the Treg population. In the rhTGF-β1 and ICG-001 combined treatment group, there was a further increase of Tregs at both day 3 (Supplemental Figure 3A) and day 7 (Supplemental Figure 4). Given the progressive interstitial inflammatory fibrosis induced by ureteric obstruction and reported minor role for Tregs in the UUO model, we extended our study by using kidney I/R injury, another fibrotic model with a more prominent role for Tregs.23,24 Use of Foxp3gfp mice allowed us to analyze Tregs not only among kidney infiltrating cells but also, in peripheral blood samples without euthanizing the experimental mice. The percentage of Foxp3GFP+ Tregs in blood decreased significantly 7 days after I/R injury. rhTGF-β1 treatment increased Treg numbers. Combined treatment with rhTGF-β1 and ICG-001 further increased the Treg population (Figure 3C) in I/R mice.
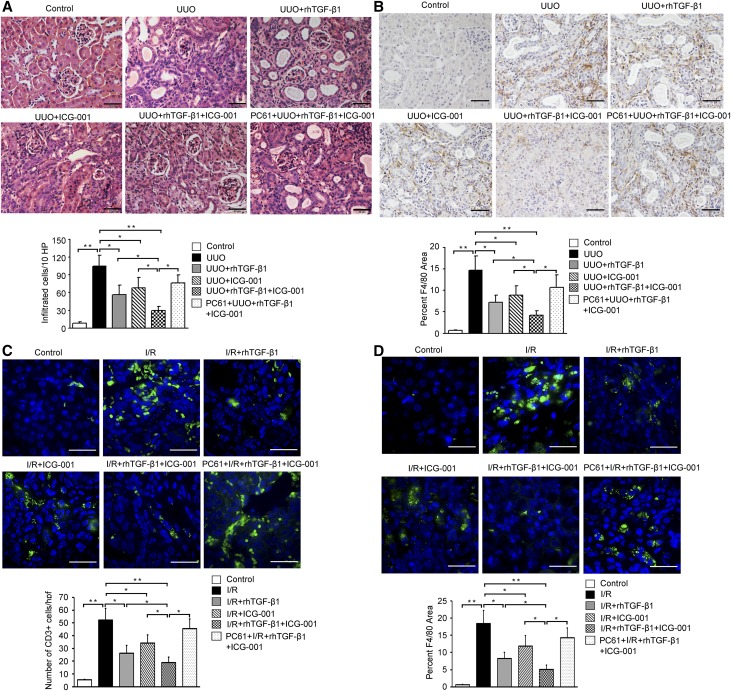
Next, we evaluated inflammatory cell infiltration in UUO and I/R kidneys. Marked interstitial inflammation was shown by hematoxylin and eosin, F4/80+ macrophage, and CD3 staining (Figure 4, A and B, Supplemental Figure 3B) in the obstructed kidney in untreated UUO mice. rhTGF-β1 treatment significantly reduced inflammatory cell infiltration. ICG-001 alone also inhibited inflammatory cell infiltration, but rhTGF-β1 and ICG-001 combined treatment caused a greater inhibition of inflammatory cell infiltration than treatment with either rhTGF-β1 or ICG-001 alone (Figure 4, A and B, Supplemental Figure 3B). In I/R kidney, CD3+ cell and macrophage infiltration was also prominent (Figure 4, C and D). rhTGF-β1 suppressed interstitial CD3+ cells and macrophage infiltration, whereas ICG-001–only treatment did so to a lesser extent. Combined treatment with rhTGF-β1 and ICG-001 further reduced the number of CD3+ cells and macrophages in I/R kidney (Figure 4, C and D).
Figure 4.
Shift of β-catenin from TCF to Foxo reduces inflammation. (A) Representative hematoxylin and eosin staining and quantitation of infiltrating cells in the kidney of UUO mice (n=6 per group). Original magnification, ×40. Scale bars, 50 μm. *P<0.05; **P<0.01. (B) Representative immunohistochemical staining and quantitation for macrophage infiltration (F4/80+) in the kidney of UUO mice (n=6 per group). Data are presented as means±SEM. Statistical significance was determined by one-way ANOVA followed Tukey post hoc test. Original magnification, ×20. Scale bars, 50 μm. *P<0.05; **P<0.01. (C) Representative immunofluorescence staining and quantitation of CD3+ T cell infiltration in the kidney of I/R mice (n=6 per group). Statistical significance was determined by one-way ANOVA followed by Tukey post hoc test. All data are expressed as the means±SEM. Original magnification, ×40. Scale bars, 100 μm. *P<0.05; **P<0.01. (D) Representative immunofluorescence staining and quantitation of macrophage infiltration in the kidney of I/R mice (n=6 per group). Statistical significance was determined by one-way ANOVA followed by Tukey post hoc test. All data are expressed as the means±SEM. Original magnification, ×40. Scale bars, 100 μm. *P<0.05; **P<0.01.
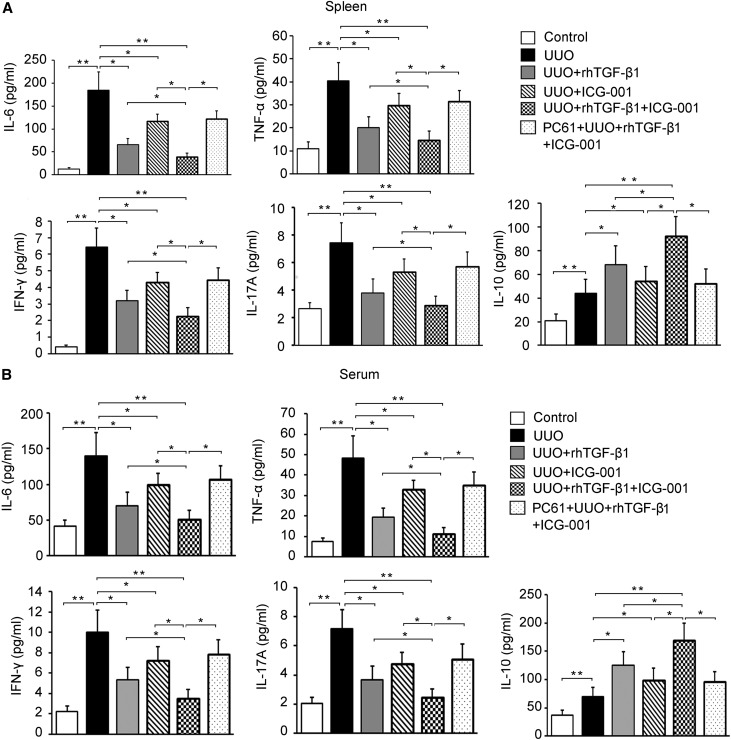
Furthermore, IL-6, TNF-α, IFN-γ, IL-17A, and IL-10 levels were increased in the peripheral blood and supernatants of splenocytes from UUO mice 3 days after UUO (Figure 5, A and B). rhTGF-β1–treated mice showed a reduction in levels of proinflammatory cytokines IL-6, TNF-α, IFN-γ, and IL-17A and a reciprocal increase in anti-inflammatory IL-10 levels in both the peripheral blood and supernatants of splenocytes under UUO conditions. ICG-001 alone decreased IL-6, TNF-α, IFN-γ, and IL-17A and increased IL-10 to a lesser extent. The combined rhTGF-β1 and ICG-001 treatment developed a much milder disease associated with a further reduction in levels of IL-6, TNF-α, IFN-γ, and IL-17A and a further increase in IL-10 (Figure 5).
Figure 5.
Shift of β-catenin from TCF to Foxo inhibits inflammatory and increases anti-inflammatory cytokine production via TGF-β iTregs in UUO mice. (A) Three days after UUO operation, splenocytes were stimulated with phorbol 12-myristate 13-acetate (5 ng/ml) and ionomycin (0.5 μg/ml) in the absence of Golgi stop for 4 hours, and culture supernatants were analyzed for the production of cytokines (IL-6, TNF-α, IFN-γ, IL-17A, and IL-10) using cytometric bead assay (n=6 per group per cytokine; one of two experiments is shown). (B) Serum was analyzed for the production of cytokines (IL-6, TNF-α, IFN-γ, IL-17A, and IL-10) using cytometric bead assay (n=6 per group per cytokine; one of two experiments is shown). Statistical significance was determined by one-way ANOVA followed by Tukey post hoc test. All data are expressed as the means±SEM. *P<0.05; **P<0.01.
To examine whether the anti-inflammatory function of the combined treatment depends on an increase in Tregs, we depleted Tregs systemically with anti-CD25 mAb (PC61) 1 day after rhTGF-β1 and ICG-001 treatment (Supplemental Figure 5). Depletion of Tregs by PC61 reversed the protective effect of the combined treatment on kidney CD3+ cell and macrophage accumulation, histologic damage (Figure 4, Supplemental Figure 3B), and pro- and anti-inflammatory cytokine levels (Figure 5), showing the Treg dependency of the effect of combined treatment. Interestingly, the Treg-dependent anti-inflammatory function was more prominent in I/R than UUO kidneys (Figure 4, B and D), in line with a more important role for Tregs in the I/R model.
rhTGF-β1 and ICG-001 Combined Treatment Decreases Kidney Fibrosis via Tregs
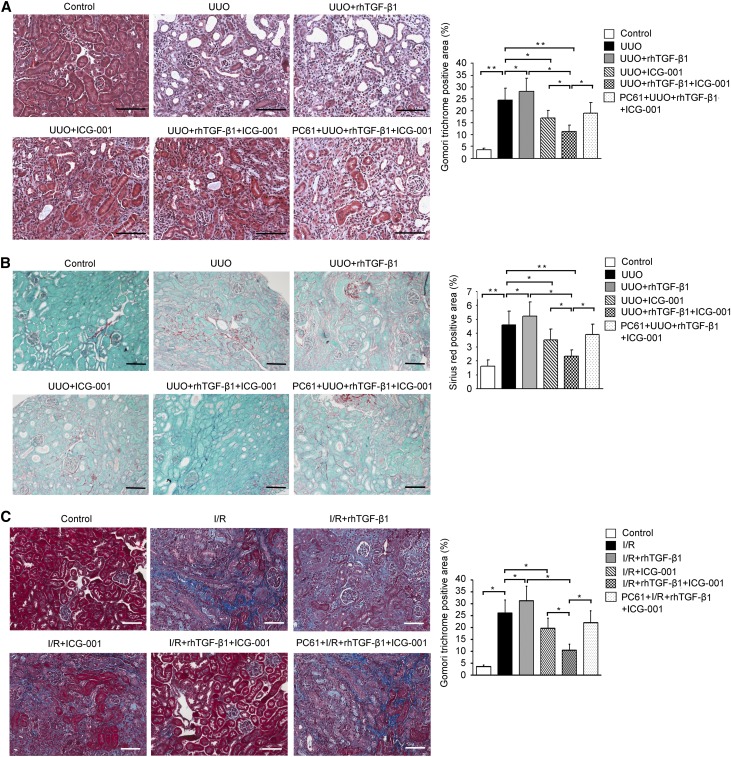
Because inflammation causes fibrosis and Tregs are the most potent anti-inflammatory cells in kidney injury,25 we next evaluated the effect of enhanced Treg induction by combined rhTGF-β1 and ICG-001 treatment on kidney fibrosis. UUO mice showed significant kidney interstitial fibrosis (Figure 6, A and B). rhTGF-β1–alone treatment, although proving to be anti-inflammatory, further increased interstitial fibrosis due to its intrinsic profibrotic effects. ICG-001 alone inhibited kidney fibrosis significantly as expected and in line with a previous report.26 Interestingly, coadministration of rhTGF-β1 with ICG-001 attenuated the interstitial fibrosis to a greater extent than seen with ICG-001 treatment alone (Figure 6, A and B). When Tregs were depleted, the greater protective effects of the combined treatment were abolished (Figure 6, A and B), showing the Treg-dependent anti-inflammatory function in protecting against interstitial fibrosis. Given a minor protective role for Tregs against progressive interstitial fibrosis in the UUO model, the protection by the combined treatment was further examined in I/R kidneys. We detected significant interstitial fibrosis in I/R kidneys (Figure 6C). As in UUO, ICG-001 suppressed, whereas rhTGF-β1 worsened kidney fibrosis. Combined treatment with rhTGF-β1 and ICG-001 significantly reduced interstitial fibrosis to a greater extent (Figure 6C) than they did in UUO kidney, which was shown by a greater reversal of interstitial fibrosis by depletion of Tregs in I/R than in UUO kidneys (Figure 6, A and C).
Figure 6.
Combined rhTGF-β1 and ICG-001 treatment decreases kidney fibrosis via Tregs. (A) Representative Gomori trichrome staining and quantitation in UUO mice (n=6 per group). Original magnification, ×40. (B) Representative Sirius red staining and quantitation in UUO mice (n=6 per group). All data are expressed as the means±SEM. Statistical significance was determined by one-way ANOVA followed by Tukey post hoc test. Original magnification, ×20. Scale bars, 100 μm. *P<0.05; **P<0.01. (C) Representative Gomori trichrome staining and its quantitation in I/R mice (n=6 per group). All data are expressed as the means±SEM. Statistical significance was determined by one-way ANOVA followed by Tukey post hoc test. Original magnification, ×40. Scale bars, 100 μm. *P<0.05.
ICG-001 Inhibits rhTGF-β1–Induced Fibrosis of Distant Organs
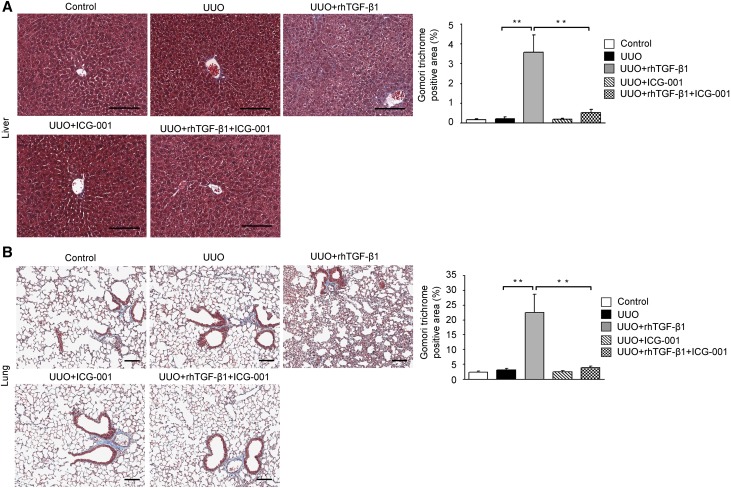
Finally, to assess the safety of systemic administration of rhTGF-β1 and ICG-001, we examined possible fibrotic changes in nondiseased organs other than the kidney. At 4 weeks after UUO, no fibrotic changes were detected in the liver or lung of untreated or ICG-001–treated UUO mice (Figure 7). However, fibrosis developed in lung and liver with rhTGF-β1 alone, showing the profibrotic effects of rhTGF-β1 treatment. Microscopic analysis of stained liver sections of rhTGF-β1–treated UUO mice revealed architectural distortion of lobular structure and extensive bile duct proliferation extending into hepatocytes with periportal fibrogenesis and occasional fibrogenesis in the parenchyma (Figure 7A). Similarly, lung sections of these mice showed pleural thickening, with perivascular and peribronchial fibrosis affecting both large and small vessels and airways (Figure 7B). In contrast, mice with combined rhTGF-β1 and ICG-001 treatment showed normal architecture in lung and liver compared with the rhTGF-β1–alone UUO mice (Figure 7). These results show that systemic use of rhTGF-β1 as an anti-inflammatory agent is safe for distant nondiseased organs when combined with inhibition of β-catenin/TCF by coadministration of ICG-001.
Figure 7.
Coadministration of ICG-001 with rhTGF-β1 inhibits rhTGF-β1–induced fibrosis in lung and liver of UUO mice. (A) Representative of Gomori trichrome–stained liver tissue. Original magnification, ×10. (B) Representative of Gomori trichrome–stained lung tissue. The bar graph shows the percentage of fibrotic area. All data are expressed as the means±SEM. Original magnification, ×10. Scale bars, 100 μm. **P<0.01.
Discussion
Inflammation plays an important role in the development and progression of organ fibrosis.27,28 TGF-β is one of the most important anti-inflammatory molecules.8,29,30 However, TGF-β’s concomitant fibrotic effect has prevented its clinical use as an anti-inflammatory agent. Dissection, if possible, of the profibrotic effects of TGF-β from its anti-inflammatory action could provide an ideal therapeutic strategy for preventing organ fibrosis in chronic inflammatory diseases.
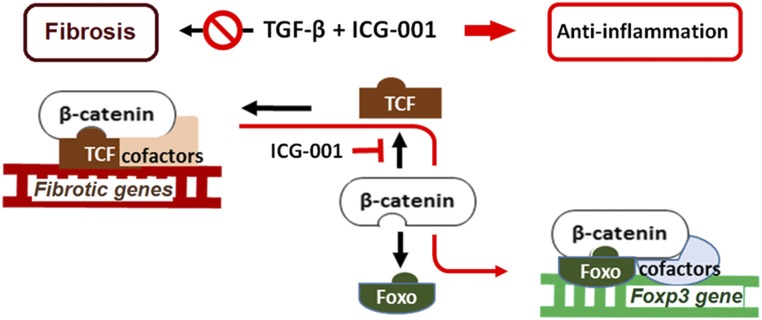
Recent advances in cell signaling suggest that the cell’s transcription factors are the key determinants of cytokine function31–33 and that unique opposing responses may occur, depending on the transcription factors in the target cell.15 In this study, we have shown for the first time that TGF-β can be redirected from its unwanted profibrotic to its beneficial anti-inflammatory function by diverting β-catenin from TCF to Foxo1 via inhibition of β-catenin/TCF (Figure 8). Our study has revealed a new strategy to dissect opposing functions of a pleiotropic cytokine by precise targeting of interactions between key transcription factors.
Figure 8.
β-catenin/Foxo diverts TGF-β signaling from a profibrotic to an anti-inflammatory pathway. Diagram depicting the mechanism by which TGF-β signaling can be diverted from profibrotic to anti-inflammatory by shifting β-catenin from TCF to Foxo binding (symbols and arrows in red).
Tregs play important anti-inflammatory roles in inflammatory disease.23 We hypothesized that β-catenin may also interact with Foxo in TGF-β iTregs to explain the anti-inflammatory function of TGF-β. Importantly, TCF and Foxo compete in binding to the same site of β-catenin (Armadillo repeats 1–7). Thus, inhibition of β-catenin/TCF could divert the limited pool of β-catenin from β-catenin/TCF– to β-catenin/Foxo–mediated transcription. Indeed, we found that β-catenin controls Foxp3 transcription by β-catenin/Foxo1 binding to the Foxp3 promoter in TGF-β iTregs and that inhibition of β-catenin/TCF in presence of rhTGF-β1 prevented TGF-β’s profibrotic effects while enhancing its anti-inflammatory function via β-catenin/Foxo1–mediated iTregs as well as expansion of nTregs.
Although TGF-β1 expression increased markedly in UUO kidney, the numbers of Tregs in the obstructed kidney and spleen were decreased. These results suggest that the increased endogenous expression of TGF-β1 was insufficient to induce significant numbers of iTregs. Furthermore, UUO-induced inflammation may favor increases in inflammatory T cell populations, such as Th17 cells, given the increased levels of inflammatory cytokines, including IL-6, TNF-α, and IL-17, after UUO.34 Administration of rhTGF-β indeed significantly suppressed IL-6, TNF-α, and IL-17 expression, thereby increasing the population of Tregs. Moreover, Foxo1 is a negative regulator of Th17.35 ICG-001 has previously been reported to reduce kidney fibrosis.26 However, coadministration of TGF-β with ICG-001 exhibited greater antifibrotic effects than did ICG-001 alone. This result is explained by the enhanced induction of iTregs and expansion of nTregs by exogenous rhTGF-β in the presence of β-catenin/TCF inhibitor ICG-001.
Depletion of Tregs using PC61 abrogated the beneficial effects achieved by combined TGF-β and ICG-001 treatment, showing that the anti-inflammatory effects were dependent on Tregs. This was more prominent in the kidney I/R model, in which Tregs play a more important role. Although there has been considerable debate about the effectiveness of the anti-CD25 mAb treatment in vivo,36,37 many studies report success in significant depletion of Tregs by anti-CD25 pretreatment in various animal models.23,38,39
TGF-β/Smad3 signaling is known to be critical for TGF-β iTregs.40 Here, we showed that its activity was increased by TGF-β but was not changed by β-catenin stabilization or ICG-001 inhibition of β-catenin/TCF, Thus, TGF-β/Smad3 signaling in iTreg induction would not be compromised by the targeted inhibition of β-catenin/TCF.
We showed that, when rhTGF-β1 was combined with ICG-001 treatment, rhTGF-β1–induced fibrotic changes in both lung and liver were prevented. This result is the first to show the possibility of systemic use of TGF-β1 without concomitant fibrosis. The importance of this observation extends beyond inflammatory fibrotic diseases. It may also lead to use of TGF-β1 in treatment of autoimmune diseases and prevention of transplant rejection and fibrosis.
In summary, our results show that diversion of the limited pool of β-catenin from TCF- to Foxo-mediated transcription not only inhibits β-catenin/TCF–mediated fibrosis but also enhances TGF-β’s anti-inflammatory action through β-catenin/Foxo. This molecular switch in TGF-β signaling has great therapeutic potential to reduce inflammation while preventing fibrosis and organ failure.
Concise Methods
Mice and UUO
Male C57BL/6 mice were purchased from the Australian Research Center (Perth, Australia). Breeding pairs of Foxp3gfp (Ly5.2; on C57BL/6 background) were provided by Alexander Y. Rudensky (University of Washington, Seattle, WA). Foxp3gfp (Ly5.2) mice were crossed with C57BL/6 (Ly5.1) mice (Australian Research Center) to generate Foxp3gfp (Ly5.1) mice. Male mice ages 8–10 weeks old were used in all experiments. All mice were maintained under standard sterile conditions in the Department of Animal Care at Westmead Hospital.
Kidney fibrosis was induced by ligation of left ureter (UUO) in male Foxp3gfp Ly5.1 mice. Briefly, mice were anesthetized, laparotomy was performed, and the left ureter was identified and ligated. Sham-operated mice underwent the same surgical procedure except for the ureter ligation. Kidney I/R injury was induced by unilateral clamping of the left kidney pedicle with arterial microclamps for 45 minutes.
Treatment
UUO, I/R, and control mice were treated with rhTGF-β1 (50 μg/kg intraperitoneally) or vehicle Second daily and with ICG-001 (5 mg/kg intraperitoneally) daily after surgery. UUO mice were euthanized on days 1, 3, 5, 7, and 14 for assessment of inflammation and kidney fibrosis and on day 28 for assessment of fibrosis in lung and liver. Blood samples from I/R mice were analyzed on day 7 after operation. I/R mice were euthanized on day 21 for assessment of fibrosis.
Histology, Immunohistochemical, and Immunofluorescence Staining
Fourteen days after UUO operation or 21 days after I/R injury, kidneys were harvested, embedded in paraffin, and sectioned for staining with Sirius red or Gomori trichrome to assess the degree of fibrosis. Hematoxylin and eosin staining was performed to analyze the inflammatory cell infiltration into the kidney. For kidney histologic quantitation by a blinded observer, a minimum of 15 nonoverlapping images of cortex were taken under ×200 magnification for each kidney. Quantification of pulmonary and liver fibrosis was performed as described previously.41,42
For immunohistochemical staining, the rehydrated sections were pretreated with 3% H2O2 for 10 minutes at room temperature to block the endogenous peroxidase. After boiling in antigen retrieval solution (1% zinc sulfate) for 10 minutes at high power in a microwave oven, the sections were incubated overnight at 4°C with primary rat anti-mouse F4/80 antibody (1:200; 14–4801; eBioscience). This was followed by biotinylated secondary antibodies and finally, avidin-conjugated horseradish peroxidase. All slides were counterstained with hematoxylin. Interstitial macrophages were expressed as the percentage of F4/80+ interstitial area in ten randomly chosen high-power (×400 magnification) fields per kidney. Semiquantitative computer-assisted image analysis was performed by a blinded observer with Image-Pro Plus software (Media Cybernetics, Bethesda, MD).
For immunofluorescence staining, frozen blocks from kidney were cut into 7-μm sections, fixed with acetone at −20°C for 10 minutes, and blocked with 2% BSA for 30 minutes at room temperature. Tissue was then incubated with Armenian hamster anti-mouse CD3e (1:100; 14–0031–82; eBioscience) in 2% BSA in PBS for 1 hour at room temperature. Secondary fluorescent-conjugated anti-Armenian hamster DyLight 488 (1:400; Biolegend) was used for 40 minutes at room temperature in the dark followed by washing in PBS and distilled water and counterstaining with 4′,6-diamidino-2 phenylindole (Invitrogen) for 5 minutes. Sections were then washed in PBS and distilled water before mounting with fluorescence mounting medium (Dako, Glostrup, Denmark). Images were obtained using a confocal microscope (Olympus FV1000) with a 40× oil-immersion objective and analyzed by a blinded observer using the LSM Image Analyzer postacquisition software (Zeiss). The number of CD3+ cells was counted.
In some experiments, anti-CD25 mAb (500 μg; PC61; Bio Express, West Lebanon, NH) or isotype control IgG was administered to mice intraperitoneally twice per week for 2 weeks starting from 1 day after UUO or I/R operation and rhTGF-β1 plus ICG-001 administration.
Kidney or Spleen Mononuclear Cells
Some mice were euthanized 3 days after UUO, and the obstructed kidney and spleen were harvested for flow cytometry analysis. Before harvesting kidney and spleen, the organs were perfused with warm PBS. The spleen and obstructed kidney of UUO and sham control mice were removed and placed in cold buffer (PBS supplemented with 1% FBS and 5 mM EDTA). Spleens were cleaned and mashed through a 70-μm cell strainer (BD Biosciences, San Jose, CA) using a plunger. Erythrocytes from spleens were lysed using Red Cell Lysis Buffer (Biolegend) to remove red blood cells. The CD4+ T cells were isolated using mouse CD4 (L3T4) microbeads (Miltenyi Biotec Inc.) by MACS according to the manufacturer’s instructions as we previously reported.43 Briefly, the cells were resuspended in microbead buffer with the magnetic beads (10 μl in 90-μl cells) for 15 minutes at 4°C before the suspensions were placed into the magnet. CD4+ cells were flushed out of the column with the plunger supplied. Then, the cells were sorted into GFP+ and GFP− cells on AriaII (BD Biosciences). The sorted cells were washed with PBS and resuspended in PBS for adoptive transfer into mice. The sorted cell purity was checked by the same FACScan analyzer, and both CD4+GFP− and CD4+GFP+ T cells used in the experiments showed >95% purity. The pelleted cells were washed in PBS and resuspended in complete medium RPMI 1640 supplemented with 10% FBS. Cell numbers were counted with a hemocytometer by trypan blue dye exclusion technique.
The obstructed kidneys were decapsulated, washed with PBS, and transferred into gentleMACS C Tubes containing digest solution (1 mg/ml collagenase IV [Sigma-Aldrich] and 0.1 mg/ml deoxyribonuclease [DNase, type I; Roche]). The tubes were attached onto the sleeve of gentleMACS dissociator (Miltenyi Biotec Inc.), and the corresponding program was run at 37°C for 21 minutes. The suspension was centrifuged at 300×g for 5 minutes. The cells were resuspended in 2 ml of ice cold PBS and passed through a 70-μm cell strainer. CD45+ cells were isolated with anti-CD45 microbeads using the autoMACS automatic cell sorter (Miltenyi Biotec Inc.) according to the manufacturer’s instructions.
Kidney and splenic mononuclear cells were obtained for flow cytometry analysis.
Cell Culture
iTregs were generated from CD4+CD25− T cells (isolated from C57BL/6 mouse spleen) or EL4 murine T cells (catalog no. TIB-39; ATCC). EL4 cells were grown in IMEM (Gibco) plus glutamax supplemented with 5% heat-inactivated horse serum. CD4+CD25− T cells were cultured in RPMI 1640 supplemented with 10% FBS. EL4 T cells and CD4+CD25− T cells were stimulated with anti-CD3/CD28 Dynabeads (Invitrogen) and IL-2 in the presence or absence of rhTGF-β1 (10 ng/ml; Gibco) or plus LiCl (20 mM; Sigma-Aldrich) or ICG-001 (5 μM; Enzo Life Sciences, Lörrach, Germany) for 12 or 24 hours. In some experiments, EL4 cells were transfected with F-Trcp-Ecad (targeting cytosolic β-catenin for degradation), β-catenin (overexpression of mouse β-catenin), or pcDNA (vector) plasmid. Lipofectamine 2000 (Invitrogen) was used to transiently transfect EL4 cells according to the protocols provided by the manufacturer. The cells were obtained for flow cytometric analysis.
Flow Cytometry Analyses
Single-cell suspensions made from spleens, obstructed kidneys, and cultured Tregs were stained with Fixable Viability Stain 700 (BD Biosciences) and then incubated with 1 μg of purified anti-CD16/CD32 for 20 minutes in the dark to block nonspecific binding of antibodies to the FcγIII/II receptors. Then, cells were stained with surface markers. In some experiments, cells were fixed and permeabilized using Cytofix/Cytoperm (BD Biosciences) according to the manufacturer’s instructions. Subsequently, cells were stained for various intracellular cytokines. To detect cytokine levels in spleen cells, single-cell suspensions were stimulated with the leukocyte activation cocktail containing phorbol 12-myristate 13-acetate (50 ng ml−1; Sigma-Aldrich) and calcium ionophore (Ionomycin; 500 ng ml−1; Sigma-Aldrich) at 37°C for 4 hours.
The following antibodies were used for flow cytometry analysis: CD45.1 (APC-Cy7; BD Biosciences), CD3e (BV510; BD Biosciences), CD4 (BUV737; BD Biosciences), CD4 (efluor 450; eBioscience), CD25 (BV650; BD Biosciences), CD25 (APC; eBioscience), and Foxp3 (PE; eBioscience). Experiments were repeated at least three times. The samples were acquired on the LSR II flow cytometer (BD Biosciences) and analyzed using FlowJo (Tree Star) software.
For fate-mapping studies, GFP−CD4+ or GFP+CD4+ T cells were sorted from spleen lymphocytes of B6.Ly5.1.FoxP3gfp mice by FACS (FACS Vantage-Diva; BD Biosciences) on the basis of expression of CD4, the fluorescent Foxp3 fusion protein (GFP), and the congenic marker Ly5.1+ using Diva software (BD Biosciences) as described.44 Sorted spleen GFP−CD4+ or GFP+CD4+ T cells from Ly5.1 mice were adoptively transferred intravenously into individual Ly5.2 mice. rhTGF-β1 (50 μg/kg) or rhTGF-β1 plus ICG-001 (5 mg/kg) was given to Ly5.2 mice by intraperitoneal injection daily for 3 days after transfer. GFP+CD4+ cells in the spleen were detected by flow cytometry.
Cytometric Bead Analysis
The levels of cytokines IL-10, IL-6, IL-17A, TNF-α, and IFN-γ in the serum and supernatant of spleen cells were measured simultaneously by cytometric bead array using the Mouse Th1/Th2/Th17 Cytokine Kit (BD Biosciences) according to the manufacturer’s instructions.
Preparation of Nuclear Extracts
Nuclear extracts were prepared as previously described.45 In brief, cells were harvested, washed, and pelleted in PBS at 850×g for 2 minutes. Each cell pellet, containing 5×10⁶ cells, was subjected to nuclear protein extraction with the ProteoJET Nuclear Protein Extraction Kit (Thermo Scientific) according to the manufacturer’s instruction. Proteins were quantified by Bradford assay (Bio-Rad) and used in coimmunoprecipitation.
Luciferase Reporter Assays
Transcriptional activity of TCF/β-catenin was evaluated by TOP/FOPflash luciferase assay (Millipore Corporation) as previously described.45 Briefly, iTregs were cotransfected using Lipofectamine 2000 reagent with the TOPflash luciferase reporter plasmid TOP-flash (1 μg per well) or a mutant control FOP-flash (1 μg per well) expression vector. pRL-RSV Renilla luciferase plasmid (0.1 μg per well) was used as an internal control for transfection efficiency. After 24 hours, cells were treated with TGF-β1 (10 ng/ml) or ICG-001 (5 μM). Cells were lysed, and luciferase activities were determined using a dual luciferase assay kit according to the manufacturer’s instructions (Promega). Relative luciferase activities were expressed as the ratio of TOP-flash to FOP-flash luciferase activity, each normalized against Renilla luciferase activity. Experiments were repeated at least three times.
Smad reporter activity was detected by the SMAD reporter assay kit (SABiosciences).45 The FHRE-Luc, a reporter plasmid containing Foxo response element, was used for detecting rhTGF-β1–induced FOXO reporter activity (Qiagen). In brief, cells were split into 12-well plates overnight. Twenty-four hours after transfection, medium was changed, and cells were treated with TGF-β1 (10 ng/ml) in the presence or absence of F-TrCP-Ecad or ICG-001 (5 μM) for 24 hours. Dual-Glo Luciferase Assay System (Promega) was used for measurement of reporter activities. The relative luciferase activities were calculated by normalizing the promoter-driven firefly luciferase activity versus Renilla luciferase.
Coimmunoprecipitation
Coimmunoprecipitation was performed using a commercially available kit (Protein-G Immunoprecipitation Kit; Sigma-Aldrich) according to the manufacturer’s instruction. In brief, cell nuclear proteins were immunoprecipitated with anti-IgG, anti-Foxo1 (1:1000; Cell Signaling), or anti-TCF (1:1000; Cell Signaling) and Protein-G agarose beads (Santa Cruz Biotechnology) overnight at 4°C. The agarose beads were collected by pulse centrifugation. The immunoprecipitations were washed five times with radioimmune precipitation buffer. Immunoprecipitated proteins were subjected to SDS-PAGE protein separation followed by Western blot. Mouse monoclonal heavy-chain IgG was used as loading control for input.
Western Blot
Immunoblot analysis was performed with anti–β-catenin (1:1000; BD Biosciences), anti-Foxo1 (1:1000), anti-TCF (1:1000), or anti–TGF-β (1:100; Cell Signaling). The membranes were washed and incubated with their respective horseradish peroxidase–conjugated secondary antibodies for 60 minutes at room temperature. The ECL Western blotting system (Santa Cruz Biotechnology) was used for detection. Protein expression was measured with ImageJ by quantifying the relative expression of target protein versus β-actin.
ChIP Assay
The interactions of β-catenin/Foxo in the promoters of Foxp3 genes were analyzed by ChIP assay according to the protocols provided by the manufacturer (Upstate Biotechnology). Briefly, after incubating with TGF-β1 (10 ng/ml), ICG-001 (5 μM), F-TrCP-Ecad chimera, or β-catenin plasmid, iTregs were crosslinked with 1% formaldehyde at room temperature for 15 minutes. The lysates were sonicated to reduce DNA length to 300–500 bp. An aliquot of total diluted lysate was used for total genomic DNA as input DNA control. The protein-A-anti-Foxo1 (Abcam) or an isotype control antibody was added and incubated overnight at 4°C followed by incubation with protein A-agarose for 1 hour. The precipitates were washed, and chromatin complexes were eluted. Precipitated ChIP DNA and input DNA were incubated at 65°C for 4 hours to reverse the crosslinking. After digestion with RNase and proteinase K, the ChIP and input DNA were purified with phenol/chloroform extraction and ethanol precipitation. ChIP samples were used as a template for PCR amplification using specific primers flanking the Foxo binding site of mouse Foxp3 promoter (sense 5′-CCCTGCAATTATCAGCACAC-3′ and antisense 5′-TGTGGGAAACTGCCACATTA-3′).19 PCR samples were analyzed by electrophoresis on a 2.0% agarose gel.
Statistical Analyses
Results are presented as means±SEM; t test was used to determine the significance of differences between two groups, whereas one-way ANOVA was used for comparison of multiple groups. P<0.05 was considered significant.
Study Approval
All animal experiments were carried out in accordance with protocols approved by the Animal Ethics Committee of Western Sydney Local Health District.
Disclosures
None.
Supplementary Material
Acknowledgments
This work was supported by National Health and Medical Research Council of Australia project grants 632688 and 1046647.
Footnotes
Published online ahead of print. Publication date available at www.jasn.org.
This article contains supplemental material online at http://jasn.asnjournals.org/lookup/suppl/doi:10.1681/ASN.2016121362/-/DCSupplemental.
References
- 1.Duffield JS: Cellular and molecular mechanisms in kidney fibrosis. J Clin Invest 124: 2299–2306, 2014 [DOI] [PMC free article] [PubMed] [Google Scholar]
- 2.Yanagita M: Inhibitors/antagonists of TGF-β system in kidney fibrosis. Nephrol Dial Transplant 27: 3686–3691, 2012 [DOI] [PubMed] [Google Scholar]
- 3.Border WA, Noble NA: Transforming growth factor beta in tissue fibrosis. N Engl J Med 331: 1286–1292, 1994 [DOI] [PubMed] [Google Scholar]
- 4.Meng XM, Nikolic-Paterson DJ, Lan HY: TGF-β: The master regulator of fibrosis. Nat Rev Nephrol 12: 325–338, 2016 [DOI] [PubMed] [Google Scholar]
- 5.Vincenti F, Fervenza FC, Campbell KN, Diaz M, Gesualdo L, Nelson P, Praga M, Radhakrishnan J, Sellin L, Singh A, Thornley-Brown D, Veronese FV, Accomando B, Engstrand S, Ledbetter S, Lin J, Neylan J, Tumlin J; Focal Segmental Glomerulosclerosis Study Group : A phase 2, double-blind, placebo-controlled, randomized study of fresolimumab in patients with steroid-resistant primary focal segmental glomerulosclerosis. Kidney Int Rep 2: 800–810, 2017 [DOI] [PMC free article] [PubMed] [Google Scholar]
- 6.Voelker J, Berg PH, Sheetz M, Duffin K, Shen T, Moser B, Greene T, Blumenthal SS, Rychlik I, Yagil Y, Zaoui P, Lewis JB: Anti-TGF-β1 antibody therapy in patients with diabetic nephropathy. J Am Soc Nephrol 28: 953–962, 2017 [DOI] [PMC free article] [PubMed] [Google Scholar]
- 7.Sureshbabu A, Muhsin SA, Choi ME: TGF-β signaling in the kidney: Profibrotic and protective effects. Am J Physiol Renal Physiol 310: F596–F606, 2016 [DOI] [PMC free article] [PubMed] [Google Scholar]
- 8.Kulkarni AB, Ward JM, Yaswen L, Mackall CL, Bauer SR, Huh CG, Gress RE, Karlsson S: Transforming growth factor-beta 1 null mice. An animal model for inflammatory disorders. Am J Pathol 146: 264–275, 1995 [PMC free article] [PubMed] [Google Scholar]
- 9.Li MO, Wan YY, Sanjabi S, Robertson AK, Flavell RA: Transforming growth factor-beta regulation of immune responses. Annu Rev Immunol 24: 99–146, 2006 [DOI] [PubMed] [Google Scholar]
- 10.Meng XM, Huang XR, Xiao J, Chen HY, Zhong X, Chung AC, Lan HY: Diverse roles of TGF-β receptor II in renal fibrosis and inflammation in vivo and in vitro. J Pathol 227: 175–188, 2012 [DOI] [PubMed] [Google Scholar]
- 11.Liu Y: Renal fibrosis: New insights into the pathogenesis and therapeutics. Kidney Int 69: 213–217, 2006 [DOI] [PubMed] [Google Scholar]
- 12.Rodrigues-Díez R, Rayego-Mateos S, Orejudo M, Aroeira LS, Selgas R, Ortiz A, Egido J, Ruiz-Ortega M: TGF-beta blockade increases renal inflammation caused by the C-terminal module of the CCN2. Mediators Inflamm 2015: 506041, 2015 [DOI] [PMC free article] [PubMed] [Google Scholar]
- 13.Padua D, Massagué J: Roles of TGFbeta in metastasis. Cell Res 19: 89–102, 2009 [DOI] [PubMed] [Google Scholar]
- 14.Bowerman B: Cell biology. Oxidative stress and cancer: A beta-catenin convergence. Science 308: 1119–1120, 2005 [DOI] [PubMed] [Google Scholar]
- 15.Essers MA, de Vries-Smits LM, Barker N, Polderman PE, Burgering BM, Korswagen HC: Functional interaction between beta-catenin and FOXO in oxidative stress signaling. Science 308: 1181–1184, 2005 [DOI] [PubMed] [Google Scholar]
- 16.Liu Y: New insights into epithelial-mesenchymal transition in kidney fibrosis. J Am Soc Nephrol 21: 212–222, 2010 [DOI] [PMC free article] [PubMed] [Google Scholar]
- 17.Hoogeboom D, Essers MA, Polderman PE, Voets E, Smits LM, Burgering BM: Interaction of FOXO with beta-catenin inhibits beta-catenin/T cell factor activity. J Biol Chem 283: 9224–9230, 2008 [DOI] [PubMed] [Google Scholar]
- 18.Behrens J, von Kries JP, Kühl M, Bruhn L, Wedlich D, Grosschedl R, Birchmeier W: Functional interaction of beta-catenin with the transcription factor LEF-1. Nature 382: 638–642, 1996 [DOI] [PubMed] [Google Scholar]
- 19.Ouyang W, Beckett O, Ma Q, Paik JH, DePinho RA, Li MO: Foxo proteins cooperatively control the differentiation of Foxp3+ regulatory T cells. Nat Immunol 11: 618–627, 2010 [DOI] [PubMed] [Google Scholar]
- 20.Hedrick SM, Hess Michelini R, Doedens AL, Goldrath AW, Stone EL: FOXO transcription factors throughout T cell biology. Nat Rev Immunol 12: 649–661, 2012 [DOI] [PMC free article] [PubMed] [Google Scholar]
- 21.Henderson WR Jr, Chi EY, Ye X, Nguyen C, Tien YT, Zhou B, Borok Z, Knight DA, Kahn M: Inhibition of Wnt/beta-catenin/CREB binding protein (CBP) signaling reverses pulmonary fibrosis. Proc Natl Acad Sci U S A 107: 14309–14314, 2010 [DOI] [PMC free article] [PubMed] [Google Scholar]
- 22.Takimoto T, Wakabayashi Y, Sekiya T, Inoue N, Morita R, Ichiyama K, Takahashi R, Asakawa M, Muto G, Mori T, Hasegawa E, Saika S, Hara T, Nomura M, Yoshimura A: Smad2 and Smad3 are redundantly essential for the TGF-beta-mediated regulation of regulatory T plasticity and Th1 development. J Immunol 185: 842–855, 2010 [DOI] [PubMed] [Google Scholar]
- 23.Kim MG, Koo TY, Yan JJ, Lee E, Han KH, Jeong JC, Ro H, Kim BS, Jo SK, Oh KH, Surh CD, Ahn C, Yang J: IL-2/anti-IL-2 complex attenuates renal ischemia-reperfusion injury through expansion of regulatory T cells. J Am Soc Nephrol 24: 1529–1536, 2013 [DOI] [PMC free article] [PubMed] [Google Scholar]
- 24.Lai LW, Yong KC, Lien YH: Pharmacologic recruitment of regulatory T cells as a therapy for ischemic acute kidney injury. Kidney Int 81: 983–992, 2012 [DOI] [PMC free article] [PubMed] [Google Scholar]
- 25.Kinsey GR, Sharma R, Huang L, Li L, Vergis AL, Ye H, Ju ST, Okusa MD: Regulatory T cells suppress innate immunity in kidney ischemia-reperfusion injury. J Am Soc Nephrol 20: 1744–1753, 2009 [DOI] [PMC free article] [PubMed] [Google Scholar]
- 26.Hao S, He W, Li Y, Ding H, Hou Y, Nie J, Hou FF, Kahn M, Liu Y: Targeted inhibition of β-catenin/CBP signaling ameliorates renal interstitial fibrosis. J Am Soc Nephrol 22: 1642–1653, 2011 [DOI] [PMC free article] [PubMed] [Google Scholar]
- 27.Lee SB, Kalluri R: Mechanistic connection between inflammation and fibrosis. Kidney Int Suppl 119: S22–S26, 2010 [DOI] [PMC free article] [PubMed] [Google Scholar]
- 28.Medzhitov R: Origin and physiological roles of inflammation. Nature 454: 428–435, 2008 [DOI] [PubMed] [Google Scholar]
- 29.Wang W, Huang XR, Li AG, Liu F, Li JH, Truong LD, Wang XJ, Lan HY: Signaling mechanism of TGF-beta1 in prevention of renal inflammation: Role of Smad7. J Am Soc Nephrol 16: 1371–1383, 2005 [DOI] [PubMed] [Google Scholar]
- 30.Huang XR, Chung AC, Zhou L, Wang XJ, Lan HY: Latent TGF-beta1 protects against crescentic glomerulonephritis. J Am Soc Nephrol 19: 233–242, 2008 [DOI] [PMC free article] [PubMed] [Google Scholar]
- 31.Massagué J: How cells read TGF-beta signals. Nat Rev Mol Cell Biol 1: 169–178, 2000 [DOI] [PubMed] [Google Scholar]
- 32.Li MO, Sanjabi S, Flavell RA: Transforming growth factor-beta controls development, homeostasis, and tolerance of T cells by regulatory T cell-dependent and -independent mechanisms. Immunity 25: 455–471, 2006 [DOI] [PubMed] [Google Scholar]
- 33.Ding Y, Shen S, Lino AC, Curotto de Lafaille MA, Lafaille JJ: Beta-catenin stabilization extends regulatory T cell survival and induces anergy in nonregulatory T cells. Nat Med 14: 162–169, 2008 [DOI] [PubMed] [Google Scholar]
- 34.Thakur C, Wolfarth M, Sun J, Zhang Y, Lu Y, Battelli L, Porter DW, Chen F: Oncoprotein mdig contributes to silica-induced pulmonary fibrosis by altering balance between Th17 and Treg T cells. Oncotarget 6: 3722–3736, 2015 [DOI] [PMC free article] [PubMed] [Google Scholar]
- 35.Lainé A, Martin B, Luka M, Mir L, Auffray C, Lucas B, Bismuth G, Charvet C: Foxo1 is a T cell-intrinsic inhibitor of the RORγt-Th17 program. J Immunol 195: 1791–1803, 2015 [DOI] [PubMed] [Google Scholar]
- 36.Setiady YY, Coccia JA, Park PU: In vivo depletion of CD4+FOXP3+ Treg cells by the PC61 anti-CD25 monoclonal antibody is mediated by FcgammaRIII+ phagocytes. Eur J Immunol 40: 780–786, 2010 [DOI] [PubMed] [Google Scholar]
- 37.McNeill A, Spittle E, Bäckström BT: Partial depletion of CD69low-expressing natural regulatory T cells with the anti-CD25 monoclonal antibody PC61. Scand J Immunol 65: 63–69, 2007 [DOI] [PubMed] [Google Scholar]
- 38.Weirather J, Hofmann UD, Beyersdorf N, Ramos GC, Vogel B, Frey A, Ertl G, Kerkau T, Frantz S: Foxp3+ CD4+ T cells improve healing after myocardial infarction by modulating monocyte/macrophage differentiation. Circ Res 115: 55–67, 2014 [DOI] [PubMed] [Google Scholar]
- 39.Montane J, Bischoff L, Soukhatcheva G, Dai DL, Hardenberg G, Levings MK, Orban PC, Kieffer TJ, Tan R, Verchere CB: Prevention of murine autoimmune diabetes by CCL22-mediated Treg recruitment to the pancreatic islets. J Clin Invest 121: 3024–3028, 2011 [DOI] [PMC free article] [PubMed] [Google Scholar]
- 40.Tone Y, Furuuchi K, Kojima Y, Tykocinski ML, Greene MI, Tone M: Smad3 and NFAT cooperate to induce Foxp3 expression through its enhancer. Nat Immunol 9: 194–202, 2008 [DOI] [PubMed] [Google Scholar]
- 41.Ghiassi-Nejad Z, Hernandez-Gea V, Woodrell C, Lang UE, Dumic K, Kwong A, Friedman SL: Reduced hepatic stellate cell expression of Kruppel-like factor 6 tumor suppressor isoforms amplifies fibrosis during acute and chronic rodent liver injury. Hepatology 57: 786–796, 2013 [DOI] [PMC free article] [PubMed] [Google Scholar]
- 42.Rahaman SO, Grove LM, Paruchuri S, Southern BD, Abraham S, Niese KA, Scheraga RG, Ghosh S, Thodeti CK, Zhang DX, Moran MM, Schilling WP, Tschumperlin DJ, Olman MA: TRPV4 mediates myofibroblast differentiation and pulmonary fibrosis in mice. J Clin Invest 124: 5225–5238, 2014 [DOI] [PMC free article] [PubMed] [Google Scholar]
- 43.Wu J, Hu M, Qian YW, Hawthorne WJ, Burns H, Liuwantara D, Alexander SI, Yi S, O’Connell PJ: In vivo costimulation blockade-induced regulatory T cells demonstrate dominant and specific tolerance to porcine islet xenografts. Transplantation 101: 1587–1599, 2017 [DOI] [PubMed] [Google Scholar]
- 44.Hu M, Wu J, Zhang GY, Wang YM, Watson D, Yi S, Hawthorne WJ, O’Connell PJ, Alexander SI: Selective depletion of alloreactive T cells leads to long-term islet allograft survival across a major histocompatibility complex mismatch in diabetic mice. Cell Transplant 22: 1929–1941, 2013 [DOI] [PubMed] [Google Scholar]
- 45.Tian X, Liu Z, Niu B, Zhang J, Tan TK, Lee SR, Zhao Y, Harris DC, Zheng G: E-cadherin/β-catenin complex and the epithelial barrier. J Biomed Biotechnol 2011: 567305, 2011 [DOI] [PMC free article] [PubMed] [Google Scholar]
Associated Data
This section collects any data citations, data availability statements, or supplementary materials included in this article.


