Abstract
Because of the potential for exposure to N,N-dimethyl-p-toluidine (DMPT) in medical devices and the lack of toxicity and carcinogenicity information available in the literature, the National Toxicology Program conducted toxicity and carcinogenicity studies of DMPT in male and female F344/N rats and B6C3F1/N mice. In these studies, a treatment-related macrocytic regenerative anemia characterized by increased levels of methemoglobin and Heinz body formation developed within a few weeks of DMPT exposure in rats and mice. DMPT induced nasal cavity, splenic, and liver toxicity in rats and mice at 3 months and 2 years. DMPT carcinogenic effects were seen in the liver of male and female rats and mice, the nasal cavity of male and female rats, and the lung and forestomach of female mice. In rodents, DMPT is distributed to many of the sites where toxic and carcinogenic effects occurred. DMPT-induced oxidative damage at these target sites may be one mechanism for the treatment-related lesions. Methemoglobinemia, as seen in these DMPT studies, is caused by oxidation of the heme moiety, and this end point served as an early alert for other target organ toxicities and carcinogenic responses that followed with longer term exposure.
Keywords: N,N-dimethyl-p-toluidine; carcinogenic effects; hematologic toxicity
Introduction
N,N-Dimethyl-p-toluidine (DMPT, Figure 1) is on the U.S. Environmental Protection Agency High Production Volume Chemical List with annual production estimates of 1 to 10 million pounds (U.S. Environmental Protection Program 2011). DMPT is found in a wide variety of materials, and a recent search of U.S. patents indicates that there are over 900 patents that describe products containing DMPT (U.S. Patent and Trademark Office 2012). DMPT has been used in the preparation of acrylic bone cements and dental materials for over 50 years (Dillingham et al. 1975; Galus and Adams 1963; Linder 1976). DMPT is an accelerator in the redox initiator–accelerator system used commercially to cure methyl methacrylate monomers, but polymerization is rarely complete (Shintani et al. 1993; Stea et al. 1997). Thus, there is potential for DMPT exposure to surgical staff, dental prosthetic device manufacturers, and users of DMTP-containing medical devices.
Figure 1.
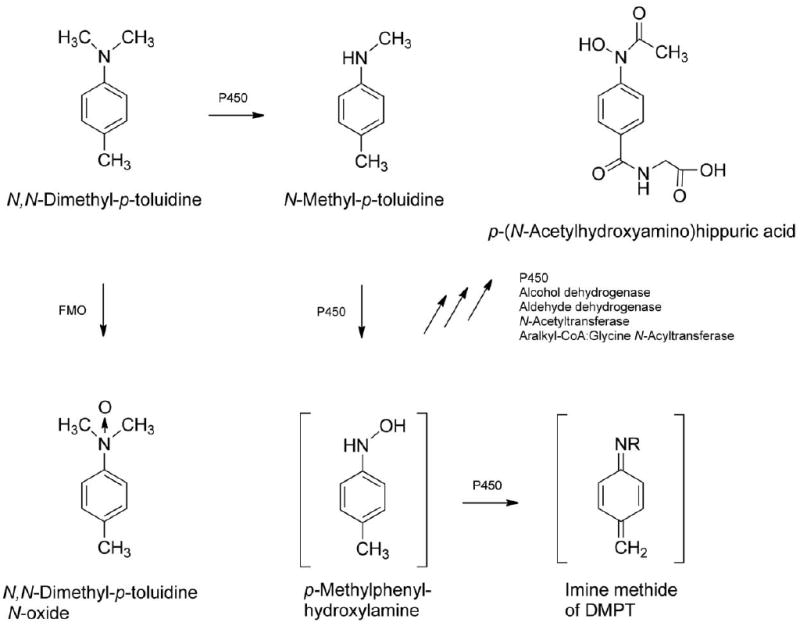
Observed DMPT metabolites (Kim et al. 2007) including some proposed reactive intermediates of DMPT. DMPT = N,N-dimethyl-p-toluidine.
Toxicity to DMPT has been reported in children after accidental DMPT poisoning accompanied by methemoglobinemia (Kao et al. 1997; Potter et al. 1988). Allergic responses to DMPT have also been reported (Tosti et al. 1990; Vazquez, Levenfeld, and Roman 1998; Verschueren and Bruynzeel 1991).
Medical devices, such as dental materials containing DMPT, are regulated under the 501(k) clearance process established by the U.S. Congress in 1976. Medical devices that are similar to those previously on the market are not required to undergo new safety testing (Challoner and Vodra 2011). Recently, the Institute of Medicine reviewed the 501(k) clearance process and recommended that new procedures should be established to obtain more safety and efficacy information on medical devices (Institute of Medicine of the National Academies 2011). Others have recommended international coordination for approval of medical devices (Kramer, Xu, and Kesselheim 2012).
The increased methemoglobin concentrations found in humans after accidental oral consumption of DMPT-containing products (Kao et al. 1997; Potter et al. 1988) suggest that DMPT exposure can produce adverse effects. Experimental studies also show that DMPT is rapidly and well absorbed from the gastrointestinal tract of rodents following oral administration (Dix, Ghanbari, and Hedtke-Weber 2007). In this study, we expand our knowledge on the potential for DMPT toxicity after short- and long-term oral exposure in rodent models.
Method and Material
Experimental Design
DMPT (Alfa Aesar, Ward Hill, MA) was prepared for oral gavage administration in corn oil to deliver the target concentrations of the chemical (as specified below) to rats in a volume of 2.5 ml/kg body weight and to mice at a volume of 5 ml/kg body weight. Male and female F344/N rats and B6C3F1/N mice were obtained from Taconic Laboratory, Germantown, NY. At the start of the study, the animals were 5 to 6 weeks of age. The animals were housed by species and sex, 2 to 3 male rats per cage, 5 female rats per cage, 1 male mouse per cage, and 5 female mice per cage. Tap water and National Toxicology Program (NTP)-2000 diet (Zeigler Brothers, Inc. Gardners, PA) were made available ad libitum. The care of animals in this study was according to the National Institute of Health procedures as described in the “The U.S. Public Health Service Policy on Humane Care and Use of Laboratory Animals, available from the Office of Laboratory Animal Welfare, National Institutes of Health, Department of Health and Human Services, RKLI, Suite 360, MSC 7982, 6705 Rockledge Drive, Bethesda, MD 20892-7982 or online at http://grants.nih.gov/grants/olaw/olaw.htm#pol.”
In the subchronic studies, male and female F344/N rats (10 animals/sex/dose) received DMPT at doses of 0, 62.5, 125, 250, 500, or 1,000 mg/kg, and male and female mice received doses of 0, 15, 30, 60, 125, and 250 mg/kg for up to 14 weeks by oral gavage, 5 days per week (corn oil vehicle). An additional group of 10 male and 10 female rats for clinical pathology evaluations at 25 days received the same doses as the core study groups. For the chronic studies, male and female F344/N rats and B6C3F1/N mice receivedDMPT (50 animals/sex/dose) for up to 104 weeks at doses of 0, 6, 20, or 60 mg/kg.
Clinical Chemistry
Blood was collected from the retroorbital sinus for hematology and clinical chemistry analyses from the clinical pathology rats on day 25 and from surviving core study rats at study termination. On day 88, blood was collected from core study rats for hemoglobin and methemoglobin only. Blood was collected for hematology analyses from surviving mice at study termination. Blood for methemoglobin analyses (rats) was collected within 4 hr of dosing; otherwise, blood was collected within 24 hr of dosing.
For hematology evaluations, erythrocyte, platelet, leukocyte (total and differential), and reticulocyte counts, hematocrit values, hemoglobin concentration, mean cell volume, mean cell hemoglobin, and mean cell hemoglobin concentration were determined using an ADVIA 120 analyzer (Bayer Diagnostics Division, Tarrytown, NY). Romanowsky-stained blood smears were evaluated microscopically for blood morphology and enumeration of nucleated erythrocytes/100 white cells. Blood smears, prepared from supravitally stained whole blood, were used for the enumeration of Heinz bodies (Brecher and Schneiderman 1950). Methemoglobin concentration was determined by the method of Evelyn and Malloy (1938) using reagents purchased from Sigma Chemical Company (St. Louis, MO). Serum clinical chemistry end points, including urea nitrogen, creatinine, total protein, albumin, and bile acid concentrations and activities of alanine aminotransferase (ALT), alkaline phosphatase, creatinine kinase, and sorbitol dehydrogenase (SDH), were obtained using a Hitachi 911 analyzer (Boehringer Mannheim, Indianapolis, IN)
Necropsy and Pathology
Complete necropsies were performed on all animals after sacrifice when moribund or at the end of the 2-year exposure period. At necropsy, all organs and tissues were examined for grossly visible lesions. Tissues were preserved in 10% neutral buffered formalin, embedded in paraffin, sectioned, and stained with hematoxylin and eosin. The following tissues were examined microscopically from male and/or female animals: gross lesions and tissue masses, adrenal gland, bone with marrow, brain, clitoral gland, esophagus, heart, large intestine (cecum, colon, and rectum), small intestine (duodenum, jejunum, and ileum), kidney, liver, lung, lymph nodes (mandibular and mesenteric), mammary gland (except male mice), nose, ovary, pancreas, pancreatic islets, parathyroid gland, pituitary gland, preputial gland, prostate gland, salivary gland, skin, spleen, stomach (forestomach and glandular), testis with epididymis and seminal vesicle, thymus, thyroid gland, trachea, urinary bladder, and uterus. Following completion of the studies, the accuracy of the histopathologic diagnoses was determined by NTP pathology reviews (Boorman and Eustis 1986; Hardisty and Boorman 1986).
Statistical Analysis
For continuous variables, end points with a relatively normal distribution (e.g., organ and body weights) were analyzed using the parameteric multiple comparison procedures (Dunnett 1955; Williams 1971, 1972). Data that typically demonstrate a skewed distribution (e.g., hematology variables) were analyzed using the nonparameteric multiple comparison procedures (Dunn 1964). The poly-3 test, which takes survival differences into account, was used to assess neoplastic and nonneoplastic lesion incidence (Bailer and Portier 1988; Piegorsch and Bailer 1997; Portier and Bailer 1989). When applied to all exposure groups, this test evaluates the significance of a dose-related trend in lesions; when applied to the control group and 1 exposure group, the test evaluates the significance of the pairwise difference of lesion incidence in the exposed group compared to the control group.
Results
Subchronic Study
All male and female rats receiving 1,000 mg/kg and one 500 mg/kg male died within the first 3 days of dosing; all others survived to study termination (Table 1). For mice, 9 males and all females receiving 250 mg/kg died within the first 10 days of dosing. Additionally, 3 males and 2 females administered 125 mg/kg died before the end of the study; all others survived to study termination (Table 1). Dose-related body weight decreases were observed in male and female rats (62.5 mg/kg or greater) and mice (125 mg/kg or greater) administered DMPT (Table 1).
Table 1.
Selected findings for F344/N rats in the subchronic oral gavage study of N,N-dimethyl-p-toluidine.
| Dose (mg/kg) | 0 | 62.5 | 125 | 250 | 500 |
|---|---|---|---|---|---|
| A. Male rats | |||||
| Survival | 10/10 | 10/10 | 10/10 | 10/10 | 9/10 |
| Final mean body weight (g) | 327 ± 2 | 296 ± 5** | 289 ± 8** | 252 ± 5** | 234 ± 9** |
| Final body weight (% control) | — | 90 | 88 | 77 | 72 |
| Hematology | |||||
| Hematocrit, % | |||||
| Day 25 | 49.7 ± 0.3 | 45.0 ± 0.5** | 42.8 ± 0.4** | 40.2 ± 0.5** | 39.2 ± 0.5** |
| Week 14 | 46.1 ± 0.4 | 42.1 ± 0.5** | 42.3 ± 0.4** | 42.1 ± 0.4** | 42.4 ± 0.7** |
| Hemoglobin, g/dl | |||||
| Day 25 | 15.3 ± 0.1 | 13.3 ± 0.1** | 12.5 ± 0.1** | 11.8 ± 0.1** | 11.0 ± 0.1** |
| Week 14 | 14.8 ± 0.1 | 13.0 ± 0.2** | 13.0 ± 0.1** | 12.9 ± 0.1** | 12.7 ± 0.2** |
| Erythrocytes, 106/μl | |||||
| Day 25 | 8.26 ± 0.05 | 7.44 ± 0.07** | 6.79 ± 0.07** | 5.97 ± 0.09** | 5.06 ± 0.05** |
| Week 14 | 8.62 ± 0.07 | 7.43 ± 0.08** | 6.94 ± 0.05** | 6.40 ± 0.07** | 6.19 ± 0.07** |
| Reticulocytes, 106/μl | |||||
| Day 25 | 0.26 ± 0.01 | 0.50 ± 0.01** | 0.64 ± 0.01** | 0.94 ± 0.03** | 1.08 ± 0.03** |
| Week 14 | 0.25 ± 0.01 | 0.50 ± 0.01** | 0.60 ± 0.02** | 0.76 ± 0.01** | 0.89 ± 0.04** |
| Nucleated erythrocytes/100 leukocytes | |||||
| Day 25 | 0.2 ± 0.1 | 1.3 ± 0.4* | 1.3 ± 0.5* | 4.7 ± 0.7** | 21.6 ± 2.1** |
| Week 14 | 0.2 ± 0.1 | 0.9 ± 0.2* | 2.0 ± 0.4** | 1.7 ± 0.3** | 3.6 ± 0.6** |
| Mean cell volume, fl | |||||
| Day 25 | 60.2 ± 0.2 | 60.5 ± 0.2 | 63.1 ± 0.2** | 67.5 ± 0.6** | 77.5 ± 0.5** |
| Week 14 | 53.5 ± 0.3 | 56.6 ± 0.3** | 61.1 ± 0.3** | 65.8 ± 0.3** | 68.5 ± 0.6** |
| Mean cell hemoglobin, pg | |||||
| Day 25 | 18.5 ± 0.1 | 17.9 ± 0.1 | 18.4 ± 0.1 | 19.7 ± 0.1** | 21.8 ± 0.1** |
| Week 14 | 17.2 ± 0.1 | 17.5 ± 0.1* | 18.7 ± 0.1** | 20.1 ± 0.1** | 20.6 ± 0.2** |
| Mean cell hemoglobin concentration, g/dl | |||||
| Day 25 | 30.8 ± 0.1 | 29.7 ± 0.1** | 29.2 ± 0.2** | 29.2 ± 0.1** | 28.2 ± 0.1** |
| Week 14 | 32.1 ± 0.1 | 31.0 ± 0.2** | 30.7 ± 0.1** | 30.5 ± 0.1** | 30.0 ± 0.1** |
| Methemoglobin, g/dl | |||||
| Day 25 | 0.35 ± 0.03 | 0.90 ± 0.04** | 1.56 ± 0.04**a | 1.95 ± 0.05** | 1.63 ± 0.06** |
| Day 88 | 0.38 ± 0.02 | 1.37 ± 0.08** | 1.95 ± 0.07** | 2.29 ± 0.08** | 2.03 ± 0.08** |
| Methemoglobin, % hemoglobin | |||||
| Day 25 | 2.40 ± 0.22 | 6.70 ± 0.30** | 12.44 ± 0.41** | 16.60 ± 0.31** | 14.75 ± 0.56** |
| Day 88 | 2.44 ± 0.18 | 10.10 ± 0.55** | 15.50 ± 0.48** | 18.20 ± 0.53** | 17.67 ± 0.71** |
| Heinz bodies, % erythrocytes | |||||
| Day 25 | 0.0 ± 0.0 | 0.0 ± 0.0 | 2.0 ± 0.6** | 14.5 ± 1.9** | 23.5 ± 2.6** |
| Week 14 | 0.0 ± 0.0 | 0.5 ± 0.2** | 2.8 ± 0.3** | 4.1 ± 0.4** | 2.9 ± 0.8** |
| Clinical chemistry | |||||
| Alanine amimotransferase, IU/L | |||||
| Day 25 | 45 ± 1 | 56 ± 2** | 88 ± 6** | 163 ± 17** | 172 ± 19** |
| Week 14 | 72 ± 5 | 52 ± 4* | 62 ± 6 | 51 ± 4** | 58 ± 7 |
| Sorbital dehydrogenase, IU/L | |||||
| Day 25 | 18 ± 1 | 25 ± 1** | 40 ± 2** | 51 ± 5** | 45 ± 6** |
| Week 14 | 22 ± 2 | 23 ± 2 | 24 ± 3 | 18 ± 2 | 20 ± 2 |
| Bile acid, μmole/L | |||||
| Day 25 | 12.1 ± 1.9 | 13.5 ± 2.5 | 22 ± 4** | 14.6 ± 2.4 | 21.1 ± 3.1 |
| Week 14 | 6.3 ± 1.1 | 9.1 ± 1.8 | 11.8 ± 2.3* | 13.5 ± 1.6** | 18.9 ± 2.5** |
| Histopathology and organ weight | |||||
| Liver weight | 11.6 ± 0.2 | 13.6 ± 0.4* | 14.9 ± 0.7** | 14.1 ± 0.4** | 14.4 ± 0.9** |
| Hepatocellular hypertrophy | 0 | 2 (1.0)b | 9 (1.0)** | 10 (1.2)** | 10 (1.8)** |
| Nasal glands—hyperplasia | 0 | 0 | 10 (1.8)** | 10 (2.1)** | 9 (2.1)** |
| Olfactory epithelium—dengeneration | 0 | 5 (1.0)* | 10 (2.5)** | 10 (3.0)** | 10 (3.1)** |
| Olfactory epithelium—metaplasia | 0 | 0 | 0 | 9 (1.9)** | 9 (2.9)** |
| Respiratory epithelium—hyperplasia | 1 (1.0) | 2 (1.0) | 7 (1.4)** | 10 (1.5)** | 9 (1.8)** |
| Respiratory epithelium metaplasia | 0 | 8 (1.5)** | 10 (2.5)** | 10 (2.8)** | 9 (3.0)** |
| B. Female rats | |||||
| Survival | 10/10 | 10/10 | 10/10 | 10/10 | 10/10 |
| Mean body weight (g) | 193 ± 3 | 183 ± 3* | 172 ± 4** | 174 ± 3** | 175 ± 3** |
| Body weight (% control) | — | 95 | 89 | 90 | 91 |
| Hematocrit, % | |||||
| Day 25 | 48.8 ± 0.4 | 44.9 ± 0.3** | 43.4 ± 0.6** | 40.8 ± 0.5** | 37.0 ± 0.5** |
| Week 14 | 45.2 ± 0.5 | 41.3 ± 0.5** | 40.0 ± 0.6** | 39.0 ± 0.4** | 40.7 ± 0.3** |
| Hematology | |||||
| Hemoglobin, g/dl | |||||
| Day 25 | 15.1 ± 0.1 | 13.3 ± 0.1** | 12.8 ± 0.2** | 11.7 ± 0.1** | 10.8 ± 0.2** |
| Week 14 | 14.8 ± 0.1 | 12.8 ± 0.1** | 12.7 ± 0.1** | 12.0 ± 0.2** | 12.4 ± 0.1** |
| Erythrocytes, 106/μl | |||||
| Day 25 | 8.36 ± 0.07 | 7.42 ± 0.07** | 6.90 ± 0.10** | 5.93 ± 0.05** | 5.15 ± 0.08** |
| Week 14 | 8.16 ± 0.07 | 6.84 ± 0.08** | 6.59 ± 0.10** | 6.08 ± 0.10** | 5.72 ± 0.06** |
| Reticulocytes, 106/μl | |||||
| Day 25 | 0.18 ± 0.01 | 0.55 ± 0.02** | 0.62 ± 0.03** | 0.99 ± 0.05** | 1.07 ± 0.04** |
| Week 14 | 0.26 ± 0.01 | 0.50 ± 0.03** | 0.54 ± 0.02** | 0.90 ± 0.02** | 1.11 ± 0.04** |
| Nucleated erythrocytes/100 leukocytes | |||||
| Day 25 | 0.4 ± 0.2 | 1.6 ± 0.3** | 3.2 ± 0.4** | 4.1 ± 0.6** | 16.8 ± 1.5** |
| Week 14 | 0.7 ± 0.3 | 1.4 ± 0.3 | 2.2 ± 0.3** | 3.7 ± 0.4** | 5.8 ± 0.7** |
| Mean cell volume, fl | |||||
| Day 25 | 58.4 ± 0.1 | 60.5 ± 0.2** | 62.9 ± 0.3** | 68.7 ± 0.4** | 71.9 ± 0.6** |
| Week 14 | 55.4 ± 0.2 | 60.4 ± 0.2** | 60.7 ± 0.4** | 64.2 ± 0.5** | 71.2 ± 0.5** |
| Mean cell hemoglobin, pg | |||||
| Day 25 | 18.0 ± 0.1 | 17.9 ± 0.1 | 18.5 ± 0.1** | 19.8 ± 0.1** | 20.9 ± 0.1** |
| Week 14 | 18.1 ± 0.0 | 18.7 ± 0.1** | 19.3 ± 0.2** | 19.8 ± 0.1** | 21.7 ± 0.1** |
| Mean cell hemoglobin concentration, g/dl | |||||
| Day 25 | 30.9 ± 0.1 | 29.5 ± 0.1** | 29.4 ± 0.1** | 28.8 ± 0.1** | 29.0 ± 0.2** |
| Week 14 | 32.7 ± 0.1 | 31.1 ± 0.1** | 31.9 ± 0.2** | 30.9 ± 0.2** | 30.5 ± 0.1** |
| Methemoglobin, g/dl | |||||
| Day 25 | 0.37 ± 0.02 | 0.86 ± 0.07** | 1.63 ± 0.05** | 1.86 ± 0.05** | 1.65 ± 0.03** |
| Day 88 | 0.38 ± 0.01 | 1.49 ± 0.07** | 2.20 ± 0.13** | 2.49 ± 0.10** | 1.75 ± 0.07** |
| Methemoglobin, % hemoglobin | |||||
| Day 25 | 2.70 ± 0.15 | 6.40 ± 0.58** | 12.80 ± 0.39** | 16.00 ± 0.45** | 15.50 ± 0.31** |
| Day 88 | 2.88 ± 0.13 | 11.20 ± 0.44** | 17.22 ± 1.18**c | 19.70 ± 0.62** | 16.00 ± 0.42** |
| Heinz bodies, % erythrocytes | |||||
| Day 25 | 0.0 ± 0.0 | 0.0 ± 0.0 | 1.5 ± 0.3** | 14.4 ± 0.8** | 21.2 ± 1.8** |
| Week 14 | 0.0 ± 0.0 | 0.2 ± 0.0** | 4.8 ± 0.7** | 6.8 ± 0.6** | 16.0 ± 1.8** |
| Clinical chemistry | |||||
| Alanine amimotransferase, IU/L | |||||
| Day 25 | 34 ± 1 | 32 ± 1 | 43 ± 1* | 88 ± 1** | 149 ± 9** |
| Week 14 | 53 ± 4 | 35 ± 1 | 42 ± 4 | 61 ± 7 | 83 ± 18 |
| Sorbitol dehydrogenase, IU/L | |||||
| Day 25 | 13 ± 1 | 17 ± 1 | 27 ± 1 | 47 ± 5** | 60 ± 4** |
| Week 14 | 16 ± 1 | 21 ± 1* | 25 ± 4* | 27 ± 5* | 24 ± 5 |
| Bile acid, μmole/L | |||||
| Day 25 | 7.2 ± 0.7 | 11.1 ± 1.6 | 12.8 ± 1.5** | 11.5 ± 1.6** | 20.7 ± 2.1 |
| Week 14 | 8.9 ± 1.6 | 14.1 ± 2.4 | 13.2 ± 1.0 | 11.9 ± 1.2 | 32.2 ± 3.5** |
| Histopathology and organ weight | |||||
| Liver weight (g) | 6.2 ± 0.1 | 8.6 ± 0.2** | 9.1 ± 0.3** | 10.6 ± 0.2** | 12.6 ± 0.4** |
| Hepatocellular hypertrophy | 0 | 1 (1.0) | 7 (1.0)** | 9 (1.1)** | 10 (2.7)** |
| Nasal glands—hyperplasia | 0 | 3 (1.0) | 9 (1.7)** | 10 (1.9)** | 10 (2.0)** |
| Olfactory epithelium—dengeneration | 0 | 7 (1.3)* | 10 (2.1)** | 10 (3.0)** | 10 (3.0)** |
| Olfactory epithelium—metaplasia | 0 | 0 | 0 | 7 (1.6)** | 10 (2.9)** |
| Respiratory epithelium—hyperplasia | 0 | 1 (1.0) | 7 (1.1)** | 10 (1.7)** | 10 (1.7)** |
Note. N = 8 to 10 for male rat end points; N = 9 to 10 per female rat end point.
Data presented as M ± SE.
Lesion severity grade.
p ≤ .05.
p ≤ .01.
In rats, the hematology findings were consistent with a macrocytic, hypochromic, regenerative anemia; methemoglobinemia; and increased Heinz body production (Table 2). In general, these changes were dose-related, occurred at both time points evaluated, and involved all dosed groups of both sexes. The anemia was characterized by dose-related decreases in the erythron including decreases in hematocrit values, hemoglobin concentrations, and erythrocyte counts. The greatest magnitudes of decrease occurred in the 500 mg/kg groups on day 25; the decrease was greater than 20% for hematocrit and hemoglobin values and close to 40% for erythrocyte counts. Erythrocyte macrocytosis and hypochromia were characterized by increases in mean cell volume and decreases in mean cell hemoglobin concentration values, respectively. An erythropoietic response to the anemia was characterized by increased reticulocyte and nucleated erythrocyte counts. The methemoglobinemia was characterized by a treatment-related increase in methemoglobin values (percentage and absolute). At the end of the subchronic studies, the increase in methemoglobin ranged between 4 and 7.5 times that of control values, depending on dose in both sexes. Consistent with the methemoglobinemia was the clinical occurrence of cyanosis observed at the higher doses in the subchronic rat study. Erythrocyte injury was evidenced by the increased formation of Heinz bodies within red blood cells (Table 2 and Figure 2). Besides the increased Heinz bodies, treated animals demonstrated an increase in the central pallor of the erythrocytes and increased numbers of polychromatophilic and leptocytic erythrocytes (Figure 2).
Table 2.
Selected findings for B6C3F1 mice in the subchronic oral gavage study of N,N-dimethyl-p-toluidine.
| Dose (mg/kg) | 0 | 15 | 30 | 60 | 125 |
|---|---|---|---|---|---|
| A. Males | |||||
| Survival | 10/10 | 10/10 | 10/10 | 10/10 | 7/10 |
| Final mean body weight (g) | 33.6 ± 1.4 | 35.2 ± 0.5 | 33.0 ± 1.0 | 33.1 ± 1.0 | 29.5 ± 0.4* |
| Final mean body weight (% control) | — | 105 | 98 | 99 | 88 |
| Hematology | |||||
| Hematocrit (%) | 46.6 ± 0.6 | 43.7 ± 0.5* | 45.4 ± 0.6 | 43.5 ± 0.5** | 44.7 ± 0.5 |
| Hemoglobin (g/dl) | 16.4 ± 0.3 | 15.5 ± 0.2 | 16.0 ± 0.3 | 15.0 ± 0.1** | 15.3 ± 0.1** |
| Erythrocytes (106/μl) | 10.82 ± 0.18 | 10.18 ± 0.14* | 10.63 ± 0.15 | 10.14 ± 0.12* | 10.27 ± 0.10 |
| Reticulocytes (106/μl) | 0.25 ± 0.01 | 0.24 ± 0.01 | 0.26 ± 0.01 | 0.27 ± 0.01 | 0.28 ± 0.01* |
| Mean cell volume (fl) | 43.1 ± 0.2 | 42.9 ± 0.2 | 42.8 ± 0.1 | 42.9 ± 0.2 | 43.5 ± 0.4 |
| Mean cell hemoglobin (pg) | 15.2 ± 0.1 | 15.2 ± 0.1 | 15.0 ± 0.2 | 14.8 ± 0.1* | 15.0 ± 0.1 |
| Mean cell hemoglobin concentration (g/dl) | 35.3 ± 0.3 | 35.4 ± 0.3 | 35.1 ± 0.4 | 34.5 ± 0.2 | 34.4 ± 0.3 |
| Methemoglobin (g/dl) | 0.35 ± 0.02 | 0.36 ± 0.02 | 0.42 ± 0.02* | 0.47 ± 0.02** | 0.61 ± 0.03** |
| Methemoglobin (% hemoglobin) | 2.10 ± 0.10 | 2.50 ± 0.17 | 2.80 ± 0.13** | 3.10 ± 0.10** | 4.00 ± 0.22** |
| Heinz bodies (% erythrocytes) | 0.0 ± 0.0 | 0.0 ± 0.0 | 0.0 ± 0.0 | 0.0 ± 0.0 | 0.5 ± 0.1** |
| Histopathology and organ weight | |||||
| Liver weight (g) | 1.43 ± 0.07 | 1.88 ± 0.03** | 1.72 ± 0.0.09** | 1.91 ± 0.07** | 2.01 ± 0.0.04** |
| Nasal glands—hyperplasia | 0 | 0 | 0 | 0 | 7 (2.0)* |
| Olfactory epithelium—degeneration | 0 | 0 | 0 | 0 | 9 (2.9)** |
| Olfactory epithelium—metaplasia | 0 | 0 | 0 | 0 | 6 (2.3)** |
| B. Females | |||||
| Survival | 10/10 | 10/10 | 10/10 | 10/10 | 8/10 |
| Final mean body weight (g) | 27.7 ± 0.7 | 29.4 ± 0.5 | 28.2 ± 0.9 | 27.8 ± 0.6 | 26.2 ± 0.3 |
| Final body weight (% control) | — | 106 | 102 | 100 | 95 |
| Hematology | |||||
| Hematocrit (%) | 44.9 ± 0.4 | 43.8 ± 0.6 | 45.5 ± 0.6 | 44.9 ± 0.4 | 46.4 ± 0.7 |
| Hemoglobin (g/dl) | 15.8 ± 0.3 | 15.5 ± 0.2 | 16.1 ± 0.2 | 15.7 ± 0.1 | 16.1 ± 0.2 |
| Erythrocytes (106/μl) | 10.42 ± 0.11 | 10.13 ± 0.15 | 10.57 ± 0.14 | 10.41 ± 0.07 | 10.64 ± 0.12 |
| Reticulocytes (106/μl) | 0.26 ± 0.02 | 0.26 ± 0.02 | 0.24 ± 0.02 | 0.24 ± 0.02 | 0.31 ± 0.02 |
| Mean cell volume (fl) | 43.1 ± 0.1 | 43.2 ± 0.1 | 43.0 ± 0.1 | 43.1 ± 0.1 | 43.6 ± 0.2 |
| Mean cell hemoglobin (pg) | 15.1 ± 0.2 | 15.3 ± 0.1 | 15.2 ± 0.1 | 15.1 ± 0.0 | 15.2 ± 0.0 |
| Mean cell hemoglobin concentration (g/dl) | 35.1 ± 0.4 | 35.4 ± 0.2 | 35.3 ± 0.2 | 35.1 ± 0.1 | 34.8 ± 0.2* |
| Methemoglobin (g/dl) | 0.32 ± 0.01 | 0.34 ± 0.02 | 0.43 ± 0.02** | 0.53 ± 0.02** | 0.58 ± 0.03** |
| Methemoglobin (% hemoglobin) | 2.10 ± 0.10 | 2.22 ± 0.15 | 2.60 ± 0.16* | 3.40 ± 0.16** | 3.88 ± 0.13** |
| Heinz bodies (% erythrocytes) | 0.0 ± 0.0 | 0.0 ± 0.0 | 0.1 ± 0.1 | 0.2 ± 0.1** | 0.5 ± 0.1** |
| Histopathology and organ weight | |||||
| Liver weight (g) | 1.20 ± 0.03 | 1.47 ± 0.04** | 1.51 ± 0.06** | 1.60 ± 0.05** | 1.71 ± 0.04** |
| Nasal glands—hyperplasia | 0 | 0 | 0 | 0 | 7 (2.1)*a |
Note. N = 7 to 10 for male mouse end point; N = 8 to 10 for female mouse end points. Data presented as M ± SE.
Lesion severity grade (no clinical chemistry for mice; mouse hematology at week 14).
p ≤ .05.
p ≤ .01.
Figure 2.
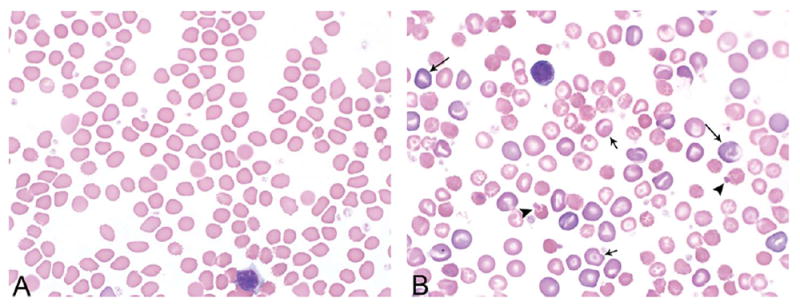
Representative blood smear morphology photomicrographs of control (A) and high-dose (B) animals from the 3-month gavage study of N,N-dimethyl-p-toluidine. Smears are from female rats at day 25. Treated animals demonstrated an increase in the central pallor of the erythrocytes, increased numbers of polychromatophilic (long arrows), and leptocytic erythrocytes (short arrows) and Heinz bodies (arrow heads); leptocytes included various forms of stomatocytes, knizocytes, and codocytes.
At equivalent dosing concentrations, mice demonstrated similar, but less severe erythron changes compared to rats (Table 3). In fact, for female mice, no erythron changes were detected up to the highest remaining dose (i.e., 125 mg/kg) and, for males, inconsistent and minor decreases in hematocrit values, hemoglobin concentrations, and erythrocyte counts and increased reticulocyte counts occurred in the 60 mg/kg and greater groups (including the lone surviving male at 250 mg/kg). Methemoglobin values were minimally increased in the 30 mg/kg or greater males and females. There were small increases in Heinz bodies in the 60 mg/kg females, 125 mg/kg males and females, and the remaining male at 250 mg/kg.
Table 3.
Selected findings for F344/N rats and B6C3F1 mice in the 2-year oral gavage study of N,N-dimethyl-p-toluidine.
| Male rats (mg/kg) | 0 | 6 | 20 | 60 |
| Final survival | 38 | 40 | 33 | 25 |
| Final mean body weight (g) | 500 | 517 | 475 | 411 |
| Final mean body weight (% control) | — | 103 | 95 | 82 |
| Hematocrit (%) | 48.8 ± 0.5 | 48.4 ± 0.4 | 46.5 ± 0.3** | 42.6 ± 0.3** |
| Hemoglobin (g/dl) | 16.0 ± 0.2 | 15.6 ± 0.1* | 14.7 ± 0.1** | 13.2 ± 0.1** |
| Erythrocytes (106/μl) | 9.10 ± 0.10 | 9.02 ± 0.06 | 8.53 ± 0.04** | 7.61 ± 0.06** |
| Reticulocytes (106/μl) | 0.25 ± 0.01 | 0.26 ± 0.01* | 0.35 ± 0.01** | 0.69 ± 0.02** |
| Mean cell volume (fl) | 53.7 ± 0.2 | 53.6 ± 0.2 | 54.5 ± 0.2** | 56.0 ± 0.1** |
| Mean cell hemoglobin (pg) | 17.5 ± 0.1 | 17.3 ± 0.1 | 17.3 ± 0.1 | 17.3 ± 0.1 |
| Mean cell hemoglobin concentration (g/dl) | 32.7 ± 0.2 | 32.2 ± 0.2 | 31.6 ± 0.1** | 30.9 ± 0.2** |
| Methemoglobin (g/dl) | 0.77 ± 0.04 | 0.88 ± 0.03* | 1.14 ± 0.03** | 2.30 ± 0.03** |
| Methemoglobin (% hemoglobin) | 4.70 ± 0.26 | 5.60 ± 0.22* | 7.90 ± 0.18** | 17.40 ± 0.22** |
| Heinz bodies (% erythrocytes) | 0.0 ± 0.0 | 0.1 ± 0.1 | 0.7 ± 0.2** | 3.7 ± 0.3** |
| Female rats (mg/kg) | 0 | 6 | 20 | 60 |
| Final survival | 34 | 43 | 38 | 38 |
| Final mean body weight (g) | 353 | 368 | 346 | 291 |
| Final mean body weight (% control) | — | 104 | 98 | 82 |
| Hematocrit (%) | 46.9 ± 0.5 | 45.8 ± 0.6 | 44.2 ± 0.6** | 41.3 ± 0.6** |
| Hemoglobin (g/dl) | 15.8 ± 0.2 | 15.1 ± 0.2* | 14.4 ± 0.2** | 13.2 ± 0.1** |
| Erythrocytes (106/μl) | 8.50 ± 0.09 | 8.31 ± 0.10 | 7.88 ± 0.08** | 6.95 ± 0.09** |
| Reticulocytes (106/μl) | 0.24 ± 0.01 | 0.24 ± 0.01 | 0.35 ± 0.01** | 0.70 ± 0.02** |
| Mean cell volume (fl) | 55.1 ± 0.2 | 55.1 ± 0.2 | 56.1 ± 0.3* | 59.4 ± 0.2** |
| Mean cell hemoglobin (pg) | 18.6 ± 0.1 | 18.2 ± 0.1* | 18.3 ± 0.1 | 19.0 ± 0.1 |
| Mean cell hemoglobin concentration (g/dl) | 33.8 ± 0.2 | 33.1 ± 0.2* | 32.6 ± 0.2** | 32.0 ± 0.2** |
| Methemoglobin (g/dl) | 0.80 ± 0.03 | 0.87 ± 0.03 | 1.21 ± 0.05** | 2.26 ± 0.07** |
| Methemoglobin (% hemoglobin) | 5.10 ± 0.23 | 5.60 ± 0.27 | 8.40 ± 0.31** | 17.10 ± 0.41** |
| Heinz bodies (% erythrocytes) | 0.0 ± 0.0 | 0.3 ± 0.2* | 0.9 ± 0.3** | 3.8 ± 0.2** |
| Male mice (mg/kg) | 0 | 15 | 30 | 60 |
| Final survival | 36 | 39 | 33 | 36 |
| Final mean body weight (g) | 55.3 | 53.3 | 50.4 | 46.5 |
| Final mean body weight (% control) | — | 97 | 91 | 84 |
| Female mice (mg/kg) | 0 | 15 | 30 | 60 |
| Final survival | 43 | 43 | 42 | 34 |
| Final mean body weight (g) | 62.8 | 61.0 | 63.9 | 45.0 |
| Final mean body weight (% control) | — | 101 | 104 | 84 |
Note. N = 10 for male and female rat hematology end points at 3 months into the 2-year studies (hematology end points for rats at 3 months; hematology end points not taken for mice).
The occurrence of treatment-related toxic lesions in the spleen and bone marrow of surviving male and female rats supported the hematology and clinical chemistry findings. In the spleen of dosed rats, there was generally an increase in hematopoiesis, hemosiderin deposition, and/or congestion. These splenic lesions were not seen in mice where the hematologic effect was less severe than in rats. Other splenic lesions observed in rats exposed to 125 mg/kg or more included congestion and fibrosis of the capsule. Bone marrow hyperplasia occurred in all groups of treated rats but not in control rats.
In rats, at day 25, markers of hepatocellular injury, serum activities of ALT and SDH, demonstrated a dose-related increase in essentially all male and female rat dose groups; the high-dose animals had increases of >3-fold. By week 14, the increases in ALT and SDH had ameliorated or resolved in all dose groups (Table 1). Serum concentration of total bile acids, a marker of hepatic function/injury and cholestasis, was increased in higher dose animals; the 500 mg/kg groups were the most consistently affected demonstrating an ~3-fold increase at both time points (Table 1). Another marker of cholestasis (alkaline phosphatase), however, demonstrated decreases (at day 25) or no change (at week 14). Thus, it would appear that the increase in bile acid concentration was not related to a cholestatic event. The biochemical evidence of a liver effect was supported by increased liver weights (from 129 to 171% of controls in treated male rats and from 146 to 223% of controls in treated female rats over the dose range of 62.5 to 500 mg/kg (Table 1). Additionally, liver weights in male and female mice were increased from 140 to 142% over the dose range of 15 to 125 mg/kg (Table 1). Histologically, changes in the liver were characterized by hepatocellular hypertrophy in rats; this change was not observed in treated mice (Tables 1 and 2).
Nasal cavity lesions were seen in male and female rats at doses of 125 mg/kg and higher including the occurrence of olfactory epithelial degeneration and metaplasia, and respiratory epithelial hyperplasia and metaplasia (Table 1). In the 125 mg/kg mouse groups, nasal cavity lesions included degeneration or necrosis of the olfactory epithelium and hyperplasia of the Bowman’s glands. Degeneration and subsequent regeneration of the bronchiolar epithelium were present in the lungs of mice exposed to 125 mg/kg DMPT (Table 2).
Chronic Study
Because of the hematologic toxicity and body weights 10% lower than controls at doses of greater than 60 mg/kg in the subchronic studies, the high dose selected for the chronic study was 60 mg/kg in both rats and mice. In the chronic study, methemoglobin levels were measured at 3 months in rats, and in males, were 2 and 3.7 times that in controls in the 20 and 60 mg/kg groups, respectively. In females, methemoglobin levels were 1.7 and 3.4 times that of controls in the 20 and 60 mg/kg dose groups, respectively (Table 3). Body weights of high-dose rats were reduced relative to controls. Decreased survival in high-dose rats was associated with DMPT-induced tumor development. The final mean body weights of high-dose mice were lower than controls, and there was decreased survival, particularly in high-dose females, that was considered to be related to tumor formation (Table 3).
In male rats, there was an increase in hepatocellular carcinomas at the high dose (Figures 3 and 4), and an increase in the combined incidence of hepatocellular adenoma and carcinomas. This significant increase in hepatocellular tumors at the high dose exceeded the rate in the historical gavage controls, where none were seen, and the rate in the all route historical controls. In female rats, there was an increase in hepatocellular carcinomas and an increase of hepatocellular adenomas or carcinomas (combined) at the high dose, which exceeded the rates in the corn oil gavage historical controls and the all routes historical controls (Table 4).
Figure 3.
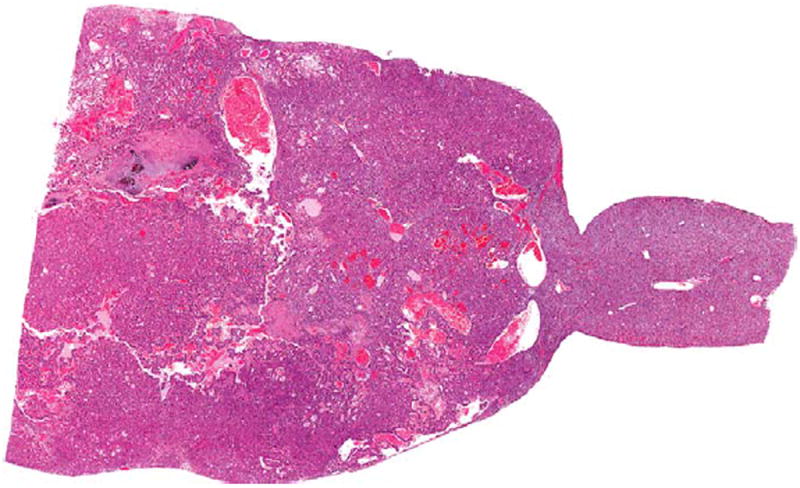
Hepatocellular carcinoma in the liver of a male F344/N rat administered 60 mg/kg DMPT for 2 years. H&E. DMPT = N,Ndimethyl-p-toluidine.
Figure 4.
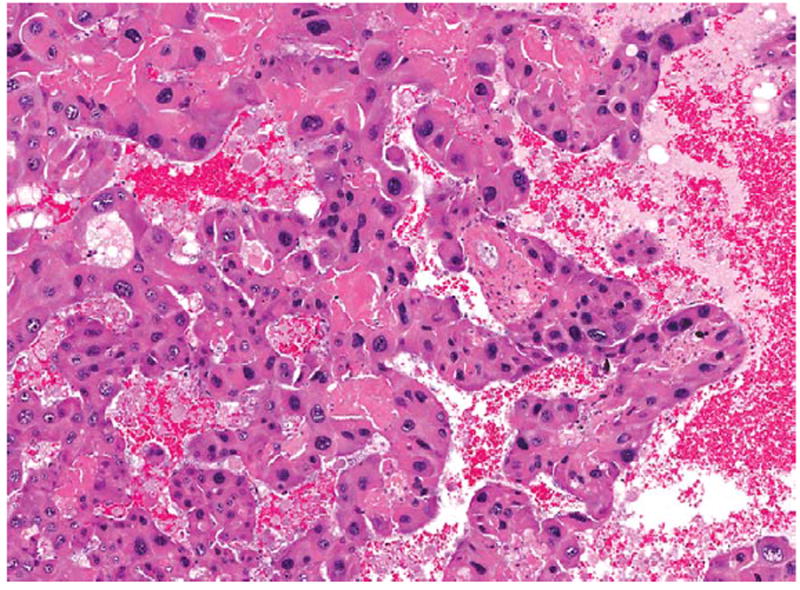
Higher magnification of the hepatocellular carcinoma in Figure 3. There are thickened and irregular trabeculae, composed of pleomorphic cells, which lack normal hepatic architecture. H&E.
Table 4.
Selected liver nonneoplastic and neoplastic lesions from the 2-year N,N-dimethyl-p-toluidine studies F344/N rats and B6C3F1 mice.#
| Dose (mg/kg) | 0 | 6 | 20 | 60 |
|---|---|---|---|---|
| Male rats | ||||
| Hepatocyte hypertrophy | 0 | 0 | 6* | 31** |
| Hepatocellular adenoma | 0 | 0 | 1 | 1 |
| Hepatocellular carcinoma | 0** | 0 | 1 | 6** |
| Hepatocellular adenoma or carcinomaa | 0** | 0 | 2 | 6** |
| Female rats | ||||
| Hepatocyte hypertrophy | 0 | 0 | 6* | 22** |
| Hepatocellular adenoma | 0* | 1 | 1 | 3 |
| Hepatocellular carcinoma | 0** | 0 | 0 | 4* |
| Hepatocellular adenoma or carcinomab | 0** | 1 | 1 | 7** |
| Male mice | ||||
| Hepatocyte hypertrophy | 1 | 9** | 11** | 16** |
| Hepatocellular adenoma, multiple | 17 | 19 | 27* | 26* |
| Hepatocellular carcinoma (includes multiple) | 22** | 25 | 30 | 36** |
| Hepatocellular adenoma or carcinoma | 38** | 44 | 47** | 48** |
| Hepatoblastoma (includes multiple) | 1 | 5 | 10** | 8* |
| Hepatocellular adenoma or carcinoma or hepatoblastomac | 38** | 45 | 48** | 48** |
| Female mice | ||||
| Hepatocyte hypertrophy | 0 | 11** | 10** | 17** |
| Hepatocellular adenoma, (includes multiple) | 17** | 19 | 37** | 44** |
| Hepatocellular carcinoma (includes multiple) | 6** | 13* | 18** | 31** |
| Hepatocellular adenoma or carcinoma | 20* | 25 | 42** | 45** |
| Hepatoblastoma (includes multiple) | 0** | 1 | 0 | 4* |
| Hepatocellular adenoma or carcinoma or hepatoblastomad | 20** | 26 | 42** | 45** |
Note. N = 49 to 50.
Pairwise statistic is under the N,N-dimethyl-p-toluidine (DMPT) dose group columns; trend statistic is under the control column.
Male rat historical data for liver tumors in controls: Historical controls, gavage corn oil: 3/299 (1.0% ± 1.1%), range 0 to 2%; Historical controls, all routes: 23/1,249 (1.8% ± 1.9%), range 0 to 6%.
Female rat historical data for liver tumors in controls: Historical controls, gavage corn oil: 1/300 (0.3% ± 0.8%), range 0 to 2%; Historical controls, all routes: 12/1,200 (1.0% ± 1.6%), range 0 to 4%.
Male mouse historical data for liver tumors in controls: Historical controls, gavage corn oil: 242/350 (69.1% ± 8.0%), range 58 to 78%; Historical controls, all routes: 852/1,149 (74.2% ± 11.5), range 52 to 92%.
Female mouse historical data for liver tumors in controls: Historical controls, gavage corn oil: 91/347 (26.2% ± 12.7%), range 8 to 40%; Historical controls, all routes: 444/1,195 (37.2% ± 22.9), range 6 to 82%.
p ≤ .05.
p ≤ .01.
In male mice, there was an increase in multiple hepatocellular adenomas at the top 2 dose levels, an increase in hepatocellular carcinomas at the top dose level, and an increase in hepatoblastomas at the top 2 dose levels. The combined incidence of hepatocellular adenomas or carcinomas or hepatocellular adenomas, and of hepatocellular carcinomas and hepatoblastomas (combined) was also significant. In female mice, there was an increase in the incidence of hepatocellular adenomas at the top 2 dose levels, an increase in the total incidence of hepatocellular carcinomas (total including multiple) at all 3 dose levels, and an increase in hepatoblastomas at the top dose levels. The combined incidence of hepatocellular adenomas or carcinomas or hepatocellular adenoma, hepatocellular carcinomas and hepatoblastomas (combined) at the top 2 dose levels was also significant (Table 3). Hepatocellular hypertrophy was seen at the 2 highest dose levels in rats and in all 3 dose levels in mice (Table 3).
In male rats, an increase in nasal cavity neoplasms occurred, primarily nasal cavity transitional epithelial adenomas at 60 mg/kg (Table 5). A few transitional epithelial adenomas also occurred in the 6- and 20-mg/kg male rat groups. The occurrence of nasal cavity transitional epithelial adenomas in female rats—1 in the low-dose group and 2 at the high dose—were considered to be related to treatment (Table 5). Nasal tumors have not been seen in the corn oil gavage historical controls and in only 1 of the 1,195 female rats in all routes of exposure historical controls. There were no treatment-related nasal cavity tumors in mice. Treatment-related nonneoplastic nasal cavity lesions occurred in rats including hyperplasia of the olfactory, respiratory, and transitional epithelium (Table 4). Nonneoplastic lesions in the nasal cavity of mice were seen primarily in the high-dose group and were not as extensive as those observed in rats (Figures 5 and 6).
Table 5.
Selected nonneoplastic and neoplastic nasal cavity, thyroid, lung, or forestomach lesions from the 2-year N,N-dimethyl-p-toluidine studies in F344/N rats and/or and B6C3F1 mice.#
| Dose (mg/kg) | 0 | 6 | 20 | 60 |
|---|---|---|---|---|
| Male rats—nasal cavity | ||||
| Transitional epithelium—adenoma | 0** | 3 | 2 | 11** |
| Transitional epithelium—carcinoma | 0* | 0 | 0 | 2 |
| Transitional epithelium—adenoma or carcinoma | 0** | 3 | 2 | 13** |
| Glands, olfactory epithelium—adenoma | 0 | 0 | 0 | 1 |
| Female rat—nasal cavity | ||||
| Transitional epithelium—adenoma | 0 | 1 | 0 | 2 |
| Male rats thyroid | ||||
| Follicular cell—adenoma or carcinoma | 1 | 2 | 2 | 4 |
| Female mice—lung | ||||
| Alveolar/bronchiolar adenoma or carcinoma | 2** | 5 | 9* | 13** |
| Female mouse—forestomach | ||||
| Squamous cell papilloma or carcinoma | 1 | 6 | 6* | 7* |
N = 49 to 50.
Note.
Pairwise statistic is under the N,N-dimethyl-p-toluidine (DMPT) dose group columns; trend statistic is under the control column.
p ≤ .05.
p ≤ .01.
Figure 5.
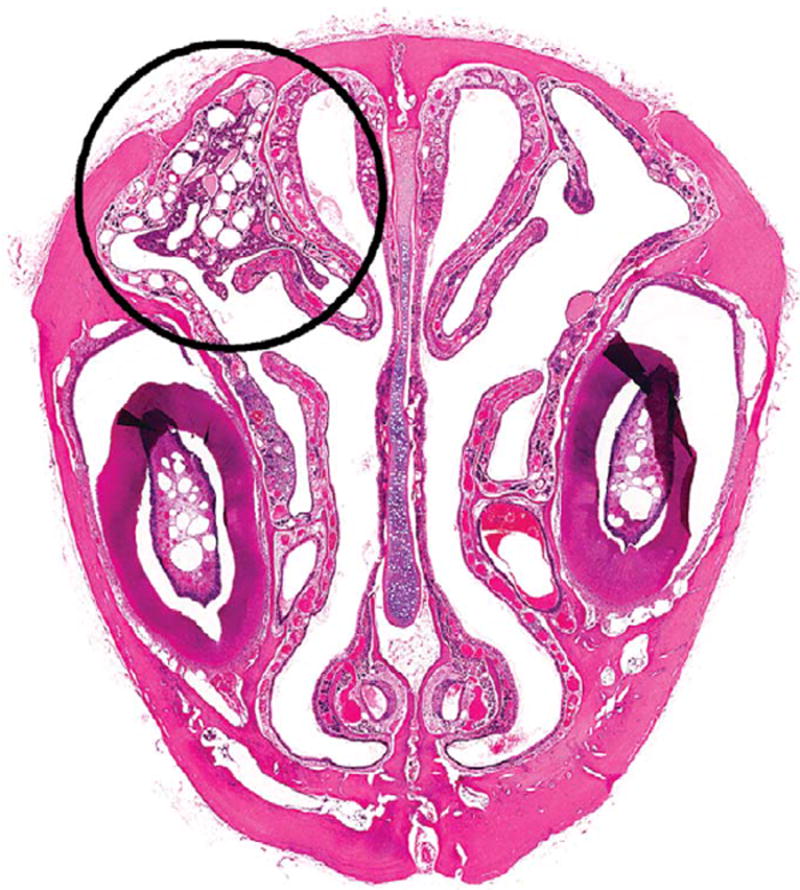
Transitional epithelial adenoma (circled area) on the lateral wall in level I of the nose in a male F344/N rat administered 60-mg/kg DMPT for 2 years. H&E. DMPT = N,N-dimethyl-p-toluidine.
Figure 6.
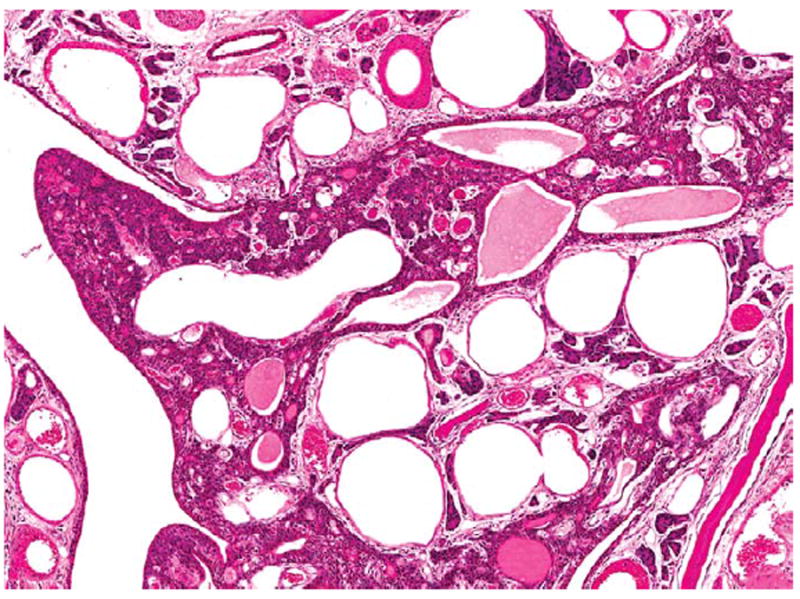
Higher magnification of the transitional epithelial adenoma in Figure 5. H&E.
A few thyroid tumors in male rats occurred in treated groups, and the incidence of follicular cell adenoma or carcinoma (8%) at the high dose exceeded the rate in the corn oil gavage historical controls (0–6%) and in the all routes historical controls (0–6%; Table 5). In female mice, there was an increase in the incidence of alveolar/bronchiolar neoplasms (primarily adenomas) at 20 and 60 mg/kg (Table 5, Figures 7 and 8). Female mice at the high dose had alveolar epithelial hyperplasia, histiocytic infiltrates, and bronchial epithelial regeneration and necrosis.
Figure 7.
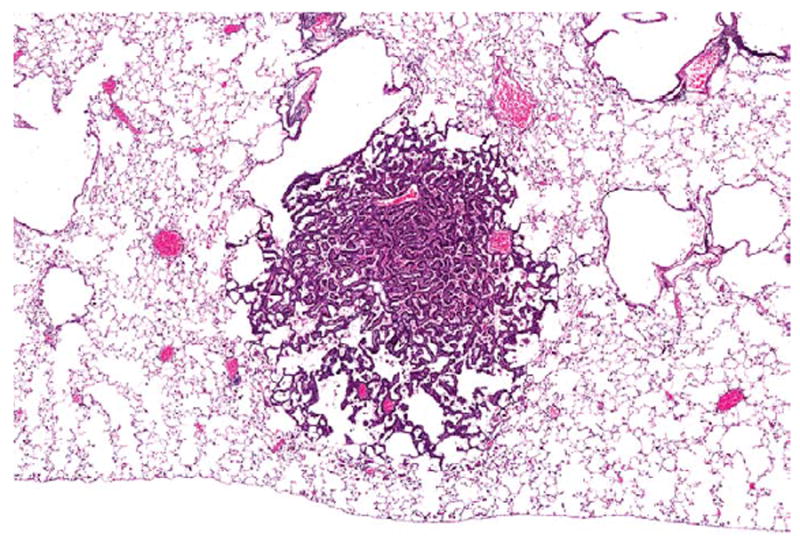
An alveolar/bronchiolar adenoma in the lung of a female B6C3F1/N mouse administered 60 mg/kg DMPT for 2 years. The neoplasm is a discrete lesion causing compression of surrounding lung parenchyma, and composed of papillary projections lined by uniform populations of epithelial cells. H&E. DMPT = N,N-dimethyl-p-toluidine.
Figure 8.
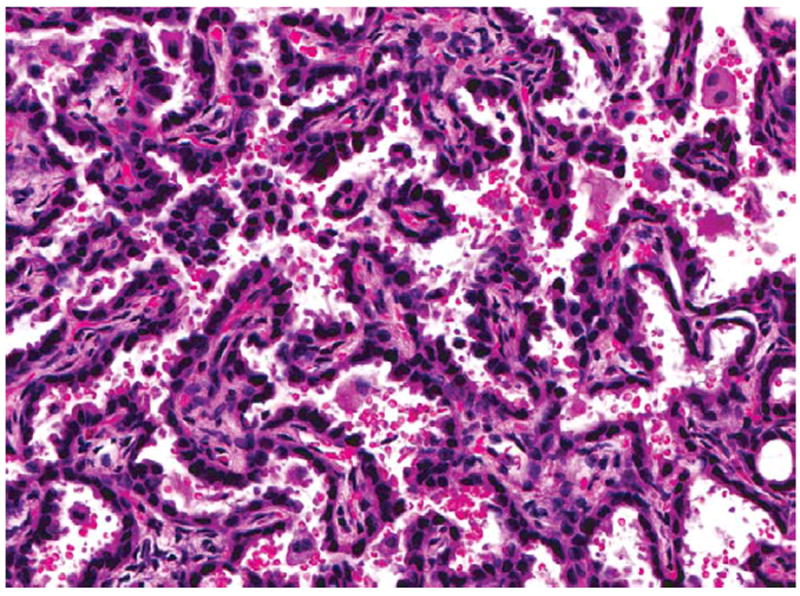
Higher magnification of the alveolar/bronchiolar adenoma in Figure 7. H&E.
The increase incidence of forestomach squamous cell papillomas in female mice was related to DMPT treatment (Table 5, Figure 9). There were significantly increased incidences of squamous cell papilloma (12 and 14%) at the top 2 dose levels. In addition, there were increases in nonneoplastic forestomach lesions in female mice including epithelium hyperplasia (Figure 10). Ulcers and hyperplasia in the forestomach occurred in treated male rats, but therewere no treatment-related forestomach tumors in male rats.
Figure 9.
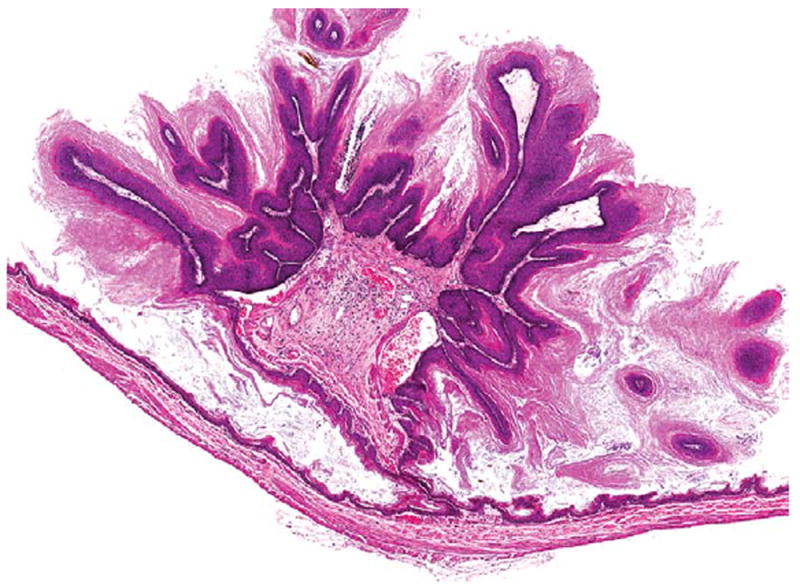
A squamous cell papilloma of the forestomach in a female B6C3F1/N mouse administered 60 mg/kg DMPT for 2 years. H&E. DMPT = N,N-dimethyl-p-toluidine.
Figure 10.
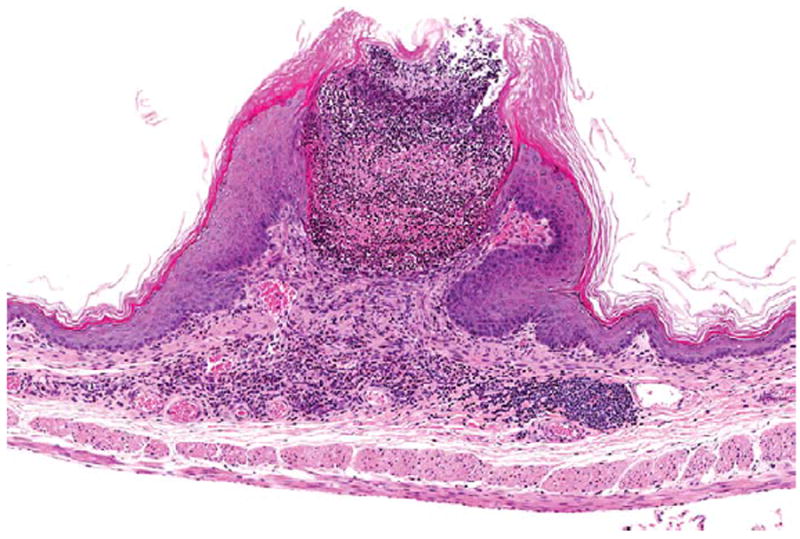
Ulceration, inflammation, and epithelial hyperplasia of the forestomach in a female B6C3F1/N mouse administered 60 mg/kg DMPT for 2 years. H&E. DMPT = N,N-dimethyl-p-toluidine.
Toxic lesions in the hematopoietic system in rats included mesothelial hypertrophy of the splenic capsule (Figures 11 and 12) and bone marrow hyperplasia; in female mice, bone marrow hyperplasia was also seen. Kidney toxicity in rats included an increase in the severity of nephropathy in bothmales and females.
Figure 11.
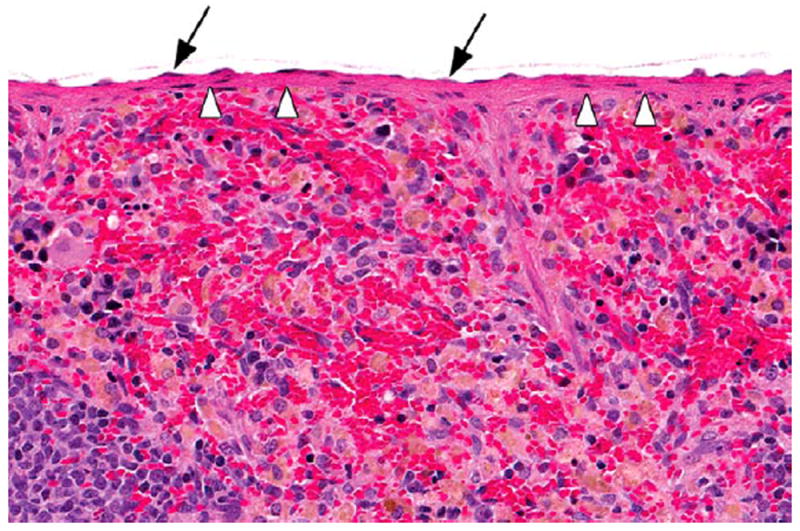
Section of the spleen with a normal capsule (arrowheads) and mesothelium (arrows) in a vehicle control male F344/N rat in the 2-year gavage study of DMPT. H&E. DMPT = N,N-dimethyl-p-toluidine.
Figure 12.
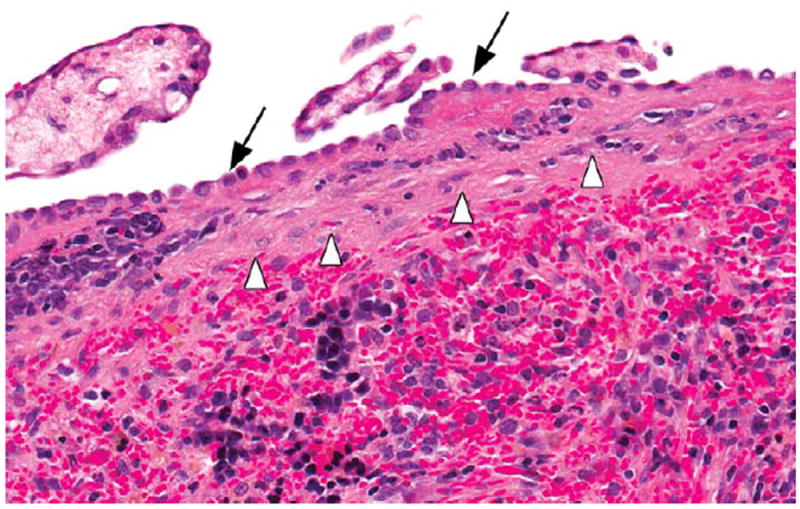
Section of the spleen in a male F344/N rat administered 60-mg/kg N,N-dimethyl-p-toluidine by gavage for 2 years. Note the fibrosis of the splenic capsule (arrowheads) and hypertrophy of the mesothelium (arrows). H&E.
Discussion
DMPT induced toxic and/or carcinogenic effects in the hematologic system, liver, nasal cavity, and other organ systems in rats and/or mice. The hematologic toxicity was characterized by an increase in methemoglobin levels and a macrocytic, hypochromic, responsive anemia particularly in rats. The anemia was defined as an insufficient concentration of hemoglobin and erythrocytes larger than their normal volume. The mechanism for the anemia is thought to involve oxidative damage to hemoglobin leading to Heinz body formation and decreased erythrocyte survival. This effect is similar to methemoglobin-induced anemias in animals and humans after exposure to aniline and other nitroaromatic compounds (Dunnick, Elwell, and Bucher 1994; Finch 1948; Smith 1996).
Methemoglobinemia has been observed in children ingesting artificial fingernail solutions containing DMPT. This effect is thought to arise primarily through formation of p-methylphenylhydroxylamine (Kao et al. 1997; Potter et al. 1988). A similar metabolite of aniline, phenylhydroxylamine, induces methemoglobinemia in rats (Harrison and Jollow 1987). Formation of p-methylphenylhydroxylamine (Figure 1) may be inferred from the presence of p-(N-acetylhydroxyamino) hippuric acid in urine of DMPT-treated rats (Kim et al. 2007). It could be speculated that DMPT-N-oxide, also detected in urine of rats, contributes to methemoglobinemia. Dimethylaniline N-oxide has been shown to autocatalyze oxidization of hemoglobin (Kiese 1967). Further, methemoglobinemia has been attributed to formation of an N-oxide metabolite in humans ingesting toxic doses of the drug, zopiclone (Fung et al. 2008).
In mice, the hematologic toxicity was less severe than in rats, and while methemoglobin and Heinz body formation occurred, consistent decreases in the circulating erythroid mass or erythron change were not evident. The lower methemoglobin levels in mice may be due in part to a higher methemoglobin reductase activity than in rats (Car et al. 2006; Stolk and Smith 1966) or may occur as the result of quantitative differences in DMPT metabolism between the two species. Mice receiving DMPT by gavage excreted less p-(N-acetylhydroxyamino)hippuric acid in urine (as percentage total dose) than rats, indicating less potential formation of p-methylphenylhydroxylamine (unpublished NTP findings).
Methemoglobin formation by oxidation of the heme moiety (Pallais, Mackool, and Pitman 2011) may be a sentinel response for DMPT oxidative damage that eventually resulted in carcinogenic responses in liver, thyroid, lung, or forestomach. The occurrence of DMPT-induced malignant liver neoplasms in rats and mice provided clear evidence for DMPT carcinogenic activity. In rats, this included increases in hepatocellular carcinoma and hepatocellular adenoma or carcinoma (combined). In mice, this included increases in hepatocellular adenoma (increases in multiple hepatocellular adenoma in males and increases in multiple and total incidences of hepatocellular adenoma in females); increases in multiple and the total incidences of hepatocellular carcinoma in males and females; increases in hepatoblastoma in males and females; and increases in hepatocellular adenoma, hepatocellular carcinoma, or hepatoblastoma (combined) in males and females.
Hepatocellular adenoma, hepatocellular carcinoma, and hepatoblastoma represent a biological and morphological continuum (Takahashi et al. 2002). Hepatoblastomas are uncommon spontaneous neoplasms that may occur after chemical administration (primarily in mice) and have previously been seen in NTP rodent studies of benzofuran, ethylene thiourea, o-nitroanisole, coumarin, methylphenidate hydrochloride, 1-amino-2,4-dibromoanthraquinone, oxazepam, pyridine, primidone, and goldenseal. Theymay arise from hepatocellular adenomas or carcinomas, and when this occurs, only the hepatoblastoma is recorded. Hepatoblastomas in humans account for approximately 70% of childhood liver cancers (Darbari et al. 2003).
In a human submandibular gland adenocarcinoma cell line with visible light irradiation, the photosensitizer camphorquinone in the presence of DMPT demonstrated both dose- and time-dependent DMPT induction of reactive oxygen species (Atsumi et al. 2001). This ability of DMPT to form free radicals with subsequent DNA damage may explain the DMPT carcinogenic mechanism (Li et al. 2008; Masuki et al. 2007; Pereira, Telo, and Nunes 2008; Winter, Pagoria, and Geurtsen 2005). DMPT has been reported to have estrogen antagonist activity in vitro (yeast reporter gene assay; Nomura et al. 2003), but whether this activity contributes to DMPT carcinogenic activity is not known.
The DMPT-induced nasal and pulmonary toxic lesions are not typical of gavage-associated injury or aspiration. The DMPT respiratory epithelial degeneration/necrosis may be due to cytotoxicity as a result of pulmonary/nasal epithelial cytochrome P450 metabolic activation resulting in production of toxic DMPT metabolites. Metabolic activation of specific P450 enzymes such as CYP2EI and CYP2A5 are reported to result in olfactory epithelial damage secondary to orally administered acetaminophen to mice (Genter et al. 1998).
DMPT belongs to the N-dialkylaminoaromatic class of compounds, with an aromatic amine structural alert. Carcinogenic arylamines undergo metabolic activation via N-hydroxylation followed by O-esterification (Marques et al. 1997). Members of the alkylaniline class of compounds, including p-toluidine (4-methylaniline), may form DNA adducts via this mechanism. It is possible that p-methylphenylhydroxyamine (Figure 1) is formed from DMPT leading to DNA adduct formation, especially at high doses. Additionally, the p-alkylaniline structural alert for DMPT indicates potential formation of a reactive imine methide (Stepan et al. 2011; Figure 1). Electrophilic imine methides, functioning as nitrogen/carbon-centered free radicals, are capable of damaging DNA or proteins (Grillo et al. 2008; Nocerini et al. 1985). An imine methide is thought to be involved in pulmonary toxicity of 3-methylindole and hepatotoxicity of diclofenac (Grillo et al. 2008; Nocerini et al. 1985). Further, Deng et al. (2011) correlated covalent binding to plasma proteins in humans with an imine methide metabolite of the drug, Eltrombopag.
DMPT toxicity correlated with the level of DMPT deposition in DMPT target organs. Dix, Ghanbari, and Hedtke-Weber (2007) reported that the highest concentrations of 14C-DMPT occurred in liver and kidney of rats following oral DMPT exposure. Similar DMPT exposures in mice resulted in high DMPT levels in the liver and lung (National Toxicology Program 2012). The DMPT toxicity observed in these rodent studies is consistent with findings in humans where oral DMPT exposure caused acute cyanosis due to methemoglobinemia formation (Potter et al. 1988).
Acknowledgments
We thank Dr. M. Cesta and Dr. C. Rider, NIEHS, for their review of the article.
Funding: The author(s) disclosed receipt of the following financial support for the research, authorship, and/or publication of this article: This work was supported by the intramural program of the National Institute of Environmental Health Sciences (NIEHS), Research Triangle Park, NC.
Abbreviations
- ALT
alanine aminotransferase
- DMPT
N,N-dimethyl-p-toluidine
- H&E
hematoxylin and eosin
- NTP
National Toxicology Program
- SDH
sorbitol dehydrogenase
Footnotes
Declaration of Conflicting Interests: The author(s) declared no potential conflicts of interest with respect to the research, authorship, and/or publication of this article.
The statements, opinions, or conclusions contained in this article do not necessarily represent the statements, opinions, or conclusions of NIEHS, NIH, or the U.S. government. The in-life portion of this study was conducted under the supervision of Dr. C. Herbert, Southern Research Institute, under NIEHS contract NO1-ES-45516 and the microarray analysis under contract N01-ES-55536. Statistical support was provided under NIEHS contract ES 55547.
References
- Atsumi T, Iwakura I, Fujisawa S, Ueha T. The production of reactive oxygen species by irradiated camphorquinone-related photosensitizers and their effect on cytotoxicity. Arch Oral Biol. 2001;46:391–401. doi: 10.1016/s0003-9969(01)00005-x. [DOI] [PubMed] [Google Scholar]
- Bailer AJ, Portier CJ. Effects of treatment-induced mortality and tumor-induced mortality on tests for carcinogenicity in small samples. Biometrics. 1988;44:417–31. [PubMed] [Google Scholar]
- Boorman GA, Eustis SL. The pathology working roup as a means for assuring pathology quality in toxicologic studies. In: Whitmire C, Davis CL, Bristol DW, editors. Managing Conduct and Data Quality of Toxicologic Studies. Princeton Scientific Publishing; Princeton, NJ: 1986. pp. 271–75. [Google Scholar]
- Brecher G, Schneiderman M. A time-saving device for the counting of reticulocytes. Am J Clin Pathol. 1950;20:1079–1083. doi: 10.1093/ajcp/20.11_ts.1079. [DOI] [PubMed] [Google Scholar]
- Car BD, Eng VM, Everds NE, Bounous DI. Clinical pathology of the rat. In: Suckow MA, Weisbrouth SH, Franklin CL, editors. The Laboratory Rat. Elsevier; Burlington, MA: 2006. pp. 128–46. [Google Scholar]
- Challoner DR, Vodra WW. Medical devices and health—Creating a new regulatory framework for moderate-risk devices. N Engl J Med. 2011;365:977–79. doi: 10.1056/NEJMp1109150. [DOI] [PubMed] [Google Scholar]
- Darbari A, Sabin KM, Shapiro CN, Schwarz KB. Epidemiology of primary hepatic malignancies in U.S. children. Hepatology. 2003;38:560–66. doi: 10.1053/jhep.2003.50375. [DOI] [PubMed] [Google Scholar]
- Deng Y, Madatian A, Wire MB, Bowen C, Park JW, Williams D, Peng B, Schubert E, Gorycki F, Levy M, Gorycki PD. Metabolism and disposition of eltrombopag, an oral, nonpeptide thrombopoietin receptor agonist, in healthy human subjects. Drug Metab Dispos. 2011;39:1734–46. doi: 10.1124/dmd.111.040170. [DOI] [PubMed] [Google Scholar]
- Dillingham EO, Webb N, Lawrence WH, Autian J. Biological evaluation of polymers. I. Poly(methyl methacylate) J Biomed Mater Res. 1975;9:569–96. doi: 10.1002/jbm.820090605. [DOI] [PubMed] [Google Scholar]
- Dix KJ, Ghanbari K, Hedtke-Weber BM. Disposition of [14C]N,N-dimethyl-p-toluidine in F344 rats and B6C3F1 mice. J Toxicol Environ Health A. 2007;70:789–98. doi: 10.1080/15287390701206291. [DOI] [PubMed] [Google Scholar]
- Dunn OJ. Multiple comparisons using rank sums. Technometrics. 1964;6:241–52. [Google Scholar]
- Dunnett CW. A multiple comparison procedure for compaing several treatments with a control. J Am Stat Assoc. 1955;50:1096–121. [Google Scholar]
- Dunnick JK, Elwell MR, Bucher JR. Comparative toxicities of o-, m-, and p-nitrotoluene in 13-week feed studies in F344 rats and B6C3F1 mice. Fundam Appl Toxicol. 1994;22:411–21. doi: 10.1006/faat.1994.1047. [DOI] [PubMed] [Google Scholar]
- Evelyn KA, Malloy HT. Microdetermination of oxyhemoglobin, methemoglobin and sulfhemoglobin in a single sample of blood. J Biol Chem. 1938;126:655–662. [Google Scholar]
- Finch CA. Methemoglobinemia and sulfhemoglobinemia. N Engl J Med. 1948;239:470–78. doi: 10.1056/NEJM194809232391305. [DOI] [PubMed] [Google Scholar]
- Fung HT, Lai CH, Wong OF, Lam KK, Kam CW. Two cases of methemoglobinemia following zopiclone ingestion. Clin Toxicol (Phila) 2008;46:167–70. doi: 10.1080/15563650701305558. [DOI] [PubMed] [Google Scholar]
- Galus Z, Adams RN. Anodic oxidation of N-Methylaniline and N,N-Dimethyl-P-Toluidine. J Phys Chem. 1963;67:866–69. [Google Scholar]
- Genter MB, Liang HC, Gu J, Ding X, Negishi M, McKinnon RA, Nebert DW. Role of CYP2A5 and 2G1 in acetaminophen metabolism and toxicity in the olfactory mucosa of the Cyp1a2(−/−) mouse. Biochem Pharmacol. 1998;55:1819–26. doi: 10.1016/s0006-2952(98)00004-5. [DOI] [PubMed] [Google Scholar]
- Grillo MP, Ma J, Teffera Y, Waldon DJ. A novel bioactivation pathway for 2-[2-(2,6-dichlorophenyl)aminophenyl]ethanoic acid (diclofenac) initiated by cytochrome P450-mediated oxidative decarboxylation. Drug Metab Dispos. 2008;36:1740–44. doi: 10.1124/dmd.108.021287. [DOI] [PubMed] [Google Scholar]
- Hardisty JG, Boorman GA. National Toxicology Program pathology quality assurrance procedures. In: Whitmire C, Davis CL, Bristol DW, editors. Managing Conduct and Data Quality of Toxicologic Studies. Princeton Publishing Company; Princeton, NJ: 1986. pp. 263–69. [Google Scholar]
- Harrison JH, Jr, Jollow DJ. Contribution of aniline metabolites to aniline-induced methemoglobinemia. Mol Pharmacol. 1987;32:423–31. [PubMed] [Google Scholar]
- Institute of Medicine of the National Academies. Medical Devices and the Public’s Health The FDA 510(k) clearance process at 35 years. The National Academies Press; Washington, DC: 2011. [Google Scholar]
- Kao L, Leikin JB, Crockett M, Burda A. Methemoglobinemia from artificial fingernail solution. JAMA. 1997;278:549–50. [PubMed] [Google Scholar]
- Kiese M. Reactions of N,N-dimethylaniline-N-oxide with hemoglobin. Mol Pharmacol. 1967;3:9–14. [PubMed] [Google Scholar]
- Kim NC, Ghanbari K, Kracko DA, Weber WM, McDonald JD, Dix KJ. Identification of urinary metabolites of orally administered N,N-dimethyl-p-toluidine in male F344 rats. J Toxicol Environ Health A. 2007;70:781–88. doi: 10.1080/15287390701206176. [DOI] [PubMed] [Google Scholar]
- Kramer DB, Xu S, Kesselheim AS. Regulation of medical devices in the United States and European Union. N Engl J Med. 2012;366:848–55. doi: 10.1056/NEJMhle1113918. [DOI] [PubMed] [Google Scholar]
- Li YC, Huang FM, Lee SS, Lin RH, Chou MY, Chang YC. Protective effects of antioxidants on micronuclei induced by irradiated 9-fluorenone/N,N-dimethyl-p-toluidine in CHO cells. J Biomed Mater Res B Appl Biomater. 2008;84:58–63. doi: 10.1002/jbm.b.30843. [DOI] [PubMed] [Google Scholar]
- Linder L. Tissue reaction to methyl methacrylate monomer. A comparative study in the rabbit’s ear on the toxicity of methyl methacrylate monomer of varying composition. Acta Orthop Scand. 1976;47:3–10. doi: 10.3109/17453677608998965. [DOI] [PubMed] [Google Scholar]
- Marques MM, Mourato LL, Amorim MT, Santos MA, Melchior WB, Jr, Beland FA. Effect of substitution site upon the oxidation potentials of alkylanilines, the mutagenicities of N-hydroxyalkylanilines, and the conformations of alkylaniline-DNA adducts. Chem Res Toxicol. 1997;10:1266–74. doi: 10.1021/tx970104w. [DOI] [PubMed] [Google Scholar]
- Masuki K, Nomura Y, Bhawal UK, Sawajiri M, Hirata I, Nahara Y, Okazaki M. Apoptotic and necrotic influence of dental resin polymerization initiators in human gingival fibroblast cultures. Dent Mater J. 2007;26:861–69. doi: 10.4012/dmj.26.861. [DOI] [PubMed] [Google Scholar]
- National Toxicology Program. Technical Report on the Toxicology and Cardinogenesis studies of N,N-Dimethyl-p-toluidine. NTP TR. 2012;(579):1–21. [PubMed] [Google Scholar]
- Nocerini MR, Yost GS, Carlson JR, Liberato DJ, Breeze RG. Structure of the glutathione adduct of activated 3-methylindole indicates that an imine methide is the electrophilic intermediate. Drug Metab Dispos. 1985;13:690–94. [PubMed] [Google Scholar]
- Nomura Y, Ishibashi H, Miyahara M, Shinohara R, Shiraishi F, Arizono K. Effects of dental resin metabolites on estrogenic activity in vitro. J Mater Sci Mater Med. 2003;14:307–10. doi: 10.1023/a:1022923713892. [DOI] [PubMed] [Google Scholar]
- Pallais JC, Mackool BT, Pitman MB. Case records of the Massachusetts General Hospital: Case 7-2011: A 52-year-old man with upper respiratory symptoms and low oxygen saturation levels. N Engl J Med. 2011;364:957–66. doi: 10.1056/NEJMcpc1013923. [DOI] [PubMed] [Google Scholar]
- Pereira SG, Telo JP, Nunes TG. Towards a controlled photopolymerization of dental dimethacrylate monomers: EPR studies on effects of dilution, filler loading, storage and aging. J Mater Sci Mater Med. 2008;19:3135–44. doi: 10.1007/s10856-008-3434-1. [DOI] [PubMed] [Google Scholar]
- Piegorsch WW, Bailer AJ. In: Statistics for environmental biology and toxicology. Hall CA, editor. Chapman and Hall; London, UK: 1997. Section 6.3.2. [Google Scholar]
- Portier CJ, Bailer AJ. Testing for increased carcinogenicity using a survival-adjusted quantal response test. Fundam Appl Toxicol. 1989;12:731–37. doi: 10.1016/0272-0590(89)90004-3. [DOI] [PubMed] [Google Scholar]
- Potter JL, Krill CE, Jr, Neal D, Kofron WG. Methemoglobinemia due to ingestion of N,N-dimethyl-p-toluidine, a component used in the fabrication of artificial fingernails. Ann Emerg Med. 1988;17:1098–100. doi: 10.1016/s0196-0644(88)80455-4. [DOI] [PubMed] [Google Scholar]
- Shintani H, Tsuchiya T, Hata Y, Nakamura A. Solid phase extraction and HPLC analysis of toxic components eluted from methyl methacrylate dental materials. J Anal Toxicol. 1993;17:73–78. doi: 10.1093/jat/17.2.73. [DOI] [PubMed] [Google Scholar]
- Smith RP. Toxic response of the blood. In: Amdur JDNO, Klaassen CD, editors. Casarett and Doull’s Toxicology: The Basic Science of Poisons. McGraw-Hill; New York, NY: 1996. pp. 335–54. [Google Scholar]
- Stea S, Granchi D, Zolezzi C, Ciapetti G, Visentin M, Cavedagna D, Pizzoferrato A. High-performance liquid chromatography assay of N,N-dimethyl-p-toluidine released from bone cements: Evidence for toxicity. Biomaterials. 1997;18:243–46. doi: 10.1016/s0142-9612(96)00121-4. [DOI] [PubMed] [Google Scholar]
- Stepan AF, Walker DP, Bauman J, Price DA, Baillie TA, Kalgutkar AS, Aleo MD. Structural alert/reactive metabolite concept as applied in medicinal chemistry to mitigate the risk of idiosyncratic drug toxicity: A perspective based on the critical examination of trends in the top 200 drugs marketed in the United States. Chem Res Toxicol. 2011;24:1345–410. doi: 10.1021/tx200168d. [DOI] [PubMed] [Google Scholar]
- Stolk JM, Smith RP. Species differences in methemoglobin reductase activity. Biochem Pharmacol. 1966;15:343–51. doi: 10.1016/0006-2952(66)90305-4. [DOI] [PubMed] [Google Scholar]
- Takahashi M, Dinse GE, Foley JF, Hardisty JF, Maronpot RR. Comparative prevalence, multiplicity, and progression of spontaneous and vinyl carbamate-induced liver lesions in five strains of male mice. Toxicol Pathol. 2002;30:599–605. doi: 10.1080/01926230290105776. [DOI] [PubMed] [Google Scholar]
- Tosti A, Bardazzi F, Piancastelli E, Brasile GP. Contact stomatitis due to N,N-dimethyl-para-toluidine. Contact Dermatitis. 1990;22:113. doi: 10.1111/j.1600-0536.1990.tb01533.x. [DOI] [PubMed] [Google Scholar]
- U.S. Environmental Protection Program. High production volume challenge program. 2011 http://www.epa.gov/HPV/; http://iaspub.epa.gov/oppthpv/quicksearch-display?pCheme=100729; http://www.epa.gov/hpv/pubs/sumresp.htm.
- U.S. Patent and Trademark Office. U S patent and trademark office Patent Database. 2012 http://www.uspto.gov/patents/process/search/index.jsp.
- Vazquez B, Levenfeld B, Roman JS. Roie of amine activators on the curing parameters, properties and toxicity of acrylic bone cements. Polymer International. 1998;46:241–50. [Google Scholar]
- Verschueren GL, Bruynzeel DP. Allergy to N,N-dimethyl-ptoluidine in dental materials. Contact Dermatitis. 1991;24:149. doi: 10.1111/j.1600-0536.1991.tb01680.x. [DOI] [PubMed] [Google Scholar]
- Williams DA. Test for differences between treatment means when several dose levels are compared with a zero dose control. Biometrics. 1971;27:103–17. [PubMed] [Google Scholar]
- Williams DA. The comparison of several dose levels with a zero dose control. Biometrics. 1972;28:519–31. [PubMed] [Google Scholar]
- Winter K, Pagoria D, Geurtsen W. The effect of antioxidants on oxidative DNA damage induced by visible-light-irradiated camphorquinone/N,N-dimethyl-p-toluidine. Biomaterials. 2005;26:5321–29. doi: 10.1016/j.biomaterials.2005.01.068. [DOI] [PubMed] [Google Scholar]


