Abstract
Objective
To compare PET imaging of tau pathology with CSF measurements (total tau [t-tau] and phosphorylated tau [p-tau]) in terms of diagnostic performance for Alzheimer disease (AD).
Methods
We compared t-tau and p-tau and 18F-AV-1451 in 30 controls, 14 patients with prodromal AD, and 39 patients with Alzheimer dementia, recruited from the Swedish BioFINDER study. All patients with AD (prodromal and dementia) were screened for amyloid positivity using CSF β-amyloid 42. Retention of 18F-AV-1451 was measured in a priori specified regions, selected for known associations with tau pathology in AD.
Results
Retention of 18F-AV-1451 was markedly elevated in Alzheimer dementia and moderately elevated in prodromal AD. CSF t-tau and p-tau was increased to similar levels in both AD dementia and prodromal AD. 18F-AV-1451 had very good diagnostic performance for Alzheimer dementia (area under the receiver operating characteristic curve [AUROC] ∼1.000), and was significantly better than t-tau (0.876), p-tau (0.890), hippocampal volume (0.824), and temporal cortical thickness (0.860). For prodromal AD, there were no significant AUROC differences between CSF tau and 18F-AV-1451 measures (0.836–0.939), but MRI measures had lower AUROCs (0.652–0.769).
Conclusions
CSF tau and 18F-AV-1451 have equal performance in early clinical stages of AD, but 18F-AV-1451 is superior in the dementia stage, and exhibits close to perfect diagnostic performance for mild to moderate AD.
Classification of evidence
This study provides Class III evidence that CSF tau and 18F-AV-1451 PET have similar performance in identifying early AD, and that 18F-AV-1451 PET is superior to CSF tau in identifying mild to moderate AD.
Alzheimer disease (AD) is characterized by the aggregation of β-amyloid (Aβ) in extracellular plaques and phosphorylated tau (p-tau) in intracellular neurofibrillary aggregates. Tau can be measured in CSF as total tau (t-tau), which is increased in AD and in several other neurologic diseases, or as p-tau, which is more specifically increased in AD.1 PET tracers have made it possible to visualize and quantify tau deposits in vivo. One of these tracers, 18F-AV-1451 (formerly called 18F-T8072,3), binds to tau aggregates in AD4 and differentiates AD from controls.5–9 Preliminary evidence indicates that CSF tau and PET tau measures correlate,6,10 but those results stem from populations mainly consisting of controls, including few cases with AD dementia. A key unresolved question is therefore if CSF and PET tau measures have similar or different diagnostic performance for AD. It is also not clear if CSF and PET tau measures are significantly better than MRI measures of brain structure to identify AD. To address these questions, we compared CSF t-tau and p-tau, 18F-AV-1451 PET, hippocampal volume, and cortical thickness in AD-associated regions11 for diagnosis of AD at the dementia and prodromal stages of the disease. All patients with prodromal AD and AD dementia were screened for amyloid positivity using CSF Aβ42.
Methods
Participants
The study population stemmed from 3 cohorts from the prospective and longitudinal Swedish BioFINDER study (biofinder.se). In the present study, we included 30 cognitively normal control participants. They were eligible for inclusion if they (1) were aged ≥60 years old, (2) scored 28–30 points on the Mini-Mental State Examination (MMSE) at the screening visit, (3) did not fulfill the criteria of mild cognitive impairment (MCI) or any dementia, and (4) were fluent in Swedish. The exclusion criteria were (1) presence of significant neurologic or psychiatric disease (e.g., stroke, Parkinson disease, multiple sclerosis, major depression), (2) significant systemic illness making it difficult to participate, (3) refusing lumbar puncture, or (4) substantial alcohol abuse. In the second cohort, 14 patients with MCI due to AD (prodromal AD) were enrolled at the Memory Clinic of the Skåne University Hospital, Sweden. These participants were eligible for inclusion if they (1) were referred to the memory clinics because of cognitive impairment, (2) did not fulfil the criteria for dementia, (3) scored 24–30 points on the MMSE, (4) had objective memory impairment according to delayed word list recall, (5) were aged 60–80 years, (6) had low CSF Aβ42 levels,12 and (7) were fluent in Swedish. The exclusion criteria were (1) cognitive impairment explained by another condition (other than prodromal dementia), (2) a substantial systemic illness making it difficult to participate, (3) refusing lumbar puncture, or (4) substantial alcohol abuse. In the last cohort, we included 39 patients with AD dementia at baseline, who were recruited at the Memory Clinic, Skåne University Hospital. All patients with dementia met the DSM-III-R criteria for dementia13 as well as the National Institute of Neurological and Communicative Disorders and Stroke–Alzheimer’s Disease and Related Disorders Association criteria for AD14 and had low CSF Aβ42 levels. The exclusion criteria were (1) substantial systemic illness making it difficult to participate or (2) substantial alcohol abuse. The diagnosis of prodromal AD and AD dementia were established by physicians specialized in dementia disorders, who were blinded to the 18F-AV-1451 PET, CSF t-tau, and CSF p-tau data.
Cognitive measures
We used the MMSE as a measure of general cognition and the delayed recall memory test from the Alzheimer’s Disease Assessment Scale–cognitive subscale (list learning, 10 items) as a measure of memory.15
CSF biomarkers
CSF samples were derived from lumbar puncture. Samples were analyzed at the Clinical Neurochemistry Laboratory in Mölndal, Sweden, for t-tau, p-tau, and Aβ42 using commercially available ELISAs (INNOTEST; Fujiribio, Ghent, Belgium). All CSF samples were analyzed using clinical practice procedures, with analyses performed by board-certified technicians blinded to clinical data, following detailed procedures to assure analytical precision and long-term stability of the biomarkers, including batch bridging between old and new batches of ELISA plates, general laboratory procedures (e.g., calibration of pipettes and preventive service of instruments), and strict criteria for approval of calibration curves and internal quality control (QC) samples, following the Westgard multi rules, as described previously in detail.16 The approval limits for the 2 internal QC CSF samples run at 2 positions on each plate was 12.0% for Aβ42, 9.3% for t-tau, and 9.8% for p-tau for the normal QC sample, and 11.0% for Aβ42, 10.0% for t-tau, and 9.8% for p-tau for the AD-like QC sample. For CSF Aβ42, we used a cutoff of <650 ng/L to identify Aβ-positive participants, based on our previous comparisons between CSF Aβ42 and Aβ PET imaging.16 All patients with prodromal AD and patients with AD dementia were screened for Aβ positivity before 18F-AV-1451 PET scanning. The control population was enriched for Aβ pathology, by inclusion of 15 Aβ-positive and 15 Aβ-negative participants before 18F-AV-1451 PET scanning.
MRI and processing
T1-weighted imaging was performed on a 3T magnetic resonance scanner (Siemens Tim Trio 3T; Siemens Medical Solutions, Erlangen, Germany), producing a high-resolution anatomic magnetization-prepared rapid gradient echo image (repetition time 1,950 ms, echo time 3.4 ms, 1 mm isotropic voxels, and 178 slices) for further use in volumetric analysis, template normalization, and coregistrations. The anatomic scan was normalized to Montreal Neurological Institute 152 space17 with a diffeomorphic transform and the Advanced Normalization Tools (ANT) toolbox18 for further use in the PET processing pipeline (see below; ANT was used for all coregistrations). Cortical reconstruction and volumetric segmentation were performed with the Freesurfer image analysis pipeline v5.3 (surfer.nmr.mgh.harvard.edu/). We used the average cortical thickness in temporal lobe regions (including the FreeSurfer regions of interest [ROIs] entorhinal, fusiform, inferior temporal, and middle temporal cortex, based on reference 11), and hippocampal volume (averaged between right and left hemisphere).
Tau PET imaging and processing
18F-AV-1451 was synthesized at Skåne University Hospital, Lund, as described previously.19 PET scans were performed on a GE Discovery 690 PET scanner (General Electric Medical Systems, Bensalem, PA) as dynamic scans using LIST-mode 80–120 minutes after a bolus injection of 370 MBq of 18F-AV-1451. Low-dose CT scans for attenuation correction were performed in the same patient position immediately prior to the PET scans. PET data were reconstructed into 5-minute frames using an iterative Vue Point HD algorithm with 6 subsets, 18 iterations with 3-mm filter, and no time-of-flight correction. The dynamic scans were motion corrected using AFNI's 3dvolreg,20 time-averaged and rigidly coregistered to the skull-stripped MRI scan. Partial volume error correction was performed using the geometric transfer method as described in reference 21 using the FreeSurfer parcellations, smoothed with 5-mm full width at half maximum to calculate transfers across ROI borders. The FreeSurfer parcellation in the magnetic resonance space of the anatomic scan was then applied to the processed, coregistered, and time-averaged PET image to extract regional uptake values. We created 18F-AV-1451 standardized uptake value (SUV) images based on mean uptake over 80–120 minutes postinjection normalized to uptake in a gray matter–masked cerebellum reference region to create voxelwise SUV ratio (SUVR) images in each participant's MRI native space.19
Regional PET analyses
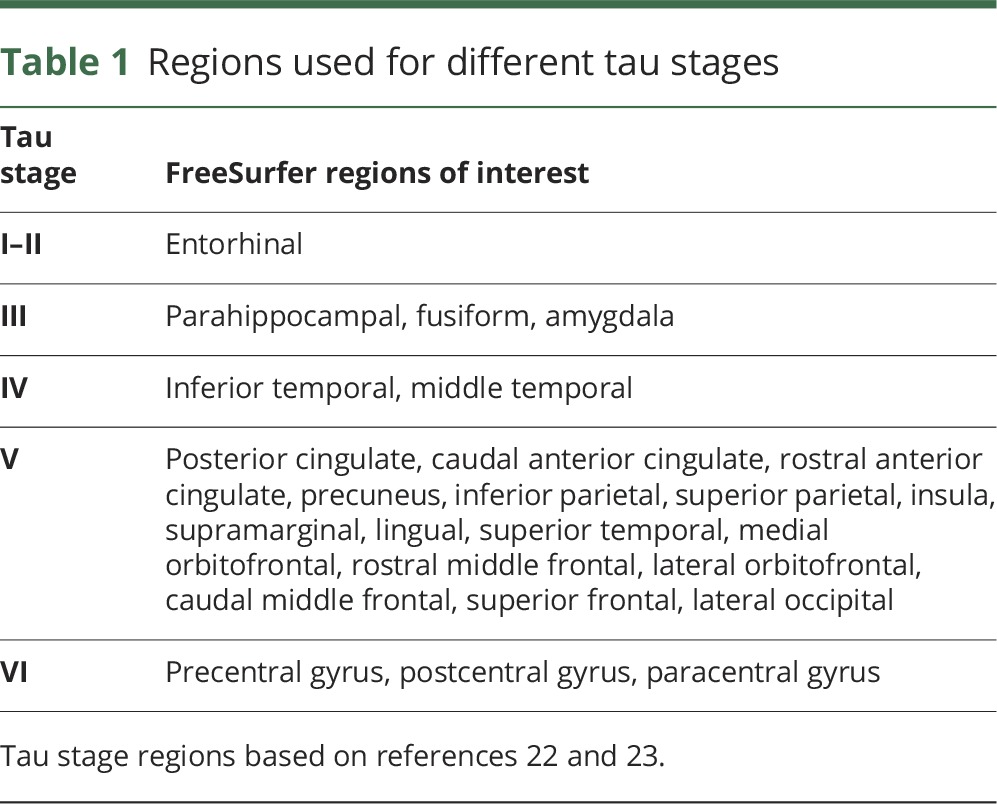
We performed 18F-AV-1451 PET analyses with a priori defined ROI, as proposed by Cho et al.22 and Jack et al.23 Cho et al.22 described a protocol to aggregate FreeSurfer ROIs in different tau stages, which was overall similar to the staging system suggested by Braak and Braak.24 We used this protocol to define a set of nonoverlapping ROIs corresponding to tau stages I–II, III, IV, V, and VI (table 1). To obtain an overall 18F-AV-1451 PET tau measure, we merged the signal from tau stages I–V. As an alternative overall tau measure, we merged the signal from tau stages regions I–IV, which corresponds to an aggregation protocol suggested by Jack et al.23 For merged regions, the signal was calculated as the sum of the volume-adjusted regional 18F-AV-1451 PET signals.
Table 1.
Regions used for different tau stages
Statistical analyses
Biomarker levels were compared between diagnostic groups by linear regression, adjusted for age. Sex was also explored as a covariate, but was left out since it was nonsignificant and did not affect the results.
Diagnostic performance of biomarkers was quantified by area under the ROC (AUROC) analysis. AUROCs were compared between biomarkers using a bootstrap method with 2,000 iterations. For all tau biomarkers, we determined cutoffs by the Youden index (J, which maximizes the combination of sensitivity and specificity). We calculated sensitivities, specificities, and overall accuracies (proportion of correctly classified participants) at these cutoffs.
All statistical tests were 2-sided. Significance was determined at p < 0.05. All statistics were done using R (v. 3.2.3, The R Foundation for Statistical Computing). The pROC package (v.1.8) was used for AUROC analyses.
Primary research questions
Do the diagnostic performances differ between CSF tau measures and 18F-AV-1451 PET for early AD (prodromal disease stage) and for AD dementia (mild to moderate disease stage)? This study provides Class III evidence that CSF tau measures and 18F-AV-1451 PET have similar performance for identifying early (prodromal) AD, and that 18F-AV-1451 PET is superior to CSF tau measures in identifying mild to moderate AD.
Standard protocol approvals, registrations, and patient consents
All participants gave written informed consent to participate in the study. Ethical approval was given by the Ethical Committee of Lund University, Sweden, and all the methods were carried out in accordance with the approved guidelines. 18F-AV-1451 PET imaging approval was obtained from the Swedish Medicines and Products Agency and the local Radiation Safety Committee at Skåne University Hospital, Sweden.
Results
18F-AV-1451, CSF tau, and MRI biomarkers by diagnosis
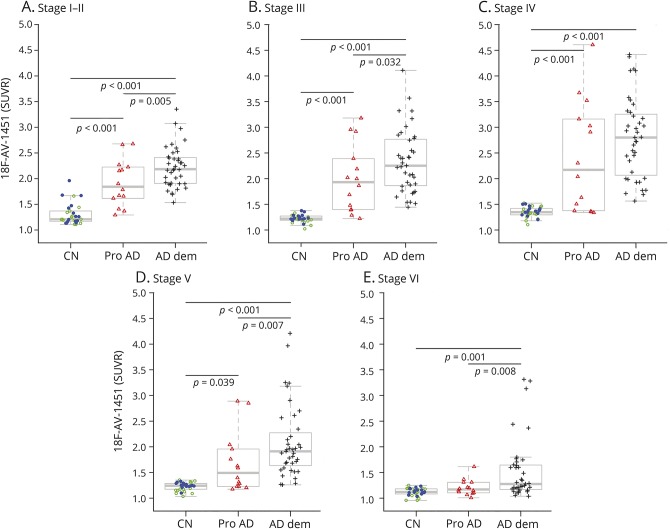
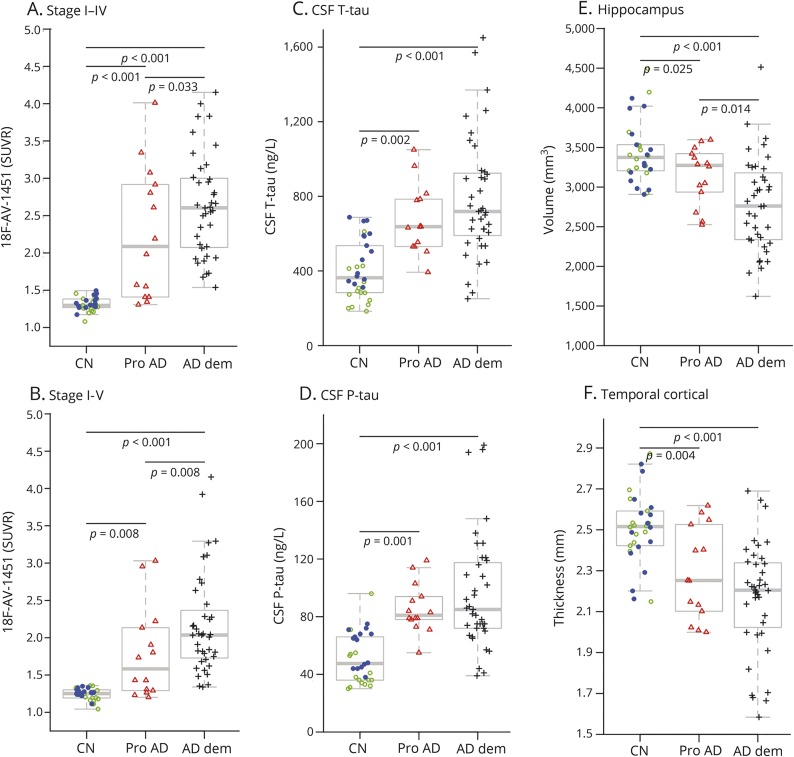
Demographics are presented in table 2. Compared to controls, the 18F-AV-1451 retention was elevated in AD dementia in all tau stages, and in prodromal AD in tau stage I–V regions (figure 1). The 18F-AV-1451 retention was also elevated in AD dementia compared to prodromal AD in all tau stages except stage IV. The differences between the diagnostic groups in 18F-AV-1451 were similar for the merged stage I–IV and I–V regions (figure 2, A and B). Patients with AD dementia and prodromal AD had higher CSF t-tau and p-tau than controls, but there were no differences between patients with AD dementia and patients with prodromal AD in CSF tau measures (figure 2, C and D). Patients with AD dementia and prodromal AD had smaller hippocampi and thinner cortical thickness of the temporal lobe than controls, and patients with AD dementia had smaller hippocampi than patients with prodromal AD (figure 2, E and F).
Table 2.
Study demographics
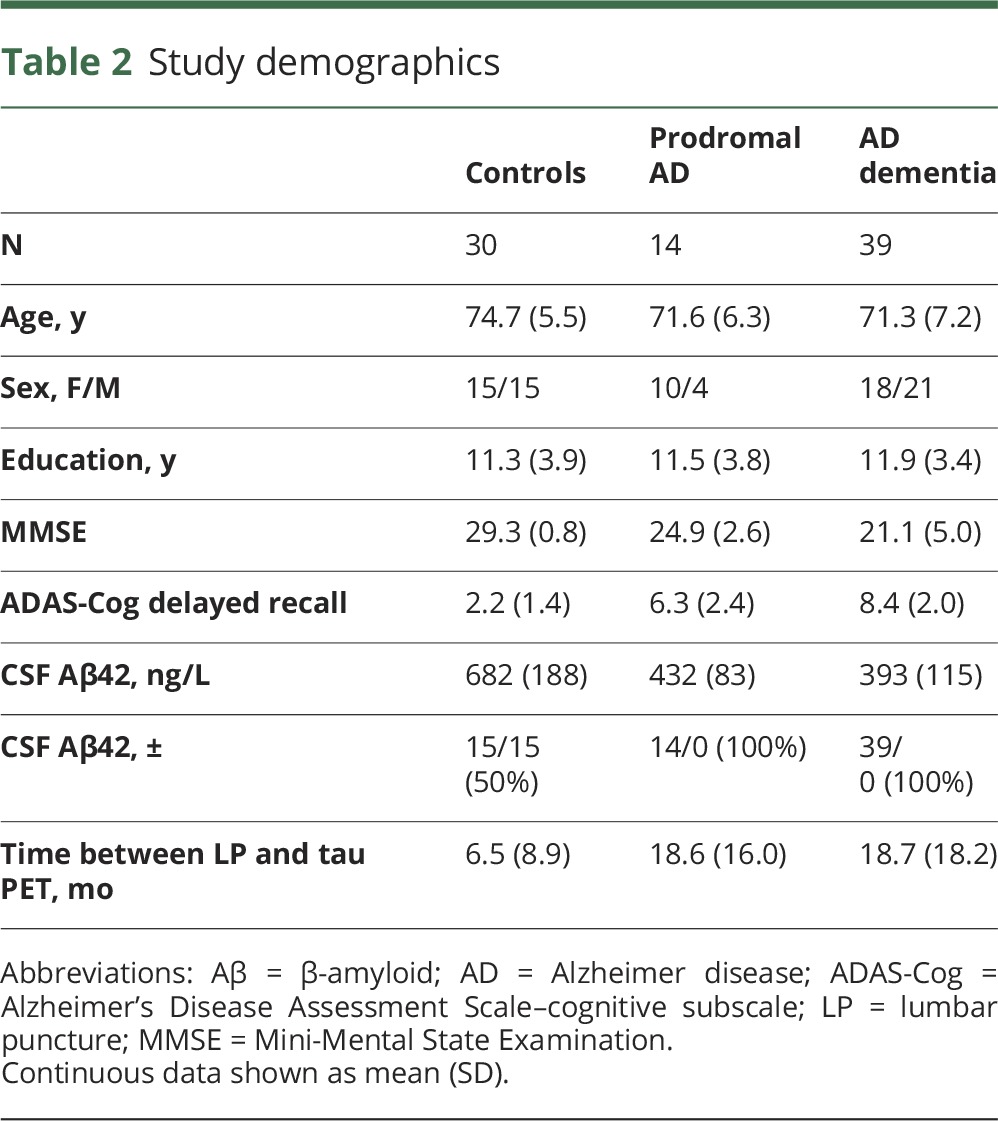
Figure 1. 18F-AV-1451 by clinical diagnosis.
(A–E) 18F-AV-1451 signal in different tau stage regions. Diagnostic groups (controls [CN], prodromal Alzheimer disease [Pro AD], and Alzheimer disease dementia [AD dem]) were compared by linear regression, adjusted for age. The controls are coded by amyloid status (amyloid-negative, green open circles; amyloid-positive, blue dots). SUVR = standardized uptake value ratio.
Figure 2. 18F-AV-1451, CSF tau biomarkers, and brain structure.
(A, B) 18F-AV-1451 signal in tau stage regions I–IV and tau stage I–V. (C, D) CSF total tau (t-tau) and phosphorylated tau (p-tau). (E, F) Hippocampal volume and cortical thickness in temporal lobe regions. Diagnostic groups (controls [CN], prodromal Alzheimer disease [Pro AD], and Alzheimer disease dementia [AD dem]) were compared by linear regression, adjusted for age. The controls are coded by amyloid status (amyloid-negative, green open circles; amyloid-positive, blue dots).
Diagnostic performances of tau biomarkers
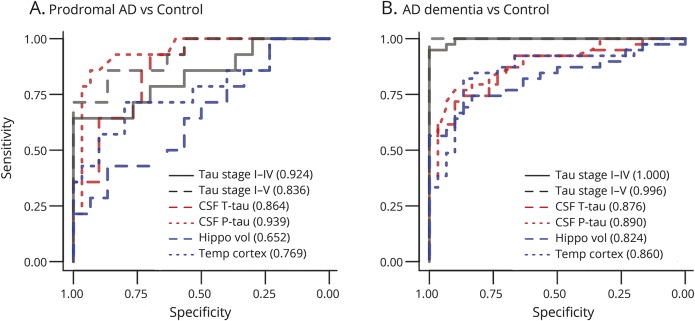
We calculated AUROCs for 18F-AV-1451 in tau stage I–IV and stage I–V, CSF t-tau and p-tau, hippocampal volume, and temporal cortical thickness (figure 3). 18F-AV-1451 had almost perfect separation for AD dementia vs controls. The AUROCs were significantly higher for 18F-AV-1451 measures than for CSF t-tau, p-tau, and MRI measures, but there were no significant differences in AUROCs between CSF T-tau, p-tau, and MRI measures. For patients with prodromal AD vs controls, there were no significant differences in AUROCs between the tau biomarkers, but 18F-AV-1451 in tau stage I–IV, CSF t-tau, and CSF p-tau all had significantly higher AUROCs than hippocampal volume. The PET and CSF tau biomarkers also tended to have higher AUROCs than temporal lobe cortical thickness for prodromal AD, but the differences were not significant. The AUROC results were similar when not performing partial volume correction of the 18F-AV-1451 images, and when adjusting for age and time lag between PET and lumbar puncture (data not shown). We also compared biomarker AUROCS for preclinical AD (Aβ-positive controls, n = 15) vs prodromal AD and AD dementia. The findings were similar to when including all controls (supplementary analysis [links.lww.com/WNL/A93] and figure e-1, [links.lww.com/WNL/A91]).
Figure 3. Area under the receiver operating characteristic curve (AUROC) analyses.
AUROC analyses for the 18F-AV-1451 signal from the tau stage region I–IV, tau stage region I–V, CSF total tau (t-tau) and phosphorylated tau (p-tau), hippocampal volume, and temporal lobe cortical thickness, to differentiate prodromal Alzheimer disease (AD) (A) and AD dementia (B) from controls. AUROCs are shown in the legends. AUROCs for hippocampal volume were adjusted for intracranial volume. For prodromal AD vs controls, tau stage I–IV, CSF t-tau, and CSF p-tau had higher AUROCs than hippocampal volume (p = 0.0055; p = 0.024; p = 0.0065). For AD dementia vs controls, tau stage I–V and tau stage I–IV PET had higher AUROCs than CSF t-tau (p = 0.0033; p = 0.0025), CSF p-tau (p = 0.0040; p = 0.0038), hippocampal volume (p < 0.001; p < 0.001), and temporal lobe cortical thickness (p = 0.0034; p = 0.0038).
We next determined optimal cutoffs for the PET and CSF tau biomarkers using the Youden index. For patients with AD dementia vs controls, these cutoffs were CSF t-tau >624 ng/L (sensitivity 69%, specificity 90%), CSF p-tau >72 ng/L (sensitivity 72%, specificity 93%), 18F-AV-1451 tau stage I–IV >1.54 SUVR (sensitivity 97%, specificity 100%), and 18F-AV-1451 tau stage I–V >1.37 SUVR (sensitivity 92%, specificity 100%). For prodromal AD vs controls, the cutoffs were CSF t-tau >504 ng/L (sensitivity 86%, specificity 70%), CSF p-tau >73 ng/L (sensitivity 79%, specificity 93%), 18F-AV-1451 tau stage I–IV >1.41 SUVR (sensitivity 79%, specificity 87%), and 18F-AV-1451 tau stage I–V >1.43 SUVR (sensitivity 57%, specificity 100%). See table e-1 (links.lww.com/WNL/A92) for a summary of these data.
Discussion
We found that 18F-AV-1451 tau PET imaging was superior to CSF tau biomarkers for diagnosis of mild to moderate AD dementia vs controls, with almost perfect separation between groups. In prodromal AD, when some patients still lacked widespread tau pathology, 18F-AV-1451 PET and CSF tau biomarkers had comparable diagnostic performance.
Studies comparing CSF tau biomarkers with PET tau imaging for diagnosis of AD are rare. Our findings suggest that the relationship between CSF and PET tau biomarkers for diagnosis differs by disease stage in AD. This supports a model where CSF tau biomarkers are primarily useful as disease state biomarker, i.e., they indicate presence or absence of AD, but they may be less useful as stage biomarkers during the transition from prodromal AD to dementia. In contrast, 18F-AV-1451 imaging may be useful both as a state and a stage biomarker, since increased 18F-AV-1451 is associated with AD already at the prodromal stage, and provides increased separation towards controls in the dementia stage of the disease. We also included MRI measures of brain structure (hippocampal volume and temporal lobe cortical thickness), which had lower AUROC than 18F-AV-1451 for AD dementia. For prodromal AD, hippocampal volume had significantly lower AUROC than PET and CSF tau measures, and there was also a tendency for lower AUROC for temporal lobe cortical thickness compared to the tau measures.
At the dementia stage, 18F-AV-1451 was superior to CSF tau biomarkers for AD diagnosis. The diagnostic performance of CSF tau biomarkers may be confounded both by the physiologic between-person variability in CSF tau concentrations and by release of tau due to nonspecific neuronal injury.25 Another possibility that needs to be tested by longitudinal studies is that CSF tau may be more sensitive than 18F-AV-1451 to very early pathologic tau-related changes. For example, release of neuronal tau may be involved in interneuronal transmission of tau pathology,26 which hypothetically may occur before tau pathology is detected by 18F-AV-1451 imaging. Similarly, we have previously shown that CSF biomarkers may be more sensitive to Aβ pathology compared to PET imaging.27 The fact that CSF tau measures did not differ between prodromal AD and AD dementia suggests that these biomarkers plateau at the prodromal stage of the disease. In contrast, the 18F-AV-1451 signal was higher in the AD dementia than in the prodromal AD group, which likely reflects a continuous accumulation of tau as the disease progresses. One important difference between CSF and PET tau measurements is that 18F-AV-1451 makes it possible to track a potential spread of tau to new brain regions. Some regions may be affected later in the disease process (e.g., tau stage VI regions may be affected after tau stage V regions). This may explain why the latest stages show less separation between diagnostic groups than the earlier stages.
We did not find different results for CSF t-tau and p-tau, despite the fact that CSF p-tau has been suggested to be more closely related to brain tau pathology than CSF t-tau.1 However, we note that histopathology studies have found correlations for both CSF t-tau and p-tau with tangle load,28–30 which is in agreement with our finding that both CSF t-tau and p-tau had similar diagnostic performance as 18F-AV-1451.
One limitation is the lack of neuropathologic confirmation of tau pathology. Previous studies have found strong correlations between 18F-AV-1451 PET and tau aggregates consisting of combined 4R and 3R tau,31 and some studies have found correlations between CSF tau and brain tau pathology28–30 (but not all studies have confirmed this32). Another limitation is that we only included patients with prodromal AD and patients with AD dementia with biomarker evidence of amyloid pathology. This was done because modern research criteria emphasize amyloid biomarkers for a diagnosis of AD,33,34 but we acknowledge that it restricts the generalizability to patients with AD with evidence of amyloid pathology. Future studies may include a more diverse patient population, including patients with other dementias. We also acknowledge that both CSF tau and 18F-AV-1451 may be susceptible to measurement errors. The CSF tau measurements were done according to the Alzheimer's Association's guidelines, and the coefficients of variation were <10%. The 18F-AV-1451 signal may be susceptible to off-target binding in several locations. One prominent off-target site is the choroid plexus, which is very close to the hippocampal formation. Partly because of this, we did not include the 18F-AV-1451 signal in the hippocampus in this study.
We used the cerebellar gray matter as reference region for 18F-AV-1451, but the choice of an optimal reference region is not straightforward. There may be minor off-target binding of 18F-AV-1451 in the rostral part of cerebellum, which may decrease the ability of 18F-AV-1451 to separate patients with AD from controls. However, despite this potential source of variability, we demonstrated almost 100% separation between AD dementia and controls. In our view, this provides proof-of-principle of the superior diagnostic performance of 18F-AV-1451 compared to CSF tau measures. Other options for reference regions are problematic. Cerebellar white matter may have a relatively strong nonspecific binding. Cerebral white matter could be used, but the included ROIs then need to be clearly separated from the off-target binding regions in the basal ganglia/thalamus. Future studies may evaluate whether other reference regions would improve the results further.
We found that 18F-AV-1451 PET imaging has superior diagnostic performance compared to CSF tau for AD in the dementia stage, but the 2 tau biomarker modalities have equal performance for prodromal AD. Future studies may compare longitudinal CSF and PET tau measures to clarify how these measures may develop over time, and how they may respond to disease-modifying treatment in AD.
Glossary
- Aβ
β-amyloid
- AD
Alzheimer disease
- ANT
Advanced Normalization Tools
- AUROC
area under the receiver operating characteristic curve
- DSM-III-R
Diagnostic and Statistical Manual of Mental Disorders, 3rd edition, revised
- MCI
mild cognitive impairment
- MMSE
Mini-Mental State Examination
- p-tau
phosphorylated tau
- QC
quality control
- ROI
region of interest
- SUV
standardized uptake value
- SUVR
standardized uptake value ratio
- t-tau
total tau
Author contributions
Drafting the manuscript: N.M. Revising the manuscript for content: all authors. Study concept or design: N.M., O.H. Analysis or interpretation of data: N.M., O.H. Contribution of vital reagents/tools/patents: K.B., H.Z. Acquisition of data: R.S., O.S., D.H., T.O., J.J., H.Z., K.B. Statistical analysis: N.M. and P.I. Study supervision or coordination: N.M., O.H. Obtaining funding: N.M., O.H.
Study funding
Work in the authors' laboratory was supported by the European Research Council, the Swedish Research Council, the Strategic Research Area MultiPark (Multidisciplinary Research in Parkinson's disease) at Lund University, the Swedish Brain Foundation, the Skåne University Hospital Foundation, the Swedish Alzheimer Foundation, the Marianne and Marcus Wallenberg Foundation, the Swedish federal government under the ALF agreement, the Greta and Johan Kock Foundation for Medical Research, the Thelma Zoega foundation for medical research, the Bundy Academy, the Torsten Söderberg Foundation, and the Magnus Bergwall Foundation. The funding sources had no role in the design and conduct of the study, in the collection, analysis, or interpretation of the data, or in the preparation, review, or approval of the manuscript. The precursor of AV-1451 was provided by Avid Radiopharmaceuticals.
Disclosure
N. Mattsson, R. Smith, O. Strandberg, S. Palmqvist, M. Schöll, P.S. Insel, D. Hägerström, and T. Ohlsson report no disclosures relevant to the manuscript. H. Zetterberg has served on advisory boards for Roche, Pharmasum, and Eli Lilly. Dr. Zetterberg is a cofounder of Brain Biomarker Solutions in Gothenburg AB, a GU Venture–based platform company at the University of Gothenburg. K. Blennow has served on advisory boards or as a consultant for Alzheon, Eli Lilly, Fujirebio Europe, IBL International, Novartis, and Roche Diagnostics. Dr. Blennow is a cofounder of Brain Biomarker Solutions in Gothenburg AB, a GU Venture–based platform company at the University of Gothenburg. J. Jögi reports no disclosures relevant to the manuscript. O. Hansson has served on advisory boards for Eli Lilly and received research support from GE Healthcare and Hoffmann La-Roche. Go to Neurology.org/N for full disclosures.
References
- 1.Blennow K, Hampel H, Weiner M, Zetterberg H. Cerebrospinal fluid and plasma biomarkers in Alzheimer disease. Nat Rev Neurol 2010;6:131–144. [DOI] [PubMed] [Google Scholar]
- 2.Chien DT, Bahri S, Szardenings AK, et al. Early clinical PET imaging results with the novel PHF-tau radioligand [F-18]-T807. J Alzheimers Dis 2013;34:457–468. [DOI] [PubMed] [Google Scholar]
- 3.Xia C-F, Arteaga J, Chen G, et al. [18F]T807, a novel tau positron emission tomography imaging agent for Alzheimer's disease. Alzheimers Dement 2013;9:666–676. [DOI] [PubMed] [Google Scholar]
- 4.Marquié M, Normandin MD, Vanderburg CR, et al. Validating novel tau positron emission tomography tracer [F-18]-AV-1451 (T807) on postmortem brain tissue. Ann Neurol 2015;78:787–800. [DOI] [PMC free article] [PubMed] [Google Scholar]
- 5.Brier MR, Gordon B, Friedrichsen K, et al. Tau and Aβ imaging, CSF measures, and cognition in Alzheimer's disease. Sci Transl Med 2016;8:338ra66. [DOI] [PMC free article] [PubMed] [Google Scholar]
- 6.Gordon BA, Friedrichsen K, Brier M, et al. The relationship between cerebrospinal fluid markers of Alzheimer pathology and positron emission tomography tau imaging. Brain J Neurol 2016;139:2249–2260. [DOI] [PMC free article] [PubMed] [Google Scholar]
- 7.Johnson KA, Schultz A, Betensky RA, et al. Tau positron emission tomographic imaging in aging and early Alzheimer disease. Ann Neurol 2016;79:110–119. [DOI] [PMC free article] [PubMed] [Google Scholar]
- 8.Schöll M, Lockhart SN, Schonhaut DR, et al. PET imaging of tau deposition in the aging human brain. Neuron 2016;89:971–982. [DOI] [PMC free article] [PubMed] [Google Scholar]
- 9.Schwarz AJ, Yu P, Miller BB, et al. Regional profiles of the candidate tau PET ligand 18F-AV-1451 recapitulate key features of Braak histopathological stages. Brain J Neurol 2016;139:1539–1550. [DOI] [PubMed] [Google Scholar]
- 10.Chhatwal JP, Schultz AP, Marshall GA, et al. Temporal T807 binding correlates with CSF tau and phospho-tau in normal elderly. Neurology 2016;87:920–926. [DOI] [PMC free article] [PubMed] [Google Scholar]
- 11.Jack CR, Wiste HJ, Weigand SD, et al. Different definitions of neurodegeneration produce similar amyloid/neurodegeneration biomarker group findings. Brain 2015;138:3747–3759. [DOI] [PMC free article] [PubMed] [Google Scholar]
- 12.Palmqvist S, Zetterberg H, Mattsson N, et al. Detailed comparison of amyloid PET and CSF biomarkers for identifying early Alzheimer disease. Neurology 2015;85:1240–1249. [DOI] [PMC free article] [PubMed] [Google Scholar]
- 13.American Psychiatric Association: Work Group to Revise DSM-III. Diagnostic and Statistical Manual of Mental Disorders: DSM-III-R, 3rd ed. Washington, DC: American Psychiatric Association; 1987. [Google Scholar]
- 14.McKhann G, Drachman D, Folstein M, Katzman R, Price D, Stadlan EM. Clinical diagnosis of Alzheimer's disease: report of the NINCDS-ADRDA work group under the auspices of Department of Health and Human Services Task Force on Alzheimer's disease. Neurology 1984;34:939–944. [DOI] [PubMed] [Google Scholar]
- 15.Rosen WG, Mohs RC, Davis KL. A new rating scale for Alzheimer's disease. Am J Psychiatry 1984;141:1356–1364. [DOI] [PubMed] [Google Scholar]
- 16.Palmqvist S, Zetterberg H, Blennow K, et al. Accuracy of brain amyloid detection in clinical practice using cerebrospinal fluid β-amyloid 42: a cross-validation study against amyloid positron emission tomography. JAMA Neurol 2014;71:1282–1289. [DOI] [PubMed] [Google Scholar]
- 17.Grabner G, Janke AL, Budge MM, Smith D, Pruessner J, Collins DL. Symmetric atlasing and model based segmentation: an application to the hippocampus in older adults. Med Image Comput Comput Assist Interv 2006;9:58–66. [DOI] [PubMed] [Google Scholar]
- 18.Avants BB, Tustison NJ, Stauffer M, Song G, Wu B, Gee JC. The Insight ToolKit image registration framework. Front Neuroinform 2014;8:44. [DOI] [PMC free article] [PubMed] [Google Scholar]
- 19.Hahn A, Schain M, Erlandsson M, et al. Modeling strategies for quantification of in vivo 18F-AV1451 binding in patients with tau pathology. J Nucl Med 2017;58:623–631. [DOI] [PubMed] [Google Scholar]
- 20.Cox RW. AFNI: software for analysis and visualization of functional magnetic resonance neuroimages. Comput Biomed Res 1996;29:162–173. [DOI] [PubMed] [Google Scholar]
- 21.Rousset OG, Ma Y, Evans AC. Correction for partial volume effects in PET: principle and validation. J Nucl Med 1998;39:904–911. [PubMed] [Google Scholar]
- 22.Cho H, Choi JY, Hwang MS, et al. In vivo cortical spreading pattern of tau and amyloid in the Alzheimer disease spectrum. Ann Neurol 2016;80:247–258. [DOI] [PubMed] [Google Scholar]
- 23.Jack CR Jr, Wiste HJ, Weigand SD, et al. Defining imaging biomarker cut points for brain aging and Alzheimer's disease. Alzheimers Dement 2017;13:205–216. [DOI] [PMC free article] [PubMed] [Google Scholar]
- 24.Braak H, Braak E. Neuropathological stageing of Alzheimer-related changes. Acta Neuropathol 1991;82:239–259. [DOI] [PubMed] [Google Scholar]
- 25.Mattsson N. CSF biomarkers in neurodegenerative diseases. Clin Chem Lab Med 2011;49:345–352. [DOI] [PubMed] [Google Scholar]
- 26.Maia LF, Kaeser SA, Reichwald J, et al. Changes in amyloid-β and tau in the cerebrospinal fluid of transgenic mice overexpressing amyloid precursor protein. Sci Transl Med 2013;5:194re2. [DOI] [PubMed] [Google Scholar]
- 27.Palmqvist S, Mattsson N, Hansson O; Alzheimer's Disease Neuroimaging Initiative. Cerebrospinal fluid analysis detects cerebral amyloid-β accumulation earlier than positron emission tomography. Brain 2016;139:1226–1236. [DOI] [PMC free article] [PubMed] [Google Scholar]
- 28.Buerger K, Ewers M, Pirttila T, et al. CSF phosphorylated tau protein correlates with neocortical neurofibrillary pathology in Alzheimer's disease. Brain 2006;129:3035–3041. [DOI] [PubMed] [Google Scholar]
- 29.Tapiola T, Alafuzoff I, Herukka SK, et al. Cerebrospinal fluid {beta}-amyloid 42 and tau proteins as biomarkers of Alzheimer-type pathologic changes in the brain. Arch Neurol 2009;66:382–389. [DOI] [PubMed] [Google Scholar]
- 30.Seppälä TT, Nerg O, Koivisto AM, et al. CSF biomarkers for Alzheimer disease correlate with cortical brain biopsy findings. Neurology 2012;78:1568–1575. [DOI] [PubMed] [Google Scholar]
- 31.Smith R, Wibom M, Olsson T, et al. Posterior accumulation of tau and concordant hypometabolism in an early-onset Alzheimer's disease patient with presenilin-1 mutation. J Alzheimers Dis 2016;51:339–343. [DOI] [PubMed] [Google Scholar]
- 32.Engelborghs S, Sleegers K, Cras P, et al. No association of CSF biomarkers with APOEepsilon4, plaque and tangle burden in definite Alzheimer's disease. Brain 2007;130:2320–2326. [DOI] [PubMed] [Google Scholar]
- 33.McKhann GM, Knopman DS, Chertkow H, et al. The diagnosis of dementia due to Alzheimer's disease: recommendations from the National Institute on Aging-Alzheimer's Association workgroups on diagnostic guidelines for Alzheimer's disease. Alzheimers Dement 2011;7:263–269. [DOI] [PMC free article] [PubMed] [Google Scholar]
- 34.Dubois B, Feldman HH, Jacova C, et al. Advancing research diagnostic criteria for Alzheimer's disease: the IWG-2 criteria. Lancet Neurol 2014;13:614–629. [DOI] [PubMed] [Google Scholar]


