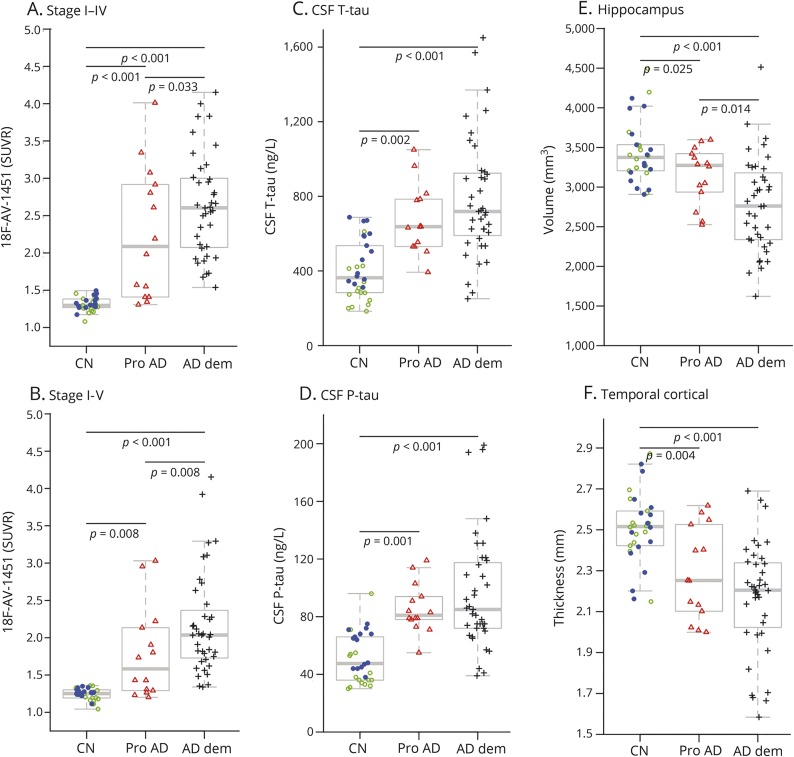
Figure 2. 18F-AV-1451, CSF tau biomarkers, and brain structure.
(A, B) 18F-AV-1451 signal in tau stage regions I–IV and tau stage I–V. (C, D) CSF total tau (t-tau) and phosphorylated tau (p-tau). (E, F) Hippocampal volume and cortical thickness in temporal lobe regions. Diagnostic groups (controls [CN], prodromal Alzheimer disease [Pro AD], and Alzheimer disease dementia [AD dem]) were compared by linear regression, adjusted for age. The controls are coded by amyloid status (amyloid-negative, green open circles; amyloid-positive, blue dots).

