

Abstract
Objective
To investigate the kinetics and metabolism of caffeine in serum from patients with Parkinson disease (PD) and controls using liquid chromatography–mass spectrometry.
Methods
Levels of caffeine and its 11 metabolites in serum from 108 patients with PD and 31 age-matched healthy controls were examined by liquid chromatography–mass spectrometry. Mutations in caffeine-associated genes were screened by direct sequencing.
Results
Serum levels of caffeine and 9 of its downstream metabolites were significantly decreased even in patients with early PD, unrelated to total caffeine intake or disease severity. No significant genetic variations in CYP1A2 or CYP2E1, encoding cytochrome P450 enzymes primarily involved in metabolizing caffeine in humans, were detected compared with controls. Likewise, caffeine concentrations in patients with PD with motor complications were significantly decreased compared with those without motor complications. No associations between disease severity and single nucleotide variants of the ADORA2A gene encoding adenosine 2A receptor were detected, implying a dissociation of receptor sensitivity changes and phenotype. The profile of serum caffeine and metabolite levels was identified as a potential diagnostic biomarker by receiver operating characteristic curve analysis.
Conclusion
Absolute lower levels of caffeine and caffeine metabolite profiles are promising diagnostic biomarkers for early PD. This is consistent with the neuroprotective effect of caffeine previously revealed by epidemiologic and experimental studies.
Classification of evidence
This study provides Class III evidence that decreased serum levels of caffeine and its metabolites identify patients with PD.
Parkinson disease (PD) is a neurodegenerative disease characterized by motor and nonmotor symptoms.1 There have been several reports suggesting an inverse association between daily caffeine consumption and a reduced risk of developing PD in men, and in women not taking hormone replacement therapy.2,3 Caffeine can protect against nigral neurodegeneration in the 1-methyl-4-phenyl-1,2,3,6-tetrahydropyridine (MPTP)–induced PD mouse model.4,5 Likewise, the caffeine metabolites paraxanthine and theophylline similarly attenuate MPTP neurotoxicity.6 However, changes in the entire caffeine metabolic pathway in patients with PD remain unclear.
Clinically, caffeine appears to improve motor symptoms by antagonizing adenosine 2A receptors (A2A-Rs).7–9 One of the biological effects of caffeine is the nonselective antagonism of A2A-Rs, which is encoded by the A2A-R gene (ADORA2A). Caffeine is primarily metabolized by 2 cytochrome P450 enzymes, cytochrome P450 family 1 subfamily A member 2 (CYP1A2) and cytochrome P450 family 2 subfamily E member 1 (CYP2E1).10–12 No associations between ADORA2A and CYP1A2 gene variants and polymorphisms and PD onset frequencies have been detected,13–15 but the association of caffeine with motor fluctuations has not been addressed.
The development of blood-based biomarkers for PD is of high priority because of the easy sample collection procedure.16 Four caffeine metabolites have been identified as biomarkers for de novo PD progression using gas chromatography–mass spectrometry and liquid chromatography–mass spectrometry (LC-MS).17 We have also reported decreased serum levels of caffeine and 4 downstream metabolites in patients with PD receiving antiparkinsonian treatment.18 Here we analyzed serum caffeine and metabolite concentrations and variations in caffeine-associated genes.
Methods
Participants
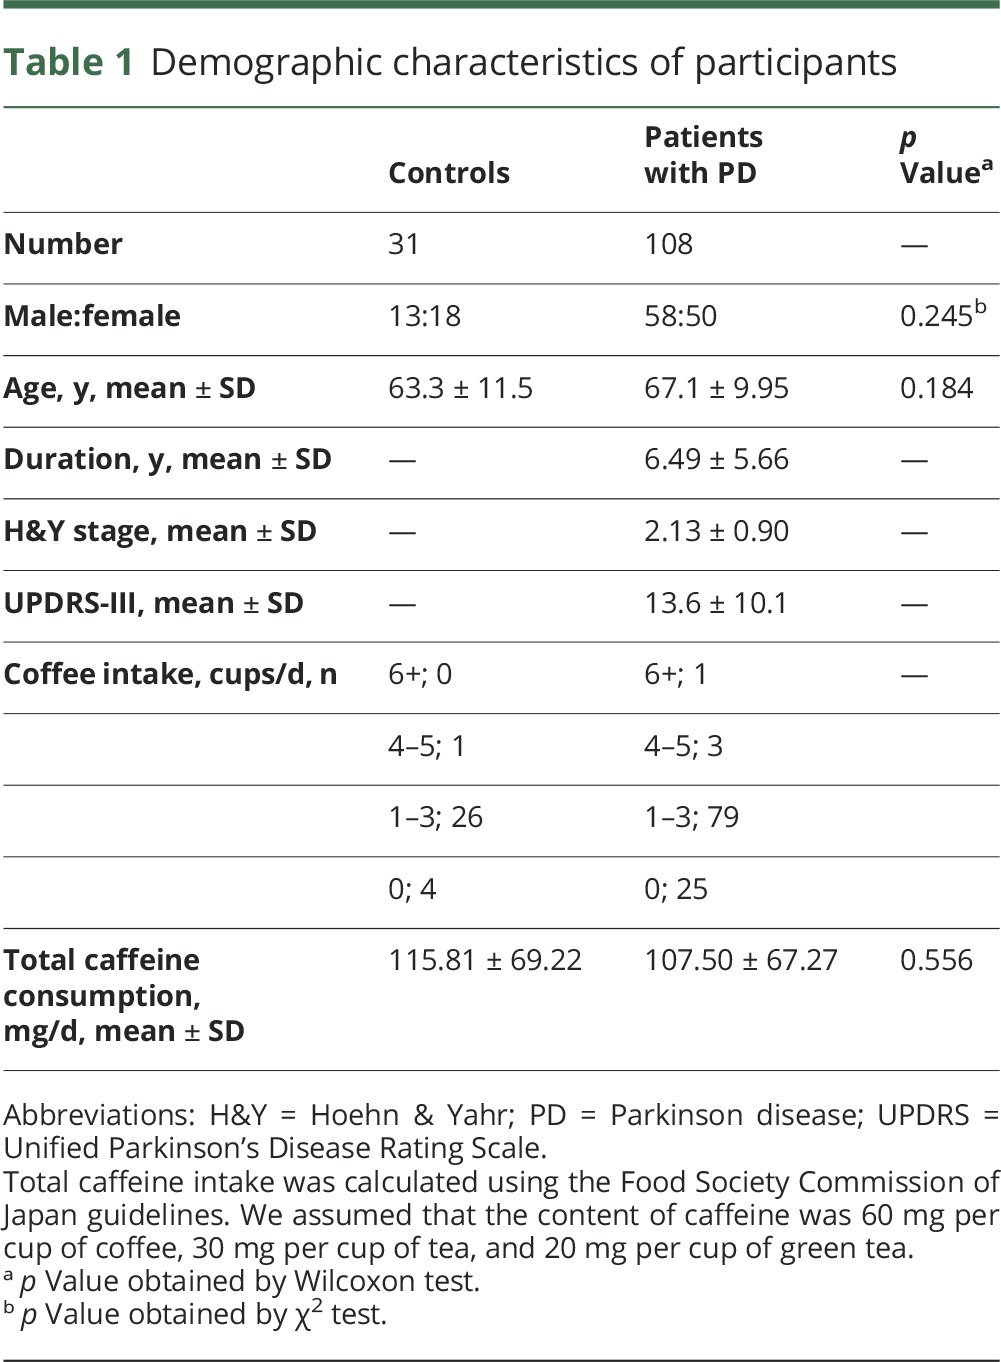
We recruited 31 healthy controls (13 men) and 108 patients with PD without dementia (58 men) (table 1). All participants with PD had been treated at Juntendo University Hospital. Control participants were the patients' spouses and patients with asymptomatic brain ischemia at Juntendo University Hospital. Patients were eligible for inclusion if they were diagnosed with idiopathic PD based on Movement Disorders Society criteria, with no dementia (with a Mini-Mental State Examination [MMSE] score ≥24).1 Hoehn & Yahr (H&Y) stages and Unified Parkinson's Disease Rating Scale motor section (UPDRS-III) scores were defined during the “on” phase for practical and ethical reasons. Levodopa equivalent doses (LEDs) were calculated based on a previous report.19 We assessed caffeine concentrations as 60 mg per cup of coffee, 30 mg per cup of tea, and 20 mg per cup of green tea, using the Food Society Commission of Japan guidelines.20 No participant had a history of cancer, aspiration pneumonia, or collagen vascular diseases.
Table 1.
Demographic characteristics of participants
In addition to the cohort for serum caffeine metabolism analysis, we recruited an additional 51 healthy controls (25 men) (total controls = 82) and 67 patients with PD (33 men) (total patients with PD = 176) for gene analysis.
Standard protocol approvals, registrations, and patient consents
This study protocol complied with the Declaration of Helsinki and was approved by the ethics committee of Juntendo University (2012157). Written informed consent was given by all participants.
Sample collection
Blood samples were collected at the outpatient department of Juntendo University Hospital between December 2013 and February 2014. Following overnight fasting (12–14 hours), a serum sample was obtained using 7 mL EDTA-2Na blood spits (PN7; SRL, Tokyo, Japan) followed by 2–3 inversions. The samples then rested for 30–60 minutes at 4°C followed by centrifugation for 15 minutes at ×3,000g. The serum was separated into collection tubes and stored in liquid nitrogen until analysis.
Sample preparation
Analyzers were blinded to all serum samples and participants' information. We used the same methodology for the sample preparation as the one employed in a previous study.21 Briefly, 100 μL of serum was immediately plunged into 400 μL acetonitrile with 200 pmol of caffeine-(trimethyl-13C3); 3-methylxanthine-2,4,5,6-13C4, 1,3,9-15N3; 7-methylxanthine-2,4,5,6-13C4, 1,3-15N2; paraxanthine-d3; and theophylline-2-13C-1, 3-15N2 were purchased from Sigma (St. Louis, MO) as internal standards. The solution was centrifuged at ×17,000g for 20 minutes at 4°C, and the upper aqueous layer collected and passed through a 0.2 μm nylon filter. The sample was dissolved in 50 μL of Milli-Q water after nitrogen drying and 5 μL was applied to LC-MS analysis.
Liquid chromatography–mass spectrometry
Caffeine and 11 downstream metabolites were separated by high-performance liquid chromatography (Gilson, Middleton, WI) using a Synergi Fusion RP column (100 × 3.0 mm, 2.5 μm particle, 100 Å; Phenomenex, Torrance, CA). Column temperature was set at 50°C. The high-performance liquid chromatography system was connected to TSQ Quantum Ultra AM mass spectrometer (Thermo Fisher Scientific; Waltham, MA). The target compounds were analyzed in selected reaction monitoring positive ionization mode.
Genomic DNA analysis
DNA was extracted from peripheral blood according to standard protocol using a Qiagen (Venlo, the Netherlands) kit. To exclude the possibility that caffeine metabolism is accelerated by cytochrome P450 upregulation,11,12 we performed genetic screening of CYP1A2 and CYP2E1. Also, as PD motor fluctuations might derive from altered sensitivity of A2A-R, a main target of caffeine and its metabolites, we investigated ADORA2A gene variations by direct sequencing. Pathogenicity of the identified missense variants was assessed using the sorting intolerant from tolerant (SIFT) method.22 The frequencies of each variant were evaluated using the Exome Aggregation Consortium (ExAC) database (http://exac.broadinstitute.org/).
Cardiac 123I-metaiodobenzylguanidine scintigraphy
All patients with PD underwent cardiac 123I-metaiodobenzylguanidine (MIBG) scintigraphy to assess any cardiac sympathetic denervation in the heart. We used the same methodology as the one employed in a previous study.23
Statistical analysis
When a value was under the limit of detection, we assigned it half the minimum value of its compound. Wilcoxon tests were used to compare all individual analyses between controls and patients with PD. The Steel test, a nonparametric, multiple comparison test, was used to compare patients stratified by H&Y stage (I, II, III, and IV) and controls. Receiver operating characteristic (ROC) analysis was carried out using JMP12 (SAS Institute Japan, Chuo-Ku), and the optimal cutoff values and area under the curve (AUC) were calculated using Youden index maximums (sensitivity + specificity − 1).24 Pearson correlation coefficients were used to assess the relationships between serum caffeine levels and LED or UPDRS in PD using JMP12. We used conditional logistic regression analyses to calculate odds ratios and 95% confidence interval for allelic and genotypic correlations with PD risk. p < 0.05 Was considered statistically significant.
Classification of level of evidence
This study is rated Class III because of the diagnostic case–control study design and the risk of spectrum bias.
Results
Participants
Patients with PD and controls had similar mean ages at blood sampling (table 1). There were no significant differences in the sex ratio between patients with PD and controls. Importantly, no significant differences in total caffeine intake between controls and patients with PD were revealed (table 1). Table e-1 (links.lww.com/WNL/A90) shows the H&Y stages, UPDRS-III scores, MMSE scores, LED, coffee and caffeine consumption, and wearing-off and dyskinesia (expressed as motor fluctuations) in these patients. On average, PD disease severity was mild to moderate according to H&Y stage and UPDRS-III scores. When stratified by disease severity, there were no significant differences in the sex ratios of each group. Conversely, age, disease duration, UPDRS-III score, LED, and occurrences of wearing-off and dyskinesia (defined as motor fluctuations) significantly increased with disease severity. There was no difference in age between patients with PD and controls in the larger gene analysis cohort (table e-2). No significant differences between controls and patients with PD in sex or age were detected.
Caffeine metabolite serum levels
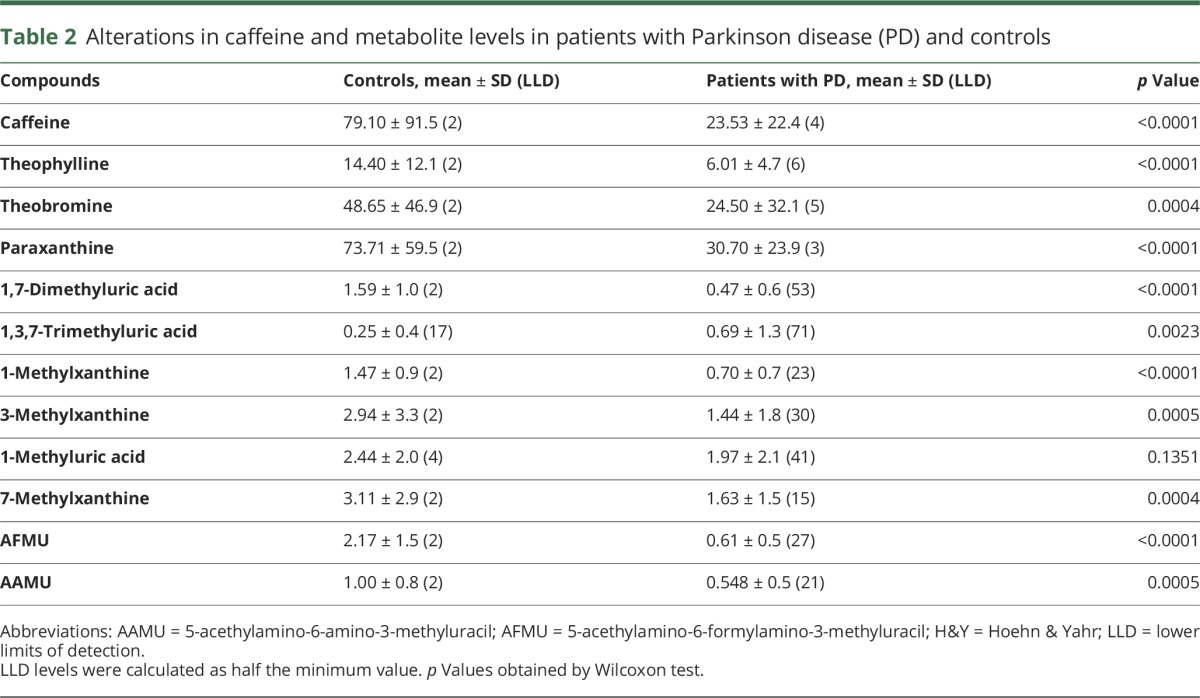
Serum levels of caffeine and almost all of its 11 downstream metabolites were lower in patients with PD than in controls (p < 0.0001) (table 2 and figure e-1, links.lww.com/WNL/A89). The 3 main metabolites generated from caffeine—theophylline, theobromine, and paraxanthine—were significantly lower in patients with PD. Although 4 controls had extremely high serum caffeine levels, and were excluded as outliers, patients with PD still had lower caffeine levels (p = 0.0004). Serum levels of caffeine in patients with PD correlated with caffeine consumption mildly (p = 0.0476) compared with those in controls (p = 0.0119) (figure e-2). Serum levels of 1-methyluric acid did not differ between the 2 groups, but serum 1,3,7-trimethyluric acid levels were higher in patients with PD than in controls. However, 1-methyluric acid and 1,3,7-trimethyluric acid levels were under the limit of detection in 32% and 63% of participants, respectively.
Table 2.
Alterations in caffeine and metabolite levels in patients with Parkinson disease (PD) and controls
Associations of caffeine metabolites with H&Y stage, UPDRS-III scores, and LED
Comparing controls and patients with PD in each H&Y stage, most metabolites were lower in every H&Y stage of PD (table e-3, links.lww.com/WNL/A90). However, there were no significant differences in the serum levels of any metabolites in each H&Y stage by the Steel test. We could not evaluate H&Y stage V patients because only one was recruited. We analyzed the coefficients of correlation between the serum levels of each metabolite and UPDRS-III scores (table e-4). As expected, UPDRS-III scores did not relate to the serum concentrations of any metabolite. On the contrary, these metabolites decreased even in the very early stage of PD. Although most patients were receiving some antiparkinsonian drug (98%), LED did not relate to the serum levels of any metabolite (table e-4).
Diagnostic values of caffeine and metabolites using ROC curve analyses
To identify whether these metabolites could be potential diagnostic biomarkers for PD, we performed ROC curve analysis for multiple marker combinations using Youden index maximums (sensitivity + specificity − 1) (figure 1).24 The AUC of caffeine at 33.04 pmol/10 μL cutoff was 0.78 and the sensitivity and specificity were 76.9% and 74.2%, respectively. The AUC improved (0.87) when the main metabolites of caffeine (i.e., theophylline, theobromine, and paraxanthine) were included. Moreover, we could distinguish patients with PD from controls more accurately using the data from all measurable metabolites (AUC 0.98).
Figure 1. Receiver operating characteristic (ROC) curves.

ROC curves were made by the Youden index using the maximum of sensitivity + specificity − 1 ([A] caffeine, [B] caffeine and its main metabolites, [C] all metabolites). The optimal cutoff point was calculated using the maximum sensitivity + specificity. The main metabolites were paraxanthine, theophylline, and theobromine. AUC = area under the curve.
Associations of caffeine metabolites with constipation, motor fluctuations, and MIBG scintigraphy
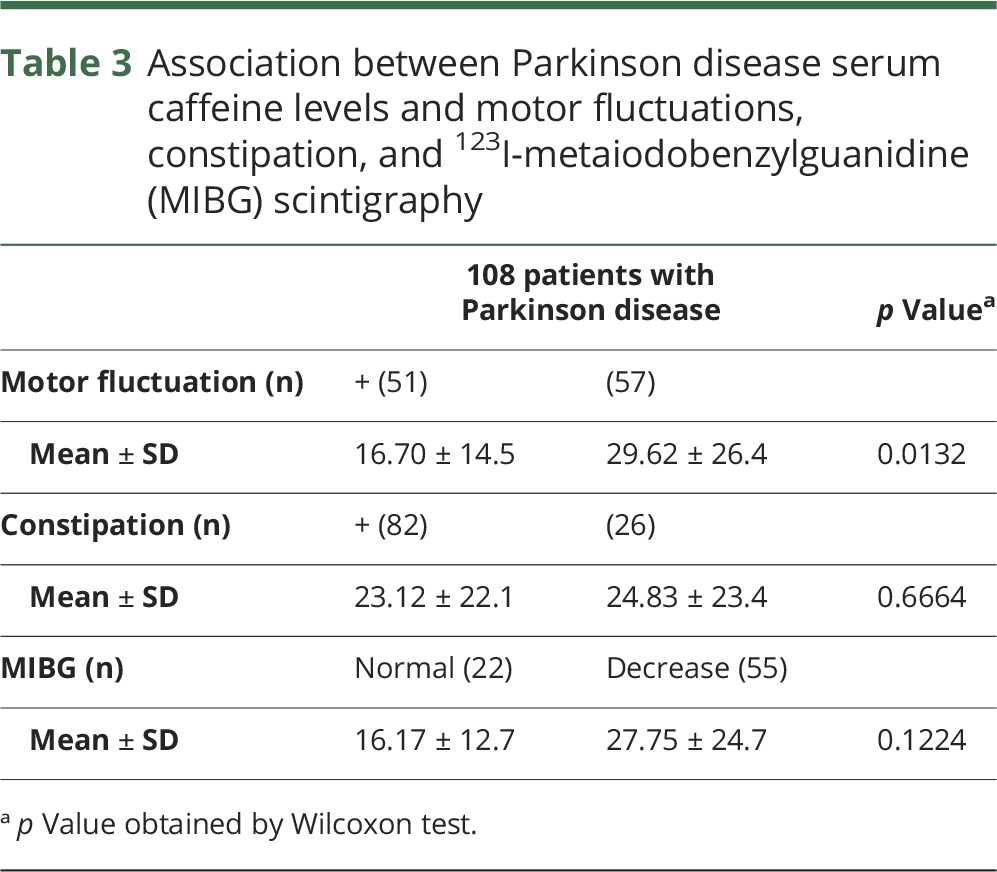
In this study, motor complications, including wearing-off and dyskinesia, were observed in 47% of patients with PD. Disease severity was worse in those with motor complications than those without: UPDRS-III score (mean ± SD), with, 15.96 ± 10.78; without, 11.00 ± 8.40 (p = 0.0084); H&Y stage, with, 2.53 ± 0.92; without, 1.75 ± 0.71 (p < 0.0001). As expected, serum caffeine levels were significantly lower in PD with motor fluctuations than without (table 3). 1,7-Dimethyluric acid showed similar tendency to caffeine (p < 0.0001). No significant changes of the other metabolites, including theophylline, theobromine, and paraxanthine, were detected in PD with or without motor fluctuations (data not shown). The occurrence (or predominance) of constipation, a common clinical feature of PD, was 75.9% and χ2 tests revealed no statistical significance of caffeine levels in PD with or without it (table 3). Myocardial scintigraphy was performed in most patients with PD (71%), and a reduced early (or delayed) heart/mediastinum ratio of MIBG uptake, a well-established diagnostic characteristic as well as a disease severity biomarker, was evident in 71% of patients with PD.25,26 However, the tests did not reveal any correlation between reduced MIBG uptake and serum caffeine concentrations (table 3).
Table 3.
Association between Parkinson disease serum caffeine levels and motor fluctuations, constipation, and 123I-metaiodobenzylguanidine (MIBG) scintigraphy
Analysis of genes associated with caffeine metabolism
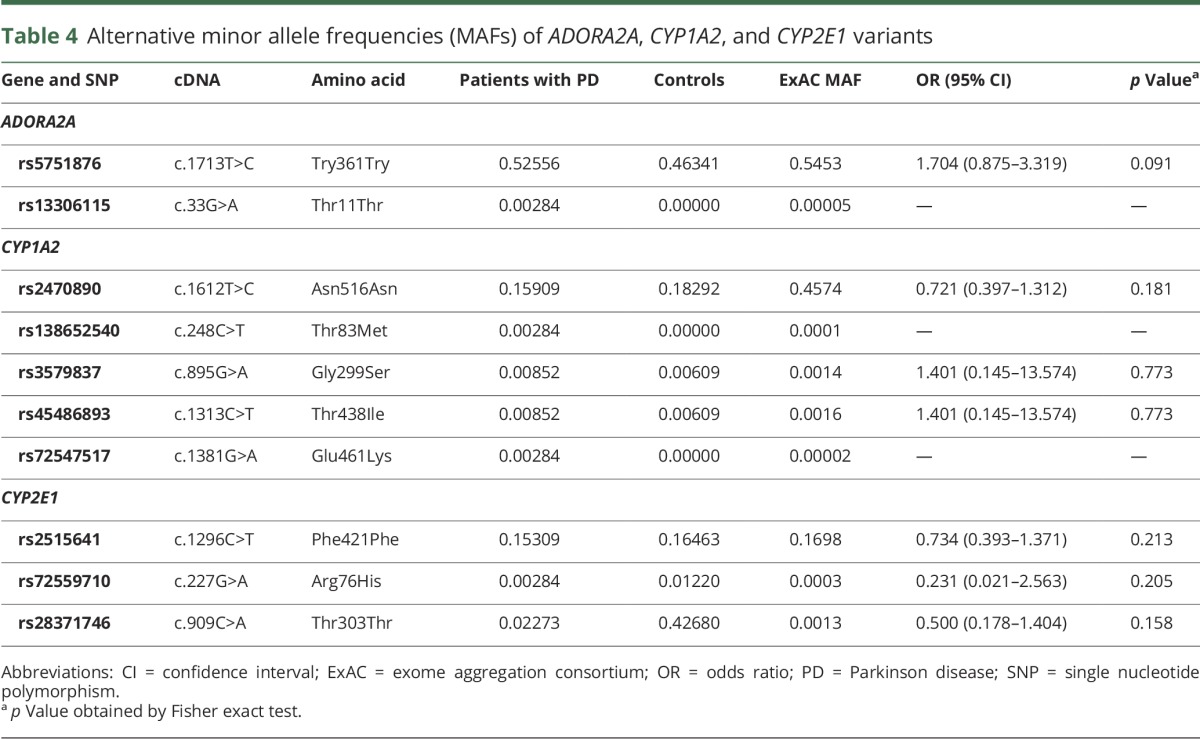
Two single nucleotide variations (SNVs) in ADORA2A occurred at similar frequencies in patients with PD with motor complications to those without (data not shown). We detected 7 SNVs previously reported in the public ExAC database (table 4). Four CYP1A2 and CYP2E1 SNVs (rs35796837, rs45486893, rs72559710, and rs28371746) were identified with similar frequencies in both patients with PD and controls. The other 3 (rs13306115, rs138652540, and rs72547517) were found only in patients with PD, at a higher frequency than in ExAC, but were not statistically significant. Another 3 SNVs, ADORA2A rs57851876, CYP1A2 rs2470890, and CYP2E1 rs2515641, were detected (table 4), with no significant differences in frequency between patients with PD and controls. Overall our genomic analyses of caffeine-related genes revealed no differences in SNV frequencies between patients with PD and controls.
Table 4.
Alternative minor allele frequencies (MAFs) of ADORA2A, CYP1A2, and CYP2E1 variants
Discussion
In this study, the absolute serum concentrations of caffeine and 9 of its downstream metabolites were significantly lower in patients with PD than in controls. Both CYP1A2 and CYP2E1, the main metabolizers of caffeine in humans, had no significant SNV differences between controls and patients with PD. No significant associations between disease severity and the levels of each of metabolite were detected in patients with PD.
Caffeine metabolite profiles may be reliable diagnostic biomarkers for early PD. As patients with PD have severe H&Y stages, occurrence ratio of motor fluctuations increased more; however, levels of caffeine and theophylline mildly decreased, consistent with their protective effect against progressive decline. Although theophylline and paraxanthine share pharmacologic properties with caffeine, as all 3 are adenosine receptor antagonists, the frequencies of ADORA2A SNVs were similar in patients with PD and controls.
The levels of caffeine and 9 related metabolites were significantly decreased in patients with PD, with the levels of 1,3,7-trimethyluric acid highly variable and below the limit of detection in more than 50% of patients with PD. 1,3,7-Trimethyluric acid is a methyl derivative of uric acid, as well as a metabolite of methylxanthines including caffeine and theophylline, so it is difficult to interpret the clinical significance of this.
Serum caffeine and estrogen share a common cytochrome P450 for their metabolism or detoxification.27 According to epidemiologic and in vivo studies, higher estrogen levels attenuate the effects of administered caffeine on nigral degeneration.5,28 In this study, no significant differences in caffeine and its metabolites were detected between male and female patients (data not shown). We speculate that higher ratios of postmenopausal women or ethnic differences might influence the relationship between PD and caffeine metabolism.
Autophagy, a protein degradation system removing neurodegeneration-associated proteins,29 is associated with PD pathogenesis. However, a relatively high concentration of caffeine (>5 mM) is required to exert any effect on the induction of autophagy and apoptosis in tumor cell lines.30 In vivo studies have demonstrated the neuroprotective effects of caffeine, paraxanthine, and theophylline in MPTP PD mice models,6 suggesting that caffeine and its metabolites may contribute to neuroprotection in PD.
Caffeine is actively absorbed from the small intestine and more than 95% is metabolized by CYP1A2.31 Moreover, interindividual variations in CYP1A2 enzymatic activity correlate with differences in caffeine metabolism.32 The CYP1A2 rs762551 AA genotype is related to increased caffeine metabolism,33 but this was not detected in patients with PD or controls in our cohort. Although the CYP1A2 rs2470890 CC genotype is associated with a decreased risk of PD in coffee drinkers,34 this was present at a similar frequency in patients with PD and controls. However, no significant differences in these allele frequencies between patients with PD and controls were detected. The frequency of the CYP1A2 rs35796837 and rs45486893, CYP2E1 rs72559710 and rs28371746, and CYP2E1 rs2515641 SNVs were similar in both groups. While ADORA2A rs13306115 is a synonymous amino acid variant, it is possible that the CYP1A2 rs138652540 and rs72547517 variants had different amino acids in ExAC. In particular, rs72547517 is predicted to be deleterious according to SIFT analyses22; thus, further investigation in more cases is needed to clarify this relationship. Taken together, genetic changes in CYP1A2, CYP2E1, and ADORA2A, affecting their caffeine metabolism gene products, may regulate receptor affinity, but were not significantly detected in PD. This suggests that neither caffeine metabolism nor A2A-R sensitivity has any effects on decreased serum levels of caffeine metabolites in PD or the incidence of motor fluctuations, respectively.
Serum levels of caffeine and 9 related metabolites were uniformly and significantly decreased in patients with PD, despite an equivalent caffeine intake to controls. More importantly, serum levels of caffeine in patients with PD related to caffeine intake significantly, but those in controls did more significantly, indicative of less caffeine absorption in patients with PD. Gastrointestinal dysfunction, especially constipation, affects up to 80% of patients with PD and sometimes precedes the onset of symptoms by years.35 A recent analysis revealed that fecal microbial flora is altered in PD, suggesting an environmental change in the large intestine.36,37 Although constipation and fecal bacterial change are predominantly attributed to large intestine function, caffeine absorption mainly occurs in the small intestine, where bacterial overgrowth in PD is associated with levodopa malabsorption leading to motor fluctuations.31,38 Therefore, further studies should ascertain whether caffeine absorption in PD is altered by this.
We observed lower caffeine levels in patients with PD with motor fluctuations. Caffeine inhibits A2A-R activation,39 and PD motor symptoms improve with caffeine treatment.8 Istradefylline is a therapeutic agent for PD, acting via A2A-R inhibition40 and maintaining high caffeine serum concentrations, which may serve as a prophylaxis for motor fluctuations. In this study, patients with PD with motor fluctuations had lower levels of caffeine than those without, consistent with the beneficial effects of A2A antagonism. Also, considering disease severity differences between patients with PD with and without motor fluctuations, lower levels of caffeine in patients with PD may result in greater disease progression.
A limitation of this study is that it was conducted at a single university hospital and severe PD cases (H&Y IV and V) were not fully represented due to the history of aspiration pneumonia or cancer exclusion criteria. Thus, it is possible that we could not detect an association between disease severity and levels of caffeine and its metabolites due to the reduced power of the cohort. Also, antiparkinsonian medications may competitively influence the metabolism of caffeine. However, at least in our cohort, no correlations between LED and the absolute concentrations of caffeine and its metabolites were detected. Similar to a recent study showing progressive decreases in caffeine metabolites with disease exacerbation,17 de novo PD studies including larger study populations and studies on differential diagnostic values among patients with PD and other parkinsonian patients should be performed.
We identified significantly decreased serum levels of caffeine and its downstream metabolites in patients with PD, suggesting early diagnostic biomarkers for the disease. However, we found no association between caffeine and its metabolites and disease severity, sex, and gene variants. Furthermore, significant decreases in caffeine and metabolites were detected in patients with PD with motor complications and more severe disease symptoms. This further indicates the neuroprotective effects of caffeine.
Glossary
- A2A-R
adenosine 2A receptor
- AUC
area under the curve
- CYP1A2
cytochrome P450 family 1 subfamily A member 2
- CYP2E1
cytochrome P450 family 2 subfamily E member 1
- ExAC
Exome Aggregation Consortium
- H&Y
Hoehn & Yahr
- LC-MS
liquid chromatography–mass spectrometry
- LED
levodopa equivalent dose
- MIBG
123I-metaiodobenzylguanidine
- MMSE
Mini-Mental State Examination
- MPTP
1-methyl-4-phenyl-1,2,3,6-tetrahydropyridine
- PD
Parkinson disease
- ROC
receiver operating characteristic
- SIFT
sorting intolerant from tolerant
- SNV
single nucleotide variation
- UPDRS
Unified Parkinson's Disease Rating Scale
Footnotes
Editorial, page 205
Author contributions
Motoki Fujimaki: study concept and design, acquisition of data, analysis and interpretation of data. Shinji Saiki: study concept and design, acquisition of data, analysis and interpretation of data, critical revision of manuscript for intellectual content. Yuanzhe Li: analysis of data. Naoko Kaga: analysis of data. Hikari Taka: analysis of data. Taku Hatano: study concept and design, acquisition of data. Kei-Ichi Ishikawa: acquisition of data. Yutaka Oji, acquisition of data. Akio Mori: acquisition of data. Ayami Okuzumi: acquisition of data. Takahiro Koinuma: acquisition of data. Shin-Ichi Ueno: acquisition of data. Yoko Imamichi: management of data. Takashi Ueno: analysis of data. Yoshiki Miura: analysis of data. Manabu Funayama: analysis of data. Nobutaka Hattori: study concept and design, critical revision of manuscript for intellectual content.
Study funding
Supported by Japan Agency for Medical Research and Development–CREST (N.H.), Ministry of Education, Culture, Sports, Science and Technology–Supported Program for the Strategic Research Foundation at Private Universities 2014–2018 (N.H.), Grant-in-aid for Scientific Research on Priority Area (S.S. 25111007, 25111001), and Grant-in-Aid for Scientific Research (B) (S.S. 15H04843).
Disclosure
M. Fujimaki reports no disclosures relevant to the manuscript. S. Saiki received research grants from Ministry of Education, Culture, Sports, Science and Technology (25111007, 25111001) and Japan Society for the Promotion of Science (JSPS) (15H04843). Y. Li received a grant from JSPS (16K09700). N. Kaga reports no disclosures relevant to the manuscript. H. Taka received a grant from JSPS (16K01834). T. Hatano received a grant from JSPS (16K09675). K. Ishikawa received a grant from JSPS (16K19524). Y. Oji received a grant from JSPS (16H07184). A. Mori, A. Okuzumi, T. Koinuma, and S. Ueno report no disclosures relevant to the manuscript. Y. Imamichi received a research grant from JSPS (16H00625). T. Ueno and Y. Miura report no disclosures relevant to the manuscript. M. Funayama received a grant from JSPS (16K09676). N. Hattori received personal fees from Hisamitsu Pharmaceutical, Dai-Nippon Sumitomo Pharma, Otsuka Pharmaceutical, Novartis Pharma, GlaxoSmithKline, Nippon Boehringer Ingelheim, FP Pharmaceutical, Eisai, Kissei Pharmaceutical, Janssen Pharmaceutical, Nihon Medi-Physics, and Kyowa Hakko-Kirin, outside of this work and received research grants from Japan Agency for Medical Research and Development (CREST, program for Brain Mapping by Integrated Neurotechnologies for Disease Studies (Brain/MINDS)) and JSPS (15H04842). Go to Neurology.org/N for full disclosures.
References
- 1.Postuma RB, Berg D, Stern M, et al. MDS clinical diagnostic criteria for Parkinson's disease. Mov Disord 2015;30:1591–1601. [DOI] [PubMed] [Google Scholar]
- 2.Ascherio A, Zhang SM, Hernan MA, et al. Prospective study of caffeine consumption and risk of Parkinson's disease in men and women. Ann Neurol 2001;50:56–63. [DOI] [PubMed] [Google Scholar]
- 3.Hernan MA, Takkouche B, Caamano-Isorna F, Gestal-Otero JJ. A meta-analysis of coffee drinking, cigarette smoking, and the risk of Parkinson's disease. Ann Neurol 2002;52:276–284. [DOI] [PubMed] [Google Scholar]
- 4.Chen JF, Xu K, Petzer JP, et al. Neuroprotection by caffeine and A(2A) adenosine receptor inactivation in a model of Parkinson's disease. J Neurosci 2001;21:RC143. [DOI] [PMC free article] [PubMed] [Google Scholar]
- 5.Xu K, Xu Y, Brown-Jermyn D, et al. Estrogen prevents neuroprotection by caffeine in the mouse 1-methyl-4-phenyl-1,2,3,6-tetrahydropyridine model of Parkinson's disease. J Neurosci 2006;26:535–541. [DOI] [PMC free article] [PubMed] [Google Scholar]
- 6.Xu K, Xu YH, Chen JF, Schwarzschild MA. Neuroprotection by caffeine: time course and role of its metabolites in the MPTP model of Parkinson's disease. Neuroscience 2010;167:475–481. [DOI] [PMC free article] [PubMed] [Google Scholar]
- 7.Altman RD, Lang AE, Postuma RB. Caffeine in Parkinson's disease: a pilot open-label, dose-escalation study. Mov Disord 2011;26:2427–2431. [DOI] [PubMed] [Google Scholar]
- 8.Postuma RB, Lang AE, Munhoz RP, et al. Caffeine for treatment of Parkinson disease: a randomized controlled trial. Neurology 2012;79:651–658. [DOI] [PMC free article] [PubMed] [Google Scholar]
- 9.Kitagawa M, Houzen H, Tashiro K. Effects of caffeine on the freezing of gait in Parkinson's disease. Mov Disord 2007;22:710–712. [DOI] [PubMed] [Google Scholar]
- 10.Butler MA, Iwasaki M, Guengerich FP, Kadlubar FF. Human cytochrome P-450PA (P-450IA2), the phenacetin O-deethylase, is primarily responsible for the hepatic 3-demethylation of caffeine and N-oxidation of carcinogenic arylamines. Proc Natl Acad Sci USA 1989;86:7696–7700. [DOI] [PMC free article] [PubMed] [Google Scholar]
- 11.Gu L, Gonzalez FJ, Kalow W, Tang BK. Biotransformation of caffeine, paraxanthine, theobromine and theophylline by cDNA-expressed human CYP1A2 and CYP2E1. Pharmacogenetics 1992;2:73–77. [DOI] [PubMed] [Google Scholar]
- 12.Tassaneeyakul W, Birkett DJ, McManus ME, et al. Caffeine metabolism by human hepatic cytochromes P450: contributions of 1A2, 2E1 and 3A isoforms. Biochem Pharmacol 1994;47:1767–1776. [DOI] [PubMed] [Google Scholar]
- 13.Tan EK, Lu ZY, Fook-Chong SM, et al. Exploring an interaction of adenosine A2A receptor variability with coffee and tea intake in Parkinson's disease. Am J Med Genet B Neuropsychiatr Genet 2006;141B:634–636. [DOI] [PubMed] [Google Scholar]
- 14.Facheris MF, Schneider NK, Lesnick TG, et al. Coffee, caffeine-related genes, and Parkinson's disease: a case-control study. Mov Disord 2008;23:2033–2040. [DOI] [PMC free article] [PubMed] [Google Scholar]
- 15.Tan EK, Chua E, Fook-Chong SM, et al. Association between caffeine intake and risk of Parkinson's disease among fast and slow metabolizers. Pharmacogenet Genomics 2007;17:1001–1005. [DOI] [PubMed] [Google Scholar]
- 16.Saiki S, Hatano T, Fujimaki M, et al. Decreased long-chain acylcarnitines from insufficient beta-oxidation as potential early diagnostic markers for Parkinson's disease. Sci Rep 2017;7:7328. [DOI] [PMC free article] [PubMed] [Google Scholar]
- 17.LeWitt PA, Li J, Lu M, Guo L, Auinger P; Parkinson Study Group–DATATOP Investigators. Metabolomic biomarkers as strong correlates of Parkinson disease progression. Neurology 2017;88:862–869. [DOI] [PMC free article] [PubMed] [Google Scholar]
- 18.Hatano T, Saiki S, Okuzumi A, Mohney RP, Hattori N. Identification of novel biomarkers for Parkinson's disease by metabolomic technologies. J Neurol Neurosurg Psychiatry 2016;87:295–301. [DOI] [PubMed] [Google Scholar]
- 19.Tomlinson CL, Stowe R, Patel S, Rick C, Gray R, Clarke CE. Systematic review of levodopa dose equivalency reporting in Parkinson's disease. Mov Disord 2010;25:2649–2653. [DOI] [PubMed] [Google Scholar]
- 20.Ministry of Education, Culture, Sports, Science and Technology (MEXT). Standard Tables of Food Composition in Japan, 5th Revised and Enlarged Edition. Tokyo: MEXT; 2015. [Google Scholar]
- 21.Che B, Wang L, Zhang Z, Zhang Y, Deng Y. Distribution and accumulation of caffeine in rat tissues and its inhibition on semicarbazide-sensitive amine oxidase. Neurotoxicology 2012;33:1248–1253. [DOI] [PubMed] [Google Scholar]
- 22.Kumar P, Henikoff S, Ng PC. Predicting the effects of coding non-synonymous variants on protein function using the SIFT algorithm. Nat Protoc 2009;4:1073–1081. [DOI] [PubMed] [Google Scholar]
- 23.Yoritaka A, Shimo Y, Shimo Y, Inoue Y, Yoshino H, Hattori N. Nonmotor Symptoms in Patients with PARK2 Mutations. Parkinson Dis 2011;2011:473640. [DOI] [PMC free article] [PubMed] [Google Scholar]
- 24.Hajian-Tilaki K. Receiver operating characteristic (ROC) curve analysis for medical diagnostic test evaluation. Caspian J Intern Med 2013;4:627–635. [PMC free article] [PubMed] [Google Scholar]
- 25.Orimo S, Ozawa E, Nakade S, Sugimoto T, Mizusawa H. (123)I-metaiodobenzylguanidine myocardial scintigraphy in Parkinson's disease. J Neurol Neurosurg Psychiatry 1999;67:189–194. [DOI] [PMC free article] [PubMed] [Google Scholar]
- 26.Saiki S, Hirose G, Sakai K, et al. Cardiac 123I-MIBG scintigraphy can assess the disease severity and phenotype of PD. J Neurol Sci 2004;220:105–111. [DOI] [PubMed] [Google Scholar]
- 27.Yamazaki H, Shaw PM, Guengerich FP, Shimada T. Roles of cytochromes P450 1A2 and 3A4 in the oxidation of estradiol and estrone in human liver microsomes. Chem Res Toxicol 1998;11:659–665. [DOI] [PubMed] [Google Scholar]
- 28.Ascherio A, Chen H, Schwarzschild MA, Zhang SM, Colditz GA, Speizer FE. Caffeine, postmenopausal estrogen, and risk of Parkinson's disease. Neurology 2003;60:790–795. [DOI] [PubMed] [Google Scholar]
- 29.Rubinsztein DC, Codogno P, Levine B. Autophagy modulation as a potential therapeutic target for diverse diseases. Nat Rev Drug Discov 2012;11:709–730. [DOI] [PMC free article] [PubMed] [Google Scholar]
- 30.Saiki S, Sasazawa Y, Imamichi Y, et al. Caffeine induces apoptosis by enhancement of autophagy via PI3K/Akt/mTOR/p70S6K inhibition. Autophagy 2011;7:176–187. [DOI] [PMC free article] [PubMed] [Google Scholar]
- 31.Kalow W, Tang BK. The use of caffeine for enzyme assays: a critical appraisal. Clin Pharmacol Ther 1993;53:503–514. [DOI] [PubMed] [Google Scholar]
- 32.Gunes A, Dahl ML. Variation in CYP1A2 activity and its clinical implications: influence of environmental factors and genetic polymorphisms. Pharmacogenomics 2008;9:625–637. [DOI] [PubMed] [Google Scholar]
- 33.Ghotbi R, Christensen M, Roh HK, Ingelman-Sundberg M, Aklillu E, Bertilsson L. Comparisons of CYP1A2 genetic polymorphisms, enzyme activity and the genotype-phenotype relationship in Swedes and Koreans. Eur J Clin Pharmacol 2007;63:537–546. [DOI] [PubMed] [Google Scholar]
- 34.Popat RA, Van Den Eeden SK, Tanner CM, et al. Coffee, ADORA2A, and CYP1A2: the caffeine connection in Parkinson's disease. Eur J Neurol 2011;18:756–765. [DOI] [PMC free article] [PubMed] [Google Scholar]
- 35.Postuma RB, Berg D. Advances in markers of prodromal Parkinson disease. Nat Rev Neurol 2016;12:622–634. [DOI] [PubMed] [Google Scholar]
- 36.Scheperjans F, Aho V, Pereira PA, et al. Gut microbiota are related to Parkinson's disease and clinical phenotype. Mov Disord 2015;30:350–358. [DOI] [PubMed] [Google Scholar]
- 37.Keshavarzian A, Green SJ, Engen PA, et al. Colonic bacterial composition in Parkinson's disease. Mov Disord 2015;30:1351–1360. [DOI] [PubMed] [Google Scholar]
- 38.Fasano A, Bove F, Gabrielli M, et al. The role of small intestinal bacterial overgrowth in Parkinson's disease. Mov Disord 2013;28:1241–1249. [DOI] [PubMed] [Google Scholar]
- 39.Schwarzschild MA, Chen JF, Ascherio A. Caffeinated clues and the promise of adenosine A(2A) antagonists in PD. Neurology 2002;58:1154–1160. [DOI] [PubMed] [Google Scholar]
- 40.Factor S, Mark MH, Watts R, et al. A long-term study of istradefylline in subjects with fluctuating Parkinson's disease. Parkinsonism Relat Disord 2010;16:423–426. [DOI] [PubMed] [Google Scholar]