

Abstract
Purpose
Patients who are diagnosed with stage IV metastatic melanoma have an estimated 5-year relative survival rate of only 17%. Randomized controlled trials of recent US Food and Drug Administration–approved immune checkpoint inhibitors—pembrolizumab (PEM), nivolumab (NIVO), and ipilumumab (IPI)—demonstrate improved patient outcomes, but the optimal treatment sequence in patients with BRAF wild-type metastatic melanoma remains unclear. To inform policy makers about the value of these treatments, we developed a Markov model to compare the cost-effectiveness of different strategies for sequencing novel agents for the treatment of advanced melanoma.
Materials and Methods
We developed Markov models by using a US-payer perspective and lifetime horizon to estimate costs (2016 US$) and quality-adjusted life years (QALYs) for treatment sequences with first-line NIVO, IPI, NIVO + IPI, PEM every 2 weeks, and PEM every 3 weeks. Health states were defined for initial treatment, first and second progression, and death. Rates for drug discontinuation, frequency of adverse events, disease progression, and death obtained from randomized phase III trials were used to determine the likelihood of transition between states. Deterministic and probabilistic sensitivity analyses were conducted to evaluate model uncertainty.
Results
PEM every 3 weeks followed by second-line IPI was both more effective and less costly than dacarbazine followed by IPI then NIVO, or IPI followed by NIVO. Compared with the first-line dacarbazine treatment strategy, NIVO followed by IPI produced an incremental cost effectiveness ratio of $90,871/QALY, and first-line NIVO + IPI followed by carboplatin plus paclitaxel chemotherapy produced an incremental cost effectiveness ratio of $198,867/QALY.
Conclusion
For patients with treatment-naive BRAF wild-type advanced melanoma, first-line PEM every 3 weeks followed by second-line IPI or first-line NIVO followed by second-line IPI are the most cost-effective, immune-based treatment strategies for metastatic melanoma.
INTRODUCTION
Melanoma is the fifth most common cancer in the United States, with more than 75,000 new cases and 10,000 deaths annually.1 Metastatic melanoma is an aggressive disease and carries a poor prognosis; five-year relative survival rates for local and metastatic melanoma are 98% and 17%, respectively.2-4 Approximately 40% to 60% of melanomas contain a mutation in the BRAF proto-oncogene, which leads to constitutive activation of downstream signaling in the mitogen-activated protein kinase pathway.5,6
Dacarbazine, once the mainstay chemotherapeutic agent for the treatment of metastatic disease, has been replaced by recent US Food and Drug Administration (FDA)–approved immune checkpoint inhibitors, which have demonstrated significant survival improvement —ipilimumab (IPI; FDA approval in 2011), pembrolizumab (PEM; FDA approval in 2014), and nivolumab (NIVO; FDA approval in 2014). IPI, a first-in-class recombinant human IgG1 monoclonal antibody, binds to cytotoxic T-lymphocyte associated antigen-4, which allows for enhanced T-cell activation and proliferation.7 A phase III trial(clinical trial information: NCT00094653) evaluated first-line IPI for the treatment of patients with advanced melanoma; a statistically significant improvement in median overall survival (OS) among patients who were treated with IPI compared with dacarbazine resulted in 5-year survival rates of 18.2% versus 8.8%, respectively.8 NIVO and PEM are IgG4κ anti–programmed death protein-1 (anti–PD-1) monoclonal antibodies. Multiple phase III trials have evaluated their efficacy in patients with advanced melanoma: NIVO versus first-line dacarbazine in CheckMate-0669; first-line NIVO alone, combination NIVO + IPI, or IPI alone in Checkmate-06710; second-line NIVO versus chemotherapy in CheckMate-03711; first-line PEM at two dosing schedules compared with first-line IPI in KEYNOTE-00612; and second-line IPI versus palliative care.8-12
Although immune checkpoint inhibitors have clearly improved outcomes in patients with metastatic disease, they are associated with adverse events (AEs) and significant cost. In our current health care environment, policy makers, providers, and patients alike need sound evidence as a framework for determining the value of different therapeutic alternatives in oncology. As such, we sought to evaluate the cost-effectiveness of currently available therapies for patients with BRAF wild-type advanced melanoma by using recently reported phase III trial data.
MATERIALS AND METHODS
Model Overview
A comprehensive Markov model was developed to analyze the cost-effectiveness of BRAF wild-type advanced melanoma management from a US payer perspective (Fig 1 and Appendix Fig A1, online only). We modeled a hypothetical cohort of patients with advanced melanoma with the same characteristics as those patients enrolled in CheckMate-066, CheckMate-067, CheckMate-037, KEYNOTE-006, and NCT00094653.8-12 Our assumptions describing progression-free survival (PFS) and OS treatment benefits were based on survival curves from these phase III trials. The model evaluated six treatment options: first-line NIVO followed by second-line IPI; first-line NIVO + IPI followed by second-line carboplatin and paclitaxel;10 first-line PEM every 2 weeks followed by second-line IPI; first-line PEM every 3 weeks followed by second-line IPI; first-line IPI followed by second-line NIVO; and first-line dacarbazine followed by second-line IPI and third-line NIVO. After initial therapy, patients could experience a response and continue therapy—either with or without grade 3 or 4 nonimmune AEs or immune-related AEs (irAEs)—or experience progressive disease (PD) and switch to second-line treatment. Patients on second-line, or third-line, therapy could experience treatment response or PD, the latter of which would result in a cessation of therapy and the commencement of palliative care and death. During any line of treatment, patients could end current therapy as a result of PD or grade 3 or 4 AEs observed in the associated clinical trials.
Fig 1.

Markov model depicting the treatment arms seen in CheckMate-066, CheckMate-067, CheckMate-037, KEYNOTE-006, and NCT00094653.
Model outcomes include treatment costs (in 2016 US$) and quality-adjusted life years (QALYs). We calculated the incremental cost-effectiveness ratios (ICERs)—the difference in costs divided by the difference in QALYs—to compare two treatment strategies. Examining the results in this way, first-line pembrolizumab administered every 3 weeks followed by second-line ipilimumab proved to be the dominant treatment. All costs and health outcomes were discounted by 3% annually.13 The model was programmed by using the decision analytic software TreeAge Pro 2016 (TreeAge Software, Williamstown, MA).
Model Transitions and Survival Estimates
The model simulated transitions between health states with a cycle length of 6 weeks, which was chosen to match the time interval between patient status assessments in the clinical trials. Our model considered changes in quality-adjusted survival as a result of grade 1 and 2 or 3 and 4 AEs, and irAEs. Patients transitioned between health states on the basis of calculated transition probabilities from PFS, OS, and discontinuation rates from phase III trials associated with the respective treatments. Engauge Digitizer software was used to extract data points from the curves; these data points were then used to fit parametric survival models.14 Survival distributions were tested for goodness-of-fit for all curves,15,16 and we used a Weibull distribution to model survival because it can have an increasing hazard rate and is suitable for modeling events that occur early during follow-up periods. Patients who achieved a response who were in the grade 3 and 4 AEs or irAE state accumulated benefits and costs—similar to patients who achieved response, but without the grade 3 and 4 AE or irAE health state—and only transitioned to the PD health state upon documented disease progression (determined by immune response criteria)17 and the respective clinical trial data. With the exception of the dacarbazine arm, which included a third-line option, patients who experienced PD after second-line therapy subsequently exited the model. The probability of transitioning to death during each cycle was defined as the maximum value of observed mortality rate by using survival data from each trial and the other-cause (background) mortality rate. Other-cause mortality for each age group was estimated from US life tables.18
Utilities and Costs
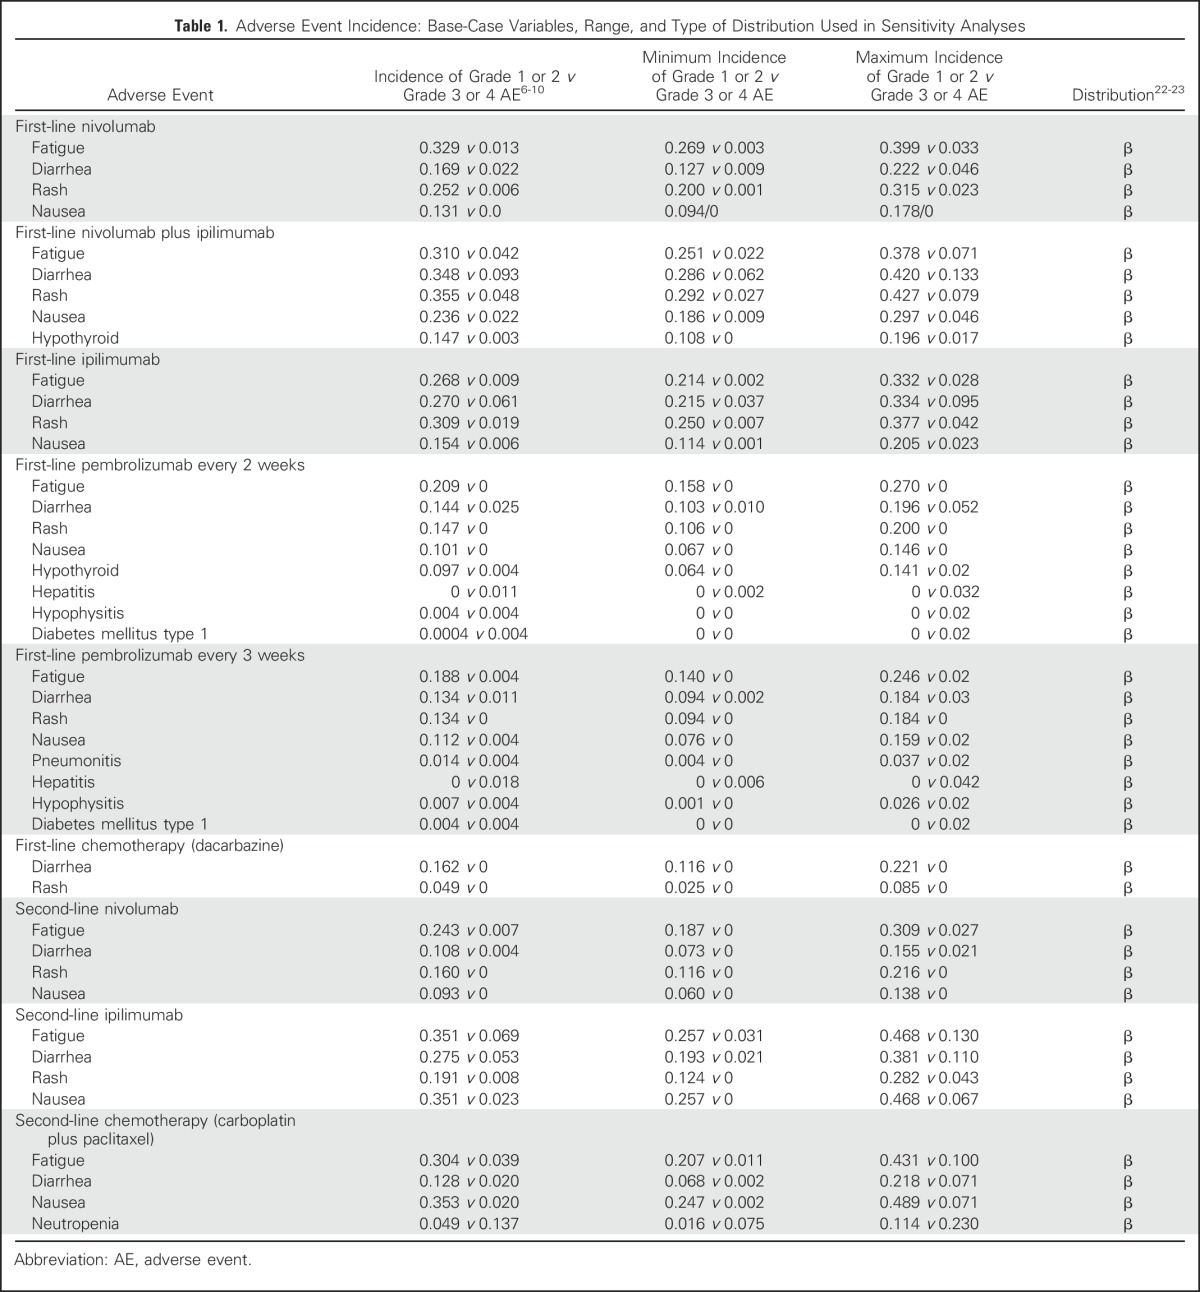
QALYs were calculated by multiplying the time spent in a given state (in life-years) by the utility score (a health status value from 0 for death to 1 for perfect health) associated with that state.19 The utility weights of all health states and AEs were derived from published studies.20,21 We assigned a utility of 0.80 for all patients in first-line therapy, 0.88 for patients who achieved complete or partial treatment response, and 0.52 for PD (Appendix Table A1, online only). The model considered both grade 1 or 2 and 3 or 4 nonimmune and irAEs as measured by temporary health utility decrements as well as increased treatment-related costs (Table 1 and Appendix Table A2, online only).
Table 1.
Adverse Event Incidence: Base-Case Variables, Range, and Type of Distribution Used in Sensitivity Analyses
Direct medical costs considered were as follows: physician visits, hospitalization costs, drug acquisition costs, drug infusion costs, laboratory tests (inpatient and/or outpatient), radiographic tests (inpatient and/or outpatient), and hospital encounters (Table 2). In addition, we included treatment costs for nonimmune and irAEs from each trial (Appendix Table A2). We used reimbursement rates provided by the Centers for Medicare & Medicaid Services (CMS), the largest public payer in the United States, which are generally lower than reimbursement rates for private insurers.26 To estimate the unit price of each drug, we used average sales price data from CMS25; the average sales price of oral medications not listed in CMS were derived from the Medicare plan finder online tool.27,28 Medication costs were calculated by using a base-case patient with a height of 165 cm and weight of 70 kg, with a subsequent body surface area of 1.79 m2.29
Table 2.
Direct Medical Costs: Base-Case Variables, Range, and Type of Distribution Used in Sensitivity Analyses
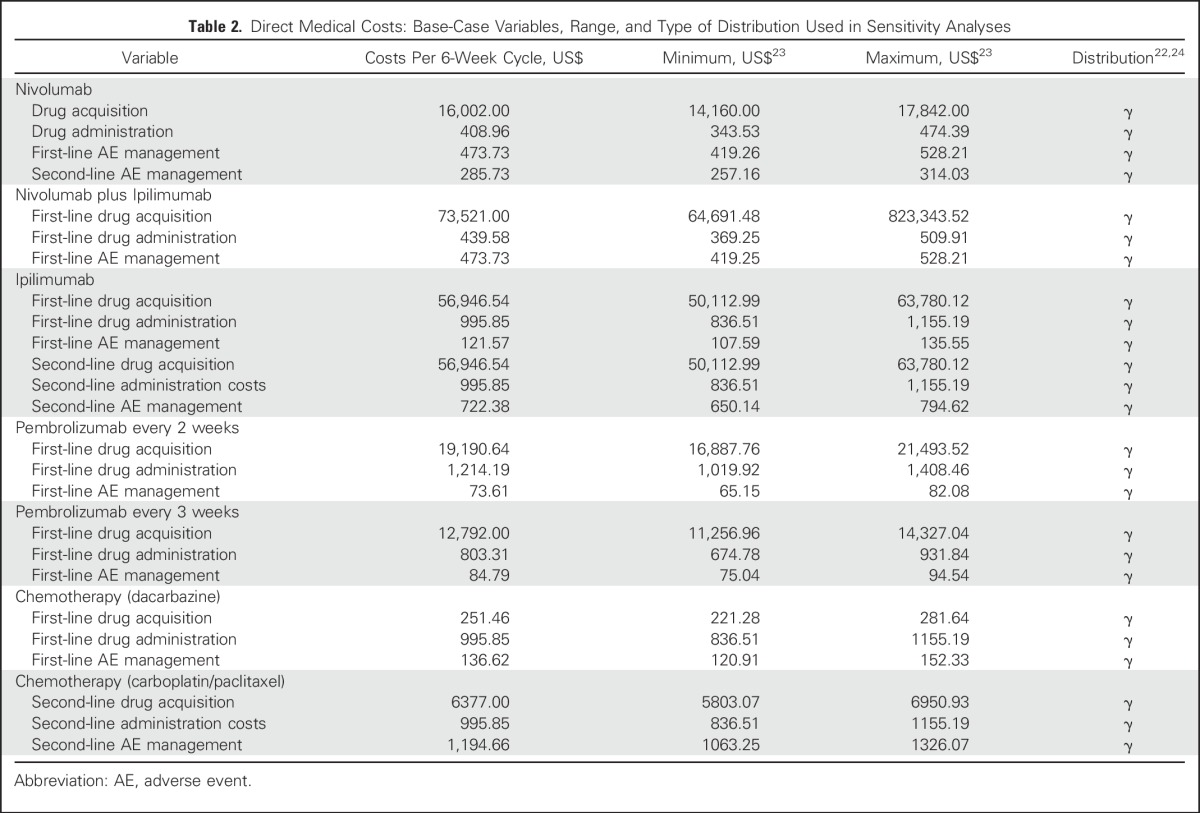
Cost of hospitalization included inpatient physician service fees and hospital reimbursement on the basis of the length of stay diagnosis-related group code corresponding to the AE. For each treatment strategy, the cost of each AE was obtained by multiplying the incidence of the AE by its associated unit cost. Management of AEs were based on published guidelines, and AE costs were calculated by using the Medicare physician fee schedule.30 Fees for outpatient physician visits were based on their health care procedure coding system and/or their current procedure terminology code using validated methods.31
Sensitivity Analysis
To evaluate the robustness of the model and address the uncertainty in estimates of variables, we performed a series of sensitivity analyses. AEs and utilities were varied over their 95% CIs. Drug costs were varied within ± 20% of their baseline values, in accordance with established approaches.32-34 In univariable sensitivity analyses, we varied the value of one parameter at a time over its defined range and examined the effect of each parameter individually on ICERs for all variables in Tables 1 and 2 and Appendix Tables A1 to A3 (online only).
To account for variation in multiple parameters at once, we also completed probabilistic sensitivity analyses; we performed 10,000 Monte Carlo simulations, each time randomly sampling from the distributions for all parameters simultaneously. We followed recommended distributions on the basis of parameter types, and assumed γ-distribution for costs and β-distribution for the incidence of AEs and utility values35,36 (Tables 1 and 2 and Appendix Tables A1 to A3). To illustrate the uncertainty surrounding our base-case estimate of cost-effectiveness, cost-effectiveness acceptability curves were derived and used to project the probability that each treatment strategy was the most cost-effective under various willingness-to-pay (WTP) thresholds.
RESULTS
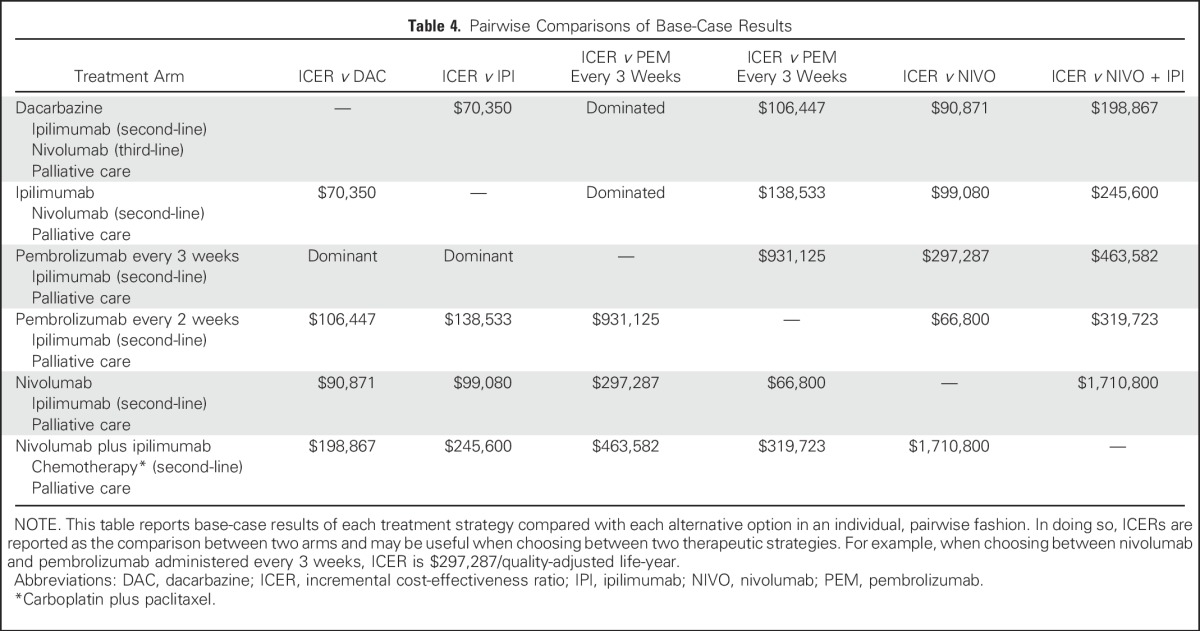
The base-case cost and effectiveness of each treatment sequence, as well as individual therapy choices for first-, second-, and third-line therapy, are listed in Table 3. Examining all treatment strategies incrementally, first-line PEM every 3 weeks followed by second-line IPI was less costly and more effective than treatment sequences that involved first-line IPI, first-line dacarbazine, and first-line PEM every 2 weeks (Appendix Fig A2, online only). Compared with the treatment strategy with PEM every 3 weeks, first-line NIVO was associated with incremental costs and benefits of $44,593 and 0.16 QALYs, respectively (ICER = $278,706/QALY), whereas first-line NIVO + IPI was the least cost-effective strategy and was associated with an additional $78,809 in costs and benefits of 0.18 QALYs. In addition, ICERs for each pairwise comparison are listed in Table 4 as a way to understand individual choices between two competing treatment strategies.
Table 3.
Base-Case Results
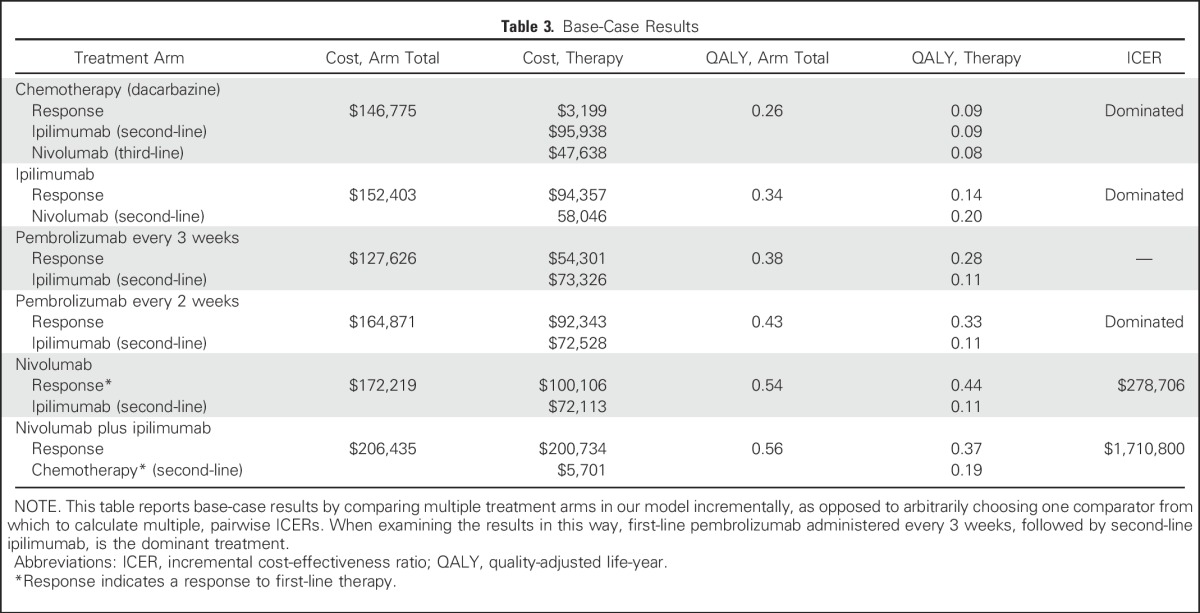
Table 4.
Pairwise Comparisons of Base-Case Results
One-way sensitivity analyses demonstrated that differences in drug cost, discontinuation rates, and increased disutility associated with IPI were the most influential factors within the model (Appendix Figs A3 and A4, online only). Results of the probabilistic sensitivity analysis are shown in Fig 2. First-line PEM every 3 weeks was the most cost-effective treatment with a probability of remaining cost-effective of 69% of sampled parameters, using a WTP of $100,000/QALY.
Fig 2.

Cost-effectiveness acceptability curve. Results of the probabilistic sensitivity analysis on the basis of 10,000 iterations of the model, which drew parameters for each input simultaneously from probability distributions to indicate uncertainty about whether the treatment sequences are cost-effective given different willingness-to-pay thresholds. A count is obtained of the proportion of simulated incremental cost-effectiveness ratio values that are acceptable at each willingness-to-pay threshold, which is shown on the y-axis. For example, pembrolizumab administered every 3 weeks was found to be cost-effective in 69% of simulations at a willingness-to-pay threshold of $100,000. IPI, ipilimumab; NIVO, nivolumab; PEM, pembrolizumab.
DISCUSSION
After the results of CheckMate-066, the FDA approved combination NIVO + IPI for patients with treatment-naïve BRAF wild-type advanced melanoma, and this combination became a new standard-of-care for fit, newly diagnosed patients with advanced melanoma.9,37 More than 20 years ago, US patients with advanced melanoma had medical costs of $249 million per year and per-patient lifetime costs (time-of-diagnosis to death) of $28,210.24,38 In the past several years, annual health care costs are estimated at > $600 million, with per-patient lifetime costs of approximately $200,000.22,23,39-41 This dramatic increase has been attributed to higher costs related to drug acquisition, diagnosis and treatment of brain metastases, and end-of-life care, as well as managing irAEs, which are unique to these newer immunotherapeutic agents.42,43 Unlike the National Institute for Health and Care Excellence, the FDA does not take into account cost-effectiveness when making decisions regarding drug approvals, and once approved, CMS is prohibited from considering cost-effectiveness in reimbursement and coverage decision-making.44 Whereas definitions of cost-effectiveness vary, an ICER of ≤ $150,000 per QALY averted or less than three times the annual gross domestic product per capita44,45 are commonly used thresholds to determine cost-effectiveness of therapy. Results of recent cost-effectiveness analyses in advanced melanoma have been mixed.46-49 Although immune-based therapy significantly improves outcomes in patients with advanced BRAF wild-type melanoma, the optimal sequence and/or combination of immune-based therapies remains unclear from a value standpoint.
To our knowledge, our model provides the most comprehensive assessment to date that compares different treatment strategies for patients with BRAF wild-type advanced melanoma; our model also demonstrates that treatment with a first-line PD-1 inhibitor followed by second-line IPI seems to be the most effective and cost-effective strategy. These options (NIVO and PEM every 3 weeks) fall below a WTP of $150,000/QALY and the National Institute for Health and Care Excellence standard.44 Indeed, first-line PEM every 3 weeks is more cost-effective than even first-line dacarbazine, despite the large difference in drug acquisition cost. In contrast, combination NIVO + IPI does not seem to be a cost-effective first-line strategy; substantial price reductions are needed to make this a viable option. In our model, sequential therapy, compared with combination therapy, allowed IPI to be used as an efficacious treatment option for second-line use and was also associated with improved patient quality of life, fewer serious AEs that required prolonged hospitalizations and costly treatment interventions, and a lower rate of permanent drug discontinuation.
The most influential factors driving our model were the drug acquisition cost of first-line IPI and the cost of managing irAEs. Despite only providing 0.31 QALYs in the first-line setting, IPI was associated with a drug acquisition cost more than that of PEM and NIVO combined, both of which provided higher QALYs in the first-line setting. This was surprising given that patients who were treated with IPI received a fixed number of doses (four) compared with indefinite dosing of anti–PD-1 therapy. In addition, our model accounted for the high discontinuation rate and subsequently reduced number of doses among those patients receiving first-line IPI (monotherapy [14%] or combination therapy [37%]). High first-line IPI costs were likely a result of a relatively large percentage of patients receiving first-line IPI who developed grade 3 and 4 AEs or irAEs, which are associated with lengthy hospitalizations, diagnostic imaging, and prolonged treatment course.43,50 Sensitivity analysis also highlighted the importance of receiving anti–PD-1 therapy in the first-line setting, as opposed to later lines of treatments, and suggested that a particular opportunity for maximizing the effectiveness of these agents may exist in the first-line setting. This was most evident with NIVO, which provided 0.44 QALYs in the first-line setting, but only 0.20 QALYs in the second-line setting. This difference highlights the precipitous decline in treatment efficacy, or perhaps more likely, the decreased relative fitness of patients and decreased tolerance to second-line and third-line therapy. When comparing the different immune checkpoint inhibitors and dosing schedules in the first-line setting, QALYs were comparable but drug acquisition costs were quite different, which suggests that treatment dose and/or schedule may not be as important as merely receiving therapy that provides negative regulation of the immune checkpoint blockade. In other words, the noninferiority of PEM 2 mg/kg versus 10 mg/kg; PEM every 2 weeks versus PEM every 3 weeks; IPI for four cycles versus two cycles as a result of serious AEs, prompting drug discontinuation; and NIVO versus NIVO + IPI, which implies that initial therapy with an immune checkpoint inhibitor is more fundamental than the specific, chosen agent.
Our model relied on commonly used assumptions worth noting. First, administration of PEM (first- and second-line) in our model was the same dose that received accelerated FDA approval. This was based on PEM’s breakthrough activity in a phase II trial with IPI-refractory disease49; although not powered to detect a difference, patients in KEYNOTE-002 were randomly assigned to 2 mg/kg versus 10 mg/kg dosing, with comparable activity and considerably fewer grade 3 and 4 AEs or irAEs at the lower dose. In the KEYNOTE-006 trial used in our model, the higher dose of PEM was used for both dosing schedules and was associated with more serious irAEs than those observed with the lower dose.12,51 Ongoing clinical trials of PEM use a fixed dosing schema instead of weight-based dosing.52 A similar approach was taken with first- and second-line IPI, where the dose varied from trial to trial. Whereas low-dose IPI (3 mg/kg) is FDA-approved for use in advanced melanoma,9 the higher 10 mg/kg dose used in some of the clinical trials was associated with more grade 3 and 4 irAEs; 10 mg/kg is currently FDA-approved for adjuvant use in patients with high-risk stage III melanoma to decrease the risk of recurrence.53
Our study had some limitations that merit discussion. As with many cost-effectiveness studies, our model was based on data from previously published trials and not data that were prospectively collected; however, a benefit of this approach is that, by using national averages for costs, we accounted for regional variations in our estimates. Our analysis was also limited by data availability, particularly with regard to published survival data.54 There were differences in treatment and patients characteristics (ie, BRAF status) across clinical trials that may have influenced model parameters. Second, health utility estimates in this model, although used in previously published melanoma economic models, may not accurately reflect the hypothetical population used in the current analysis. An updated health utility measure for patients with advanced melanoma in populations with targeted and immune-based therapy might improve accuracy and robustness. Third, although we attempted to account for the most common clinical scenarios and most accurately emulate clinical practice, it is likely we did not account for all possible scenarios. For example, in clinical practice, the increase in size of cancer on radiographic imaging does not necessarily indicate PD or require immediate second-line therapy; however, this was likely minimized in our model, as most trials used immune response criteria, as opposed to the commonly used Response Evaluation Criteria in Solid Tumors (RECIST) criteria, which is typically used to gauge solid tumor treatment response. RECIST fails to account for delayed responses and the pseudoprogression phenomenon, both of which are commonly encountered when evaluating radiographic imaging of patients who were treated with immune-based therapy.54,55
Finally, our analysis did not incorporate programmed death-ligand 1 (PD-L1) status and testing, primarily because of the paucity of data. Of the included phase III trials, only Checkmate-06710 reported secondary end points (PFS and objective response) that showed a significant benefit for combination IPI plus NIVO versus single-agent NIVO in PD-L1–negative, not PD-L1–positive, patients in a subgroup analysis. In addition to the issue of statistical power, PD-L1 testing is not currently standardized and the optimal cutoff for PD-L1 is still unclear. As the field grows, future cost-effectiveness analyses should incorporate PD-L1 status into the decision-making process.
Despite these limitations, our model has many strengths. We accounted for the high rate of patients who discontinued treatment as a result of toxicity but who continued to maintain a response, a feature that is unique to immunotherapy. We accounted for all treatment-related costs from a CMS perspective, including grade 1 to 4 AEs or irAEs. Finally, our model incorporated different therapeutic sequences, rather than a comparison of two treatments, and this emulates routine clinical practice of systemic chemotherapy and immunotherapy delivery.
The current cost-effectiveness analysis should be included in the decision-making process with additional efficacy data (and individual patient data) to make recommendations regarding the sequencing of therapy for patients with BRAF wild-type advanced melanoma.
In conclusion, among treatment-naïve patients with BRAF wild-type advanced melanoma, a single-agent first-line PD-1 inhibitor followed by second-line IPI was the most cost-effective strategy. The first-line treatment approach of NIVO + IPI, followed by second-line chemotherapy, was not found to be cost-effective on the basis of currently accepted WTP thresholds. In these patients, treatment strategy with sequential, single-agent immune checkpoint inhibition, compared with concurrent therapy, seems to be significantly more cost-effective, while also producing a comparable degree of tumor reduction and improved patient survival.
Appendix
Fig A1.

Markov model depicting the treatment arms seen in CheckMate-066, CheckMate-067, CheckMate-037, KEYNOTE-006, and NCT00094653. (a) First-line progression-free survival; (b) first-line overall survival; (c) progression-free survival after first progression; (d) overall survival after first progression; (e) overall survival after second progression; (f) progression-free survival after second progression; (g) progression-free survival after third progression; (h) overall survival after third progression; and (i) drug discontinuation rate. AE, adverse event.
Fig A2.

Base-case cost-effectiveness results. Treatment strategy with first-line dacarbazine (followed by second-line ipilimumab and third-line nivolumab; blue diamond); treatment strategy with first-line ipilimumab (followed by second-line nivolumab; gold square); first-line nivolumab followed by second-line ipilimumab (blue star); first-line nivolumab plus ipilimumab followed by second-line carboplatin and paclitaxel (dark gold circle); treatment strategy with first-line pembrolizumab administered every 2 weeks followed by second-line ipilimumab (red x); treatment strategy with first-line pembrolizumab administered every 3 weeks followed by second-line ipilimumab (gray triangle). DAC, dacarbazine; IPI, ipilimumab; NIVO, nivolumab; PEM, pembrolizumab; QALY, quality-adjusted life-year.
Fig A3.

Univariable sensitivity analyses: Pembrolizumab every 2 weeks versus ipilumumab. DC, dacarbazine; IPI, ipilimumab; NIVO, nivolumab; PEM, pembrolizumab; PFS, progression-free survival.
Fig A4.

Univariable sensitivity analyses: Nivolumab versus ipilumumab. DC, dacarbazine; IPI, ipilimumab; NIVO, nivolumab.
Table A1.
Health State Utility Values: Base-Case Variables, Range, and Type of Distribution Used in Sensitivity Analyses
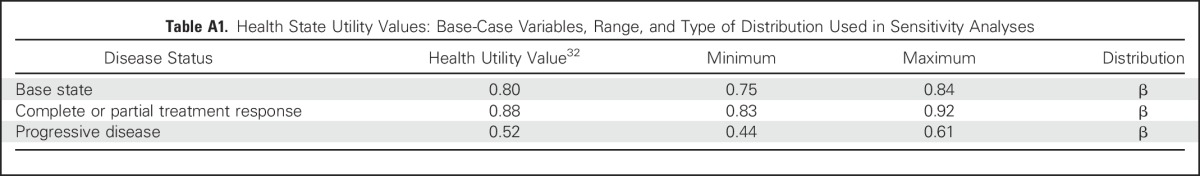
Table A2.
Adverse Event Disutility and Costs: Base-Case Variables, Range, and Type of Distribution Used in Sensitivity Analyses
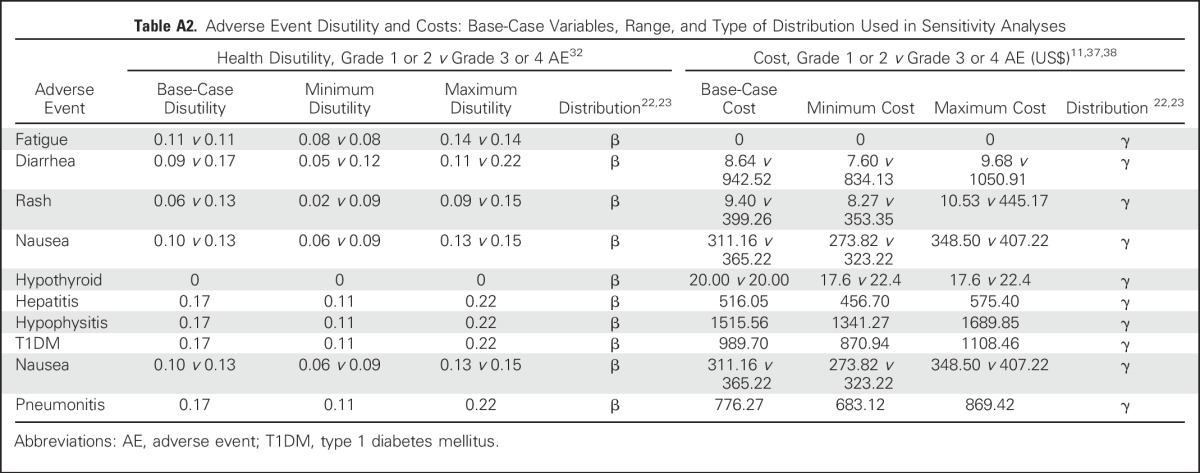
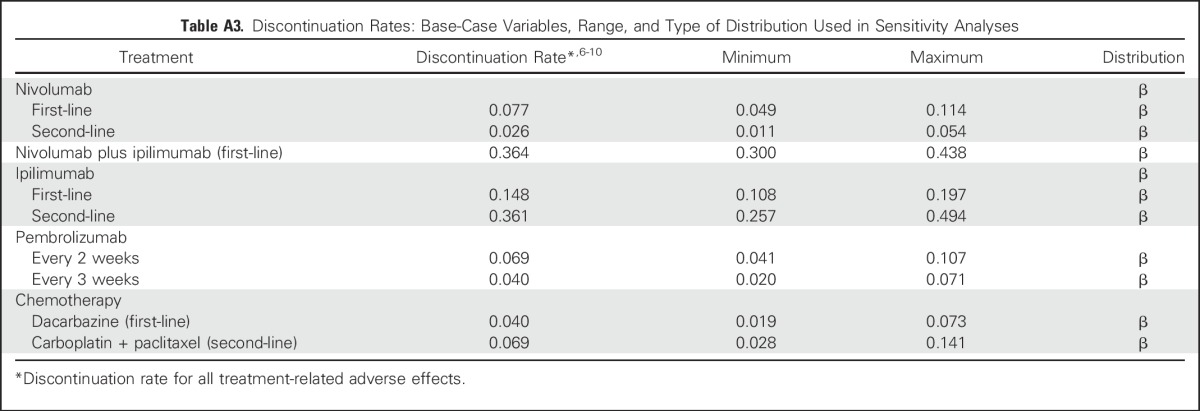
Table A3.
Discontinuation Rates: Base-Case Variables, Range, and Type of Distribution Used in Sensitivity Analyses
Footnotes
Supported by National Cancer Institute Grant No. K24CA208132 and an Innovation in Regulatory Science Award from the Burroughs Wellcome Fund (to C.R.F.).
The content is solely the responsibility of the authors and does not necessarily represent the official views of the National Institutes of Health.
AUTHOR CONTRIBUTIONS
Conception and design: Christine G. Kohn, Simon B. Zeichner, Alberto J. Montero, Daniel A. Goldstein, Christopher R. Flowers
Financial support: Christopher R. Flowers
Administrative support: Christine G. Kohn, Christopher R. Flowers
Provision of study materials or patients: Christine G. Kohn, Simon B. Zeichner
Collection and assembly of data: Christine G. Kohn, Simon B. Zeichner, Alberto J. Montero, Christopher R. Flowers
Data analysis and interpretation: Christine G. Kohn, Simon B. Zeichner, Qiushi Chen, Alberto J. Montero, Christopher R. Flowers
Manuscript writing: All authors
Final approval of manuscript: All authors
Accountable for all aspects of the work: All authors
AUTHORS' DISCLOSURES OF POTENTIAL CONFLICTS OF INTEREST
Cost-Effectiveness of Immune Checkpoint Inhibition in BRAF Wild-Type Advanced Melanoma
The following represents disclosure information provided by authors of this manuscript. All relationships are considered compensated. Relationships are self-held unless noted. I = Immediate Family Member, Inst = My Institution. Relationships may not relate to the subject matter of this manuscript. For more information about ASCO's conflict of interest policy, please refer to www.asco.org/rwc or ascopubs.org/jco/site/ifc.
Christine G. Kohn
No relationship to disclose
Simon B. Zeichner
No relationship to disclose
Qiushi Chen
No relationship to disclose
Alberto J. Montero
Stock or Other Ownership: Johnson & Johnson
Honoraria: Celgene
Consulting or Advisory Role: New Century Health
Daniel A. Goldstein
No relationship to disclose
Christopher R. Flowers
Consulting or Advisory Role: OptumRxSeattle Genetics, Bayer, Gilead Sciences
Research Funding: Acerta Pharma (Inst), Infinity Pharmaceuticals (Inst), Onyx Pharmaceuticals (Inst), Janssen Oncology (Inst), Gilead Sciences (Inst), Celgene (Inst), TG Therapeutics (Inst), Genentech (Inst), Pharmacyclics (Inst), AbbVie (Inst)
Travel, Accommodations, Expenses: Celgene, Genentech
REFERENCES
- 1.Siegel RL, Miller KD, Jemal A. Cancer statistics, 2016. CA Cancer J Clin. 2016;66:7–30. doi: 10.3322/caac.21332. [DOI] [PubMed] [Google Scholar]
- 2.American Cancer Society Cancer treatment & survivorship facts & figures 2016-2017. http://www.cancer.org/acs/groups/content/@research/documents/document/acspc-048074.pdf
- 3.Howlader N, Noone AM, Krapcho M, et al. SEER cancer statistics review, 1975–2012. http://seer.cancer.gov/csr/1975_2010/
- 4.Long GV, Menzies AM, Nagrial AM, et al. Prognostic and clinicopathologic associations of oncogenic BRAF in metastatic melanoma. J Clin Oncol. 2011;29:1239–1246. doi: 10.1200/JCO.2010.32.4327. [DOI] [PubMed] [Google Scholar]
- 5.Davies H, Bignell GR, Cox C, et al. Mutations of the BRAF gene in human cancer. Nature. 2002;417:949–954. doi: 10.1038/nature00766. [DOI] [PubMed] [Google Scholar]
- 6.Curtin JA, Fridlyand J, Kageshita T, et al. Distinct sets of genetic alterations in melanoma. N Engl J Med. 2005;353:2135–2147. doi: 10.1056/NEJMoa050092. [DOI] [PubMed] [Google Scholar]
- 7.Blank C, Brown I, Peterson AC, et al. PD-L1/B7H-1 inhibits the effector phase of tumor rejection by T cell receptor (TCR) transgenic CD8+ T cells. Cancer Res. 2004;64:1140–1145. doi: 10.1158/0008-5472.can-03-3259. [DOI] [PubMed] [Google Scholar]
- 8.Maio M, Grob JJ, Aamdal S, et al. Five-year survival rates for treatment-naive patients with advanced melanoma who received ipilimumab plus dacarbazine in a phase III trial. J Clin Oncol. 2015;33:1191–1196. doi: 10.1200/JCO.2014.56.6018. [DOI] [PMC free article] [PubMed] [Google Scholar]
- 9.Robert C, Long G V, Brady B, et al. Nivolumab in previously untreated melanoma without BRAF mutation. N Engl J Med. 2015;372:320–330. doi: 10.1056/NEJMoa1412082. [DOI] [PubMed] [Google Scholar]
- 10.Larkin J, Chiarion-Sileni V, Gonzalez R, et al. Combined nivolumab and ipilimumab or monotherapy in untreated melanoma. N Engl J Med. 2015;373:23–34. doi: 10.1056/NEJMoa1504030. [DOI] [PMC free article] [PubMed] [Google Scholar]
- 11.Weber JS, D’Angelo SP, Minor D, et al. Nivolumab versus chemotherapy in patients with advanced melanoma who progressed after anti-CTLA-4 treatment (CheckMate 037): A randomised, controlled, open-label, phase 3 trial. Lancet Oncol. 2015;16:375–384. doi: 10.1016/S1470-2045(15)70076-8. [DOI] [PubMed] [Google Scholar]
- 12.Robert C, Schachter J, Long GV, et al. Pembrolizumab versus ipilimumab in advanced melanoma. N Engl J Med. 2015;372:2521–2532. doi: 10.1056/NEJMoa1503093. [DOI] [PubMed] [Google Scholar]
- 13.Drummond MF, Sculpher MJ, Torrance GW, et al. Methods for the Economic Evaluation of Health Care Programmes. New York, NY: Oxford University Press; 2005. [Google Scholar]
- 14.Hoyle MW, Henley W. Improved curve fits to summary survival data: Application to economic evaluation of health technologies. BMC Med Res Methodol. 2011;11:139. doi: 10.1186/1471-2288-11-139. [DOI] [PMC free article] [PubMed] [Google Scholar]
- 15.Posada D, Buckley TR. Model selection and model averaging in phylogenetics: Advantages of akaike information criterion and bayesian approaches over likelihood ratio tests. Syst Biol. 2004;53:793–808. doi: 10.1080/10635150490522304. [DOI] [PubMed] [Google Scholar]
- 16.Auget J-L, Balakrishnan N, Mesbah M, et al., editors. Advances in Statistical Methods for the Health Sciences: Applications to Cancer and AIDS Studies, Genome Sequence Analysis, and Survival Analysis. Boston, MA: Birkhäuser; 2007. [Google Scholar]
- 17.Wolchok JD, Hoos A, O’Day S, et al. Guidelines for the evaluation of immune therapy activity in solid tumors: Immune-related response criteria. Clin Cancer Res. 2009;15:7412–7420. doi: 10.1158/1078-0432.CCR-09-1624. [DOI] [PubMed] [Google Scholar]
- 18.Arias E. National vital statistics reports: United States life tables, 2011. http://www.cdc.gov/nchs/data/nvsr/nvsr64/nvsr64_11.pdf [PubMed]
- 19.Gold MR, Siegel JE, Russell LB, et al., editors. Cost-Effectiveness in Health and Medicine. New York, NY: Oxford University Press; 1996. [Google Scholar]
- 20.Beusterien KM, Szabo SM, Kotapati S, et al. Societal preference values for advanced melanoma health states in the United Kingdom and Australia. Br J Cancer. 2009;101:387–389. doi: 10.1038/sj.bjc.6605187. [DOI] [PMC free article] [PubMed] [Google Scholar]
- 21.Hatswell AJ, Pennington B, Pericleous L, et al. Patient-reported utilities in advanced or metastatic melanoma, including analysis of utilities by time to death. Health Qual Life Outcomes. 2014;12:140. doi: 10.1186/s12955-014-0140-1. [DOI] [PMC free article] [PubMed] [Google Scholar]
- 22.Chang C-L, Schabert VF, Munakata J, et al. Comparative healthcare costs in patients with metastatic melanoma in the USA. Melanoma Res. 2015;25:312–320. doi: 10.1097/CMR.0000000000000159. [DOI] [PubMed] [Google Scholar]
- 23.Reyes C, DaCosta Byfield S, Linke R, et al. The burden of metastatic melanoma: Treatment patterns, healthcare use (utilization), and costs. Melanoma Res. 2013;23:159–166. doi: 10.1097/CMR.0b013e32835e58d6. [DOI] [PubMed] [Google Scholar]
- 24.Huo J, Lairson DR, Du XL, et al. Survival and cost-effectiveness of hospice care for metastatic melanoma patients. Am J Manag Care. 2014;20:366–373. [PubMed] [Google Scholar]
- 25.Centers for Medicare & Medicaid Services 2015 ASP drug pricing files. https://www.cms.gov/Medicare/Medicare-Fee-for-Service-Part-B-Drugs/McrPartBDrugAvgSalesPrice/2015ASPFiles.html
- 26.Academy of Managed Care Pharmacy AMCP guide to pharmaceutical payment methods (version 3.0) http://www.amcp.org/WorkArea/DownloadAsset.aspx?id=16476 [PubMed]
- 27.Bach PB. Limits on Medicare’s ability to control rising spending on cancer drugs. N Engl J Med. 2009;360:626–633. doi: 10.1056/NEJMhpr0807774. [DOI] [PubMed] [Google Scholar]
- 28.Centers for Medicare & Medicaid Services Medicare plan finder. https://www.medicare.gov/find-a-plan/questions/home.aspx
- 29.Mosteller RD. Simplified calculation of body-surface area. N Engl J Med. 1987;317:1098. doi: 10.1056/NEJM198710223171717. [DOI] [PubMed] [Google Scholar]
- 30.Centers for Medicare & Medicaid Services Medicare physician fee schedule. http://www.cms.gov/apps/physician-fee-schedule/
- 31.Tumeh JW, Moore SG, Shapiro R, et al. Practical approach for using Medicare data to estimate costs for cost-effectiveness analysis. Expert Rev Pharmacoecon Outcomes Res. 2005;5:153–162. doi: 10.1586/14737167.5.2.153. [DOI] [PubMed] [Google Scholar]
- 32.Zhang Y, Baik SH, Fendrick AM, et al. Comparing local and regional variation in health care spending. N Engl J Med. 2012;367:1724–1731. doi: 10.1056/NEJMsa1203980. [DOI] [PMC free article] [PubMed] [Google Scholar]
- 33.Goulart B, Ramsey S. A trial-based assessment of the cost-utility of bevacizumab and chemotherapy versus chemotherapy alone for advanced non-small cell lung cancer. Value Health. 2011;14:836–845. doi: 10.1016/j.jval.2011.04.004. [DOI] [PubMed] [Google Scholar]
- 34.Goldstein DA, Chen Q, Ayer T, et al. First- and second-line bevacizumab in addition to chemotherapy for metastatic colorectal cancer: A United States-based cost-effectiveness analysis. J Clin Oncol. 2015;33:1112–1118. doi: 10.1200/JCO.2014.58.4904. [DOI] [PMC free article] [PubMed] [Google Scholar]
- 35.Briggs AH. Handling uncertainty in cost-effectiveness models. Pharmacoeconomics. 2000;17:479–500. doi: 10.2165/00019053-200017050-00006. [DOI] [PubMed] [Google Scholar]
- 36.Briggs AH, Weinstein MC, Fenwick EAL, et al. Model parameter estimation and uncertainty analysis: A report of the ISPOR-SMDM Modeling Good Research Practices Task Force Working Group-6. Med Decis Making. 2012;32:722–732. doi: 10.1177/0272989X12458348. [DOI] [PubMed] [Google Scholar]
- 37.US Food and Drug Administration Nivolumab in combination with ipilimumab. http://www.fda.gov/Drugs/InformationOnDrugs/ApprovedDrugs/ucm465274.htm
- 38.Seidler AM, Pennie ML, Veledar E, et al. Economic burden of melanoma in the elderly population: Population-based analysis of the Surveillance, Epidemiology, and End Results (SEER)--Medicare data. Arch Dermatol. 2010;146:249–256. doi: 10.1001/archdermatol.2009.389. [DOI] [PubMed] [Google Scholar]
- 39.Guy GP, Jr, Ekwueme DU, Tangka FK, et al. Melanoma treatment costs: A systematic review of the literature, 1990-2011. Am J Prev Med. 2012;43:537–545. doi: 10.1016/j.amepre.2012.07.031. [DOI] [PMC free article] [PubMed] [Google Scholar]
- 40.Vekeman F, Cloutier M, Yermakov S, et al. Economic burden of brain metastases among patients with metastatic melanoma in a USA managed care population. Melanoma Res. 2014;24:602–610. doi: 10.1097/CMR.0000000000000097. [DOI] [PubMed] [Google Scholar]
- 41.Toy EL, Vekeman F, Lewis MC, et al. Costs, resource utilization, and treatment patterns for patients with metastatic melanoma in a commercially insured setting. Curr Med Res Opin. 2015;31:1561–1572. doi: 10.1185/03007995.2015.1062356. [DOI] [PubMed] [Google Scholar]
- 42.Arondekar B, Curkendall S, Monberg M, et al. Economic burden associated with adverse events in patients with metastatic melanoma. J Manag Care Spec Pharm. 2015;21:158–164. doi: 10.18553/jmcp.2015.21.2.158. [DOI] [PMC free article] [PubMed] [Google Scholar]
- 43.Yousaf N, Davidson M, Goode E, et al. The cost of ipilimumab toxicity: A single-centre analysis. Melanoma Res. 2015;25:259–264. doi: 10.1097/CMR.0000000000000158. [DOI] [PubMed] [Google Scholar]
- 44.US Department of Health and Human Services Patient Protection and Affordable Care Act of 2010. http://www.hhs.gov/healthcare/about-the-law/read-the-law/index.html
- 45.Marseille E, Larson B, Kazi DS, et al. Thresholds for the cost-effectiveness of interventions: Alternative approaches. Bull World Health Organ. 2015;93:118–124. doi: 10.2471/BLT.14.138206. [DOI] [PMC free article] [PubMed] [Google Scholar]
- 46.Shih V, Ten Ham RM, Bui CT, et al. Targeted therapies compared to dacarbazine for treatment of BRAF(V600E) metastatic melanoma: A cost-effectiveness analysis. J Skin Cancer. 2015;2015:505302. doi: 10.1155/2015/505302. [DOI] [PMC free article] [PubMed] [Google Scholar]
- 47.Barzey V, Atkins MB, Garrison LP, et al. Ipilimumab in 2nd line treatment of patients with advanced melanoma: A cost-effectiveness analysis. J Med Econ. 2013;16:202–212. doi: 10.3111/13696998.2012.739226. [DOI] [PubMed] [Google Scholar]
- 48.Curl P, Vujic I, van ’t Veer LJ, et al. Cost-effectiveness of treatment strategies for BRAF-mutated metastatic melanoma. PLoS One. Erratum: PLoS One. 2014;2015;910:e107255. e0126988. doi: 10.1371/journal.pone.0107255. [DOI] [PMC free article] [PubMed] [Google Scholar]
- 49.Hall CJ, Doss S, Robertson J, et al. NICE guidance on ipilimumab for treating previously untreated advanced (unresectable or metastatic) melanoma. Lancet Oncol. 2014;15:1056–1057. doi: 10.1016/s1470-2045(14)70341-9. [DOI] [PubMed] [Google Scholar]
- 50.Horvat TZ, Adel NG, Dang TO, et al. Immune-related adverse events, need for systemic immunosuppression, and effects on survival and time to treatment failure in patients with melanoma treated with ipilimumab at Memorial Sloan Kettering Cancer Center. J Clin Oncol. 2015;33:3193–3198. doi: 10.1200/JCO.2015.60.8448. [DOI] [PMC free article] [PubMed] [Google Scholar]
- 51.Ribas A, Puzanov I, Dummer R, et al. Pembrolizumab versus investigator-choice chemotherapy for ipilimumab-refractory melanoma (KEYNOTE-002): A randomised, controlled, phase 2 trial. Lancet Oncol. 2015;16:908–918. doi: 10.1016/S1470-2045(15)00083-2. [DOI] [PMC free article] [PubMed] [Google Scholar]
- 52. ClinicalTrials.gov Pembrolizumab ongoing clinical trials. https://clinicaltrials.gov/ct2/results?term=pembrolizumab&Search=Search
- 53.US Food and Drug Administration FDA approves Yervoy to reduce the risk of melanoma returning after surgery. http://www.fda.gov/NewsEvents/Newsroom/PressAnnouncements/ucm469944.htm
- 54.Husereau D, Drummond M, Petrou S, et al. Consolidated Health Economic Evaluation Reporting Standards (CHEERS)--Explanation and elaboration: A report of the ISPOR Health Economic Evaluation Publication Guidelines Good Reporting Practices Task Force. Value Health. 2013;16:231–250. doi: 10.1016/j.jval.2013.02.002. [DOI] [PubMed] [Google Scholar]
- 55.Eisenhauer EA, Therasse P, Bogaerts J, et al. New response evaluation criteria in solid tumours: Revised RECIST guideline (version 1.1) Eur J Cancer. 2009;45:228–247. doi: 10.1016/j.ejca.2008.10.026. [DOI] [PubMed] [Google Scholar]