

Abstract
Many cancers appear to activate intrinsic antioxidant systems as a means to counteract oxidative stress. Some cancers, such as clear cell renal cell carcinoma (ccRCC), require exogenous glutamine for growth and exhibit reprogrammed glutamine metabolism, at least in part due to the glutathione pathway, an efficient cellular buffering system that counteracts reactive oxygen species (ROS) and other oxidants. We show here that ccRCC xenograft tumors under the renal capsule exhibit enhanced oxidative stress compared to adjacent normal tissue and the contralateral kidney. Upon glutaminase inhibition with CB-839 or BPTES, the RCC cell lines SN12PM-6-1 (SN12) and 786-O exhibited decreased survival and pronounced apoptosis associated with a decreased GSH/GSSG ratio, augmented nuclear factor erythroid related factor 2 (NRF2), and increased 8-oxo-7,8-dihydro-2′-deoxyguanosine (8-oxodG), a marker of DNA damage. SN12 tumor xenografts showed decreased growth when treated with CB-839. Furthermore, PET imaging confirmed that ccRCC tumors exhibited increased tumoral uptake of 18F-(2S,4R)4- fluoroglutamine (18F-FGln) compared to the kidney in the orthotopic mouse model. This technique can be utilized to follow changes in ccRCC metabolism in vivo. Further development of these paradigms will lead to new treatment options with glutaminase inhibitors and the utility of PET to identify and manage ccRCC patients who are likely to respond to glutaminase inhibitors in the clinic.
Keywords: Renal cell carcinoma, oxidative stress, glutaminase inhibition, CB-839, glutamine reprogramming, PET imaging
Introduction
Oxidative stress is characterized as an imbalance between the generation of cellular oxidants and the process of scavenging their byproducts. If this redox balance is perturbed, then damage of essential components of the cell, including proteins, lipids, and DNA, will occur thereby disturbing organismal homeostasis and leading to a variety of adverse outcomes including oncogenesis and progression of cancer(1-4). Reactive oxygen species (ROS), whose appearance can be considered a signature of oxidative stress, are generated primarily in the mitochondrial electron transport chain during the course of cellular metabolism and play a vital role in normal cell signaling pathways such as proliferation and apoptosis(5,6). However, during periods or locations of environmental stress, such as a highly metabolically active malignancy, excessive ROS are produced which can lead to structural damage within the cell and can actually hinder the progression of the malignancy(7); in such cases, cancer cells often compensate for the higher levels of intrinsic ROS by evolving adaptive mechanisms that increase the cellular antioxidants and corresponding pathways(8).
The role of ROS and antioxidants has been controversial in cancer research(9,10): while the oxidative stress induced by ROS can act in a pro-tumorigenic fashion by inducing mutations, it can also be anti-tumorigenic by inducing (cancer) cell death and decreasing hypoxia inducible factor (HIF)-1 levels(11). Despite the lay concept of antioxidants promoting overall health, many well-designed studies have failed to confirm this idea(12). In fact, there are several recent examples of cancers which are worsened, specifically by increasing metastasis, by the addition of antioxidants(7,13,14). Thus, the balance of pro- and anti-oxidative systems needs to be finely tuned for the “success” of the tumor, but this same system also has the potential to be subverted for therapeutic benefit.
In light of the recently recognized tenet that one of the hallmarks of cancer is metabolic reprogramming(15,16), it is becoming clear that metabolism of many cellular nutrients, including the amino acids, follow reprogrammed pathways in cancer(17-20). Glutathione (GSH) is considered the predominant endogenous cellular antioxidant, playing a critical role in the cellular defensive response to oxidative stress by neutralizing free radicals and reactive oxygen species(21). In ccRCC in particular, the conditionally essential amino acid glutamine is subjected to reductive carboxylation leading to production of the oncometabolite 2HG(22) as well as being a precursor for the major antioxidant system comprised of GSH and GSSG(19,23); indeed, a recent study showed that metabolites that eventually contribute to GSH biosynthesis were able to significantly separate ccRCC tumors from normal tissues(24), emphasizing the importance of this metabolic pathway to ccRCC.
There exist two glutaminases, GLS (kidney type KGA and GAC isoforms) and GLS2 (liver isoform (LGA) and glutaminase B (GAB)), yet GLS is the isoform upregulated in cancer, as well as the main glutaminase within the kidney(25,26). Since GSH synthesis requires glutamate in addition to glycine and cysteine, we tested the hypothesis that blocking glutamate production from glutamine by GLS inhibition will down-regulate this important antioxidant pathway, resulting in higher ROS levels, which will be selectively toxic to cancer cells due to their increased local ROS levels. As GLS regulates the first step of glutamine conversion to glutamate, in this study we utilized CB-839 as a glutaminase inhibitor.
CB-839 is a potent, selective, and orally bioavailable inhibitor of both splice variants of the glutaminase encoded by the GLS gene (KGA and GAC)(27,28). Recently CB-839, as well as the selective KGA and GAC inhibitor BPTES, have been tested in glutamine-avid malignancies such as breast(29) and kidney(30) and have showed success in inhibiting tumor growth. However, in prior studies, the role of glutamine reprogramming to the GSH/GSSG pathway had not been linked to either the promotion of oxidative stress or the inhibition of tumor growth.
While Positron Emission Tomography PET using 18F-fluorodeoxyglucose (18F-FDG) has revolutionized imaging for many malignancies such as melanoma and lung cancer, it has been somewhat challenging for RCC due to excretion of the radiotracer in the urinary system(31,32). However, based on the finding that many ccRCCs are quite glutamine-avid(19,33,34) and that the PET radiotracer 18F-(2S,4R)4-fluoroglutamine (18F-FGln) is taken up by glioma and mammary tumor cells both in vitro and in vivo(35-37), whether uptake of the radiotracer will be applicable to kidney cancer cells is a rationale for the current study.
Due to the increasing evidence that ccRCCs are glutamine-addicted(19,33,34) and that this amino acid is reprogrammed to feed an intrinsic antioxidant system, we now show that (i) the mechanism of the salutary effect of GLS inhibition in ccRCC relates to its effects on antioxidation and enhancement of oxidative stress, and (ii) glutamine reprogramming in ccRCC can be evaluated using 18F-FGln-PET to dynamically study the tumor's biology and response to glutaminase inhibition therapy. Such molecular imaging has the potential to improve clinical practice by (i) earlier diagnosing and staging RCCs, and (ii) stratifying which patients are likely to respond to glutaminase inhibition by dynamically monitoring glutamine uptake in patient tumors before and after treatment with a GLS inhibitor.
Materials and Methods
Materials
PARP antibody was purchased from Cell Signaling Technology, Inc. (Beverly, MA, USA), goat anti-mouse and goat anti-rabbit HRP-conjugated IgG from Bio-Rad (Hercules, CA), anti-nuclear factor erythroid related factor 2 (NRF2) antibody from Abcam (Cambridge, MA) and ECL Plus solution from Thermo-Fisher Scientific (Waltham MA, USA). CB-839 was supplied by Calithera, Inc. (South San Francisco, CA) and was dissolved either in DMSO for in vitro experiments (10 mM stock, stored at -20 0C) or in vehicle for in vivo experiments. The in vivo vehicle consisted of 25% (w/v) hydroxypropyl-β-cyclodextrin in 10 mmol/L citrate (pH 2). The GLS inhibitor BPTES (bis-2-(5-phenylacetamido-1,2,4-thiadiazol-2-yl)ethyl sulfide) and all other reagents were purchased from Sigma (St. Louis, MO)
Cell Lines and Media
786-O cells were purchased from American Type Culture Collection (Rockville, MD, USA) in January 2014 and authenticated originally by the source using short tandem repeat (STR). The RCC cell line SN12PM-6-1 (abbreviated as SN12 throughout the paper) was obtained from Dr. Kerbel, Sunnybrook Research Institute, Toronto, ON; these cells have been previously selected for their ability to retain luciferase expression and to form primary orthotopic tumors(38). These cells were authenticated by Dr. Kerbel's laboratory as described(38). All cells were expanded and then frozen at low passage (passage 5) within 2 weeks after the receipt of the original stocks. All cells used for in vitro experiments were between passages 7 and 15. All cells were routinely monitored in our laboratory for cellular morphology and microbial presence by microscopic observation and they were mycoplasma tested after each thaw or every 6 weeks when growing in culture. The kit used for mycoplasma test was the MycoAlert Mycoplasma Detection Kit from Lonza (Walkersville, MD). SN12 and 786-O cells were all maintained at 5% CO2 and at 37°C in DMEM containing 5.5 mM glucose and supplemented with 10% FBS, 100 units/mL streptomycin, and 100 mg/mL penicillin.
Metabolite Analysis
786-O and SN12 cells were plated in 6-well tissue culture dishes at a density of 2.5×10⁵ cells per well in triplicates for each treatment group for both cell lines. The second day cells were washed with PBS and incubated with 1μM CB-839 or DMSO for 24 h before harvesting. Metabolite extraction was made in 200 μL of ice-cold 50% methanol/50% water and then 200 μL ice-cold chloroform was added. After centrifugation, the upper aqueous phase was collected in a fresh tube and kept in -80°C until the time of analysis. Metabolites were separated on a Waters Acquity H Class HPLC system and measured with a Waters Xevo G2-XS QTOF instrument (Waters Corporation, Milford, MA USA). For amino acid separations, the HPLC method reported by Guo et al.(39) was used with minor modifications as follows: acetonitrile with 0.15% formic acid was used as the organic mobile phase (B), and the gradient starting at 85% B; 6 min, 80% B; 10 min, 55% B; 12.5 min, 45% B, 12.6 min, 5% B, 14 min, 5% B, 14.1 min, 85% B, and 18 min, 85% B. The column was a Waters Acquity BEH Amide 1.7 μm, 2.1 × 150 mm column, the flow rate was 0.4 mL/min, and the run time was 18 min. Metabolite standards were prepared in concentrations from 1-400 μM in 50% Acetonitrile/50% 10 mM ammonium formate + 0.15% formic acid for quantitation. Detection was accomplished in positive electrospray, centroid MSe data acquisition mode over m/z range of 50-1000. Low energy collision voltage was 6 V and high energy voltage ramped from 10 to 40 V. Lockmass correction was applied using leucine enkephalin. Data acquisition was accomplished using MassLynx 4.1 software, and data analysis was performed with TargetLynx software (Waters Corporation).
GSH and GSSG Quantitation
Levels of GSH and GSSG were assayed in cells and tissues using the GSH/GSSG-Glo Assay kit (Promega) as previously described(19). The cells were plated on 96-well culture plates (1500 cells/well) and the next day treated with DMSO, or 1 or 5 μM of CB-839 (n=6/treatment group) for 24 hours. The glutathione (GSH) and oxidized glutathione (GSSG) concentrations were measured in each well. Tumor and kidney tissue homogenates were utilized to measure absolute GSH and GSSG levels using the same kit. Briefly, frozen tissues were homogenized in 5% sulfosalicylic acid at either 100 mg/ml or 47.3 mg/ml, proteins were precipitated by centrifugation, then acid extracts were neutralized with 1 - 1.7 vol 0.5M HEPES pH 8 and if necessary, diluted with 0.25M HEPES pH 7.5, to either 16.7 mg/ml or 17.5 mg/ml respectively. GSH and GSSG standard curves were prepared in the same concentration of 5% sulfosalicylic acid, 0.5 M HEPES pH8, and 0.25 M HEPES pH 7.5 as was used for tissue extract preparation and neutralization.
Cell Viability Assay
Cell viability assays were performed as previously described(40). Briefly SN12 and 786-O cells were plated in 96 well culture plates at a density of 3,000 cells/well, and after the indicated treatments (DMSO, CB-839 or BPTES) at the indicated concentrations for 72h, the cells were incubated in the MTT solution(40) for 3 hours. Then, the MTT solution was removed and the blue crystalline precipitate in each well was dissolved in DMSO. Visible absorbance of each well at 540 nm was quantified using a microplate reader.
Cell Cycle Analysis
Cell cycle analysis was performed on the Muse™ Cell Analyzer (Millipore, Billerica, MA) following the manufacturer's instructions as previously described(41). Briefly, SN12 and 786-O cells were cultured in T25 cell culture flasks (n=3 per condition) at ∼50% confluence and, after 24h, the cells were incubated with the indicated treatments (DMSO or CB-839) at the indicated concentrations for 72h. The cells were washed with PBS, fixed in 70% iced ethyl alcohol for 3 h, and stained with propidium iodide. After staining, the cells were processed for cell cycle analysis using the Muse Analyzer.
Apoptosis Assay
Apoptosis in cells was measured using the Annexin V & Dead Cell Assay Kit on the Muse™ Cell Analyzer (Millipore) following the manufacturer's instructions as previously described(41). Briefly, SN12 and 786-O cells were cultured in T25 cell culture flasks (n=3 per condition) at ∼50% confluence. After the indicated treatments for 72h, the cells were incubated with Annexin V and Dead Cell Reagent (7-AAD) for 30 minutes and the events for dead, late apoptotic, early apoptotic, and live cells were counted using the Muse analyzer.
Immunostaining of NRF2 and 8-oxodG in tumor and kidney tissues
Mouse tumors, adjacent normal kidney and right normal kidney tissues were harvested from animals and fixed in 10% formalin for 24 h. Paraffin embedded sections (4 μm) were stained for NRF2 using heat-induced antigen retrieval in citrate buffer (pH 6.0) and anti-human NRF2 (1:200 overnight), followed by one hour incubation with Rabbit HRP-Polymer (BioCare Medical, Concord, CA) and ImmPACT diaminobenzidine peroxidase substrate (Vector Laboratories, Burlingame, CA). All sections were viewed and photographed using light microscopy. For 8-oxodG staining, a double fluorescent labeling method of immunostaining was performed in kidney and tumor sections of mice as previously described(42). Briefly, sections were stained with an 8-oxodG antibody, FITC-labeled secondary antibody and nuclei stained with propidium iodide. FITC was detected using a 450-490 nm filter and PI using a 535 nm filter. All sections were viewed and photographed using a Nikon Research microscope equipped for epifluorescence with excitation and band pass filters. To demonstrate staining specificity, control tissue sections were stained without primary antibody.
Immunostaining of NRF2 in cells
SN12 cells were plated on multi-chamber glass slides (Fisher Scientific) and the second day cells were washed with PBS and incubated with DMSO or CB-839 (1μM) for 24 h. H2O2 (500 μM) was added in the last 4 h of the treatment to indicated groups (DMSO/H2O2, CB-839/H2O2)). After 24 h, the media was removed and the cells were fixed for 15 minutes in PBS containing 4% paraformaldehyde and 2% sucrose and then permeabilized in PBS containing 0.3% Triton X-100 for 2 minutes. The cells were incubated with NRF2 antibody (1:200), a FITC-labelled anti-rabbit antibody, and the nuclei were stained with DAPI. The cells were mounted onto slides and visualized using fluorescence microscopy (Zeiss LSM510 laser-scanning confocal microscope image system) and for each treatment group, 5 microscopic fields were randomly chosen and counted for NRF2 positive staining.
8-oxodG Quantitation in Cells and Tissues
DNA was isolated from cells or frozen normal and tumor kidney cancer samples as previously described(42). DNA purity and concentration was determined spectrophotometrically. Digestion of 8-oxodG was performed using nuclease P1 and alkaline phosphatase as previously described(42). Authentic standards of 8-oxodG were analyzed and its quantitation in each sample was performed by linear regression analyses according to the manufacturer's instruction (#589320, Cayman Chemical, Ann Arbor, Michigan).
Immunoblotting
The cell lysates were prepared with RIPA lysis buffer (Fisher Scientific, Grand Island, NY) containing a protease inhibitor cocktail (Invitrogen, Carlsbad, CA). Immunoblotting was done as described previously(19). Densitometry was performed using ImageJ software
Orthotopic RCC mouse model and in vivo experiments
All animal procedures were performed in compliance with the University of California Institutional Animal Care and Use Committee. In all three animal experiments, an orthotopic model for SN12 cells was used in which cells were implanted under the left kidney capsule. Briefly, for orthotopic injection under the renal capsule, 2 months old male Fox Chase SCID (CB17SCID) mice from Charles River Laboratories were used as described elsewhere(38). First, mice were anesthetized with isoflurane (2-3%) and then a small incision was made along the left flank of the mouse. The abdominal cavity was opened and the left kidney was exteriorized. An ultra-fine needle attached to a 10 μl Hamilton syringe was used to slowly inject a half million viable SN12 cells in a total of 10 μl volume in DMEM growth media under the left kidney capsule. After one week tumor growth was confirmed and followed up by whole body bioluminescence imaging as described below. A 90% success rate for tumor growth was achieved in all three experiments.
Three animal experiments were performed in this study. The first experiment was designed to measure the baseline oxidative stress biomarkers where all animals (10 mice) received no treatment. In this experiment, mice were euthanized at day 28 after cell implantation and samples were collected as indicated. The second experiment was designed to investigate the effect of the GLS inhibitor CB-839 (total 10 mice, n=5 in CB-839 and vehicle treated groups) on the oxidative stress biomarkers and to test whether PET using 18F-FGln can be used to visualize RCC tumors. In the third experiment, designed to increase the power of the 18F-FGln-PET studies, more mice (total 16 mice, n=8 in CB-839 and vehicle treated groups) were utilized to confirm the findings from the second experiment. For the last two animal experiments, when tumors reached a considerable size at 3 weeks after cell implantation (according to our and others' (38) experience with this model), mice were randomly assigned to one of the two treatment groups (vehicle or CB-839). CB-839 was formulated at 20 mg/mL (w/v) in vehicle (29). The animals in both latter experiments were orally dosed with vehicle or 200 mg/kg of CB-839 twice a day. For the second experiment (n=5 per group), the treatment was for 3 weeks to allow for sufficient tissue for the indicated assays, the animals were weighed every 4 days and euthanized at day 20 (4 h after last dosing with vehicle or CB-839). For the third animal experiment the treatment continued for 2 weeks to test the effect of CB-839 on tumor growth and evaluate 4-[18F]fluoroglutamine uptake, the animals were weighed every 3 days and euthanized at day 14 (4 h after last dosing with vehicle or CB-839). All animals were monitored for signs of adverse reactions. Tumor samples and organs were collected for indicated analyses.
Bioluminescence Imaging (BLI)
In all three in vivo experiments, whole body bioluminescence imaging was performed on all animals every week during the experiment to monitor tumor progression as follows: luciferin (15 mg/ml in PBS; Gold Biotechnology, Inc., St. Louis MO) was administered intraperitoneally at 150 mg/kg. The mice were anaesthetized with isoflurane (2-3%) and imaged 10 min post-injection in the IVIS Spectrum (Perkin Elmer). The exposure time was 3 min and two to three mice were imaged at a time. Data processing was performed using the vendor-provided Living Image software. The BLIs were quantitated using Living Image software as follows: regions of interest for BLIs from all 16 mice were designated inside the primary (not metastatic) tumor sites on the left kidney using free draw function and quantified as a mean of total flux (photons/second).
Radiochemistry
18F-FGln was synthesized as previously described by Kung and coworkers(35,36). 4-[18F]fluoroglutamine (18F-FGln) was evaluated by chiral HPLC to determine radiochemical purity and optical purity, and to verify identity, by co-injection with reference standards(35,43).
18F-FGln cell uptake
SN12 cells and 786-O cells were grown in T75 cell culture plates at ∼75% confluence and 24 h later cells were incubated with 1 μM CB-839 or DMSO for the last 4 h before harvesting the cells for the uptake assay to maintain a high cell viability. The cells were then collected and washed with PBS and the viability was tested using Muse Analyzer (viability was 98%). The cells were re-suspended in DMEM media (low glucose) supplemented with 2 mM glutamine and the assay was performed as follows: 18F-FGln (7.4 KBq) was added to cell suspensions (3.0×10⁶ cells) in DMEM (50 μL) and incubated at room temperature for 30 min in closed Eppendorf tubes (pretreated with bovine serum albumin [5% w/v in PBS] to block nonspecific binding) with regular agitation. Following centrifugation at 130×g for 3 min, the supernatant was removed and the cell pellet was washed with DMEM (0.5 mL). The supernatants were combined, and the cells were resuspended in DMEM (0.6 mL). The cells (containing bound 18F-FGln) and the DMEM supernatant solution (containing unbound 18F-FGln) were separated and counted. The fraction of radioactivity inside the cells was determined with a γ-counter and the % uptake calculated as radioactivity in the cellular fraction divided by total radioactivity in cells+supernatant.
PET and CT imaging and analysis
Five mice in each treatment group (CB-839 or vehicle treated) were imaged before the start of the treatment (day-0) and 14 days after treatment. All imaging was performed under an IACUC-approved protocol. The animals were anesthetized with isoflurane (2.5%) and administered ∼225 μCi 18F-FGln via tail vein catheter injection, and then the animals were imaged. Imaging of animals at day 0 (base line) was performed with no prior treatment but at day 14 of treatment imaging was started at least 4 h after orally dosing of vehicle or CB-839 (29). PET images were acquired for 30 min using a small-animal PET scanner (DPET, Siemens Preclinical Solutions, Knoxville, TN) starting at 15 min post injection of18F-FGln. PET images were reconstructed using a conventional 3D MAP reconstruction with a single hyperbolic prior (SP-MAP) provided by the vendor. After the PET scan, the animal bed was moved to a CT scannner (Inveon CT, Siemens Preclinical Solutions, Knoxville, TN) for anatomical image acquisition. Ellipsoid 19.06 mm3 regions of interest (ROIs) were drawn using the AMIDE software on the PET/CT overlay images to calculate the mean standardized uptake value (SUV) for each right kidney and each tumor in the left kidney.
Statistical analysis
The day 14 mean SUVs from 18F-FGln -PET images were analyzed by ANOVA using SAS version 9.3 and the Proc GLM program to test for differences between tissues (kidney vs tumor) and differences between vehicle and CB-839 treatments. Tukey and dunnett post-hoc tests were used. All other data were statistically analyzed using two-sample equal variance Student's t-tests with a 2-tailed distribution. A p-value of < 0.05 was considered statistically significant.
Results
Subcapsular ccRCC xenograft tumors demonstrate higher levels of oxidative stress compared to adjacent normal and contralateral normal renal tissues in an orthotropic mouse model of ccRCC
The free radical scavenging function of GSH is evidenced by the appearance of GSSG, the oxidized form of GSH, such that a decreased GSH:GSSG ratio serves as a signature of oxidative stress in a biological system(44,45). We established a ccRCC orthotropic mouse model by implanting luciferase-expressing SN12-PM6-1 cells (SN12) (38) under the left kidney capsule of SCID mice, leaving the contralateral right kidney untouched. Tumor growth rates in these mice were evaluated using weekly bioluminescence imaging (BLI; Fig.1A) and for this first (treatment naïve) in vivo experiment, the tumors were collected at sacrifice, four weeks after subcapsular cell implantation, to evaluate their redox status compared to tumor-adjacent and normal kidney tissues. The xenograft tumors showed increased levels of reduced and oxidized forms of glutathione (GSH and GSSG, respectively) compared to tissues from the normal right kidney (RK) and from the adjacent normal left kidney (LK) (Fig. 1B) likely as a result of their dealing with a higher level of oxidative stress due to their faster metabolism and activation of proliferative pathways. In addition, the GSH/GSSG ratios were significantly decreased in tumor tissues as compared to tissues from the right normal kidney (RK) but with less extent in the adjacent normal left kidney (LK) (Fig. 1C) indicating that the RCC microenvironment was associated with higher levels of oxidative stress compared to normal kidney tissues.
Fig. 1.

RCC tumors show higher oxidative stress as compared to adjacent normal and contralateral renal tissues.
A. SN12-PM6-1 (SN12) cells were implanted under the renal capsule of the left kidney in SCID mice and whole body bioluminescence imaging was acquired in the three animal experiments as described in Materials and Methods. A representative imaged mouse is shown.
B. The metabolites GSH and GSSG were measured in RCC tumors, tumor-adjacent normal tissue in left kidney (LK), and untouched right kidney (RK) in untreated mice (n=3). Data are mean ± SEM. *p<0.05 compared to tumor tissue. For GSH, p=0.008 for tumor vs RK and p=0.032 for tumor vs LK. For GSSG p=0.006 for tumor vs RK and p=0.071 for tumor vs LK). Results shown are representative of at least three independent experiments
C. The ratio of GSH/GSSG from the same measurements in Fig.1B were calculated in RCC tumors, adjacent renal tissue in left kidney (LK) and tissue from right kidney (RK) (n=3/group). Error bars are SEM. *p<0.05 compared to tumor tissue. For tumor vs RK p=.023, tumor vs LK p=.069. Results shown are representative of at least two independent experiments
D. Representative sections of normal right kidney and tumor tissues were subjected to immunoperoxidase staining for NRF2.
E. Representative sections of normal and tumor kidney tissues were subjected to immunofluorescence staining for 8-oxodG and propidium iodide (PI; nuclear stain).
F. Quantitation of 8-oxodG levels were measured in the DNA of RCC tumors and normal kidney tissues from 5 mice, which were randomly selected from 10 untreated mice, and the average is shown. Data are mean ±SEM. *p<0.05 tumor compared to normal kidney (p=.006).
Since the direct measurement of ROS is challenging due to the short lifetime of this species and to its immediate reaction with redox state regulating components, we utilized indirect measurements of oxidative stress. We evaluated levels of nuclear factor erythroid related factor 2 (NRF2), a transcription factor that controls enzymes that regulate the antioxidant response in cells(46), and we also used indirect measurements of oxidative damage to DNA by measuring levels of 8-oxo-7,8-dihydro-2′-deoxyguanosine (8-oxodG)(47).
Immunohistochemistry analysis revealed increased NRF2 expression in tumor as compared to normal contralateral kidney tissues (Fig 1D, Fig S1). Similarly, immunohistochemistry for 8-oxodG showed greater numbers of subcapsular tumor cells expressing this marker of oxidative damage compared to cells in the contralateral normal kidney (Fig 1E). 8-oxodG levels were quantified and found to be significantly increased in tumors (p=0.006; Fig 1F). Taken together, these results suggest that, at least in the ccRCC subcapsular xenografts used in this study, the tumors showed increased levels of oxidative stress, as well as an enhanced antioxidant buffer system, when compared to normal kidney tissue.
Glutaminase inhibition by CB-839 blocks glutamine utilization in RCC cells and tissue
After validating and confirming the high oxidative stress signature in tumors in the mouse model, we next asked whether the glutamine pathway is involved in the regulation of oxidative stress in both in vitro and in vivo models of RCC. Glutamate is produced from glutamine, the most abundant amino acid in plasma(18,23), by the mitochondrial enzyme GLS(27). Since GSH requires glutamate (in addition to glycine and cysteine) for its synthesis, we next asked whether the selective GLS inhibitor CB-839(29,30) blocks this key antioxidant pathway and thereby reduces GSH in RCC cells; such a finding would be expected to adversely impact several critical metabolic pathways including the tricarboxylic acid (TCA) cycle and redox balance (Fig. 2A). Incubating SN12 and 786-O cells with CB-839 significantly increased glutamine levels in both the cells and the media, as compared to control cells, and intracellular glutamate was significantly decreased. These data are expected given that the conversion of glutamine to glutamate is blocked by GLS inhibition (Fig. 2B, Fig. S2A) and are consistent with a recently published breast cancer study using CB-839(37). Furthermore, GSH, which has glutamate as a precursor, was decreased by CB-839 treatment, and GSSG was relatively increased (also reflected by a decreased GSH/GSSG ratio), demonstrating increased levels of oxidative stress within the cells in the presence of GLS inhibition (Fig. 2B). These results are consistent with our previous work in other RCC cell lines using glutamine-depleted media in which the GSH/GSSG ratio was reduced under these growth conditions(19). The tumors from mice treated with CB-839 also showed a decreased trend in GSH/GSSG (p=0.139) compared to tumors from mice treated with vehicle (Fig.2B, far right panel) indicative of increased oxidative stress as a result of GLS inhibition and consistent with the in vitro data. Taken together, these results demonstrate that CB-839 decreases glutamate production and results in enhanced oxidative stress within SN12 and 786-O RCC cells via attenuation of the GSH pathway. In light of these results, we next asked if GLS inhibition could be beneficial to treat RCC by testing its biological effects in RCC cells and tumors using both in vitro and in vivo models.
Fig. 2.

Inhibition of glutaminase with CB-839 attenuates the glutathione pathway in RCC.
A. The antioxidant pathways that neutralize reactive oxygen species (ROS). The glutamine pathway is reprogrammed in ccRCC to increase production of glutathione (GSH) and oxidized glutathione (GSSG). Glutamate, cysteine and glycine are required to synthesize GSH. The conversion of glutamine to glutamate is regulated by glutaminase (GLS), which can be targeted and inhibited by CB-839 (or BPTES). Thioredoxin also reduces ROS levels and is generated by NADPH, which in turn regulates the conversion of GSH and GSSG. Catalase is another pathway, NADPH independent, which reduces ROS.
B. SN12 cells were incubated with 1μM CB-839 or DMSO for 24 h (n=3/group). The cells and conditioned media were obtained and analyzed by HPLC-MS/MS for the metabolites indicated as described in Materials and Methods. Data are mean ±SD. *p<0.05 compared to DMSO treated cells. For tumor tissue (far right panel), tissues were collected form the second animal experiment (orally dosed with vehicle or CB-839; n=5/group) and GSH and GSSG were measured using the GSH/GSSG Kit from Promega. Data are mean ±SEM.
Glutaminase inhibition increases oxidative stress and attenuates viability in RCC cells
To elucidate a more detailed response to GLS inhibition in ccRCC cells, we incubated SN12 as well as 786-O cells with CB-839 or another GLS inhibitor, BPTES(48), at several doses for 72 h and evaluated cell viability, cell cycle arrest, and measures of DNA damage and apoptosis (Fig. 3). Both CB-839 and BPTES share a similar allosteric binding mechanism and selectivity profile upon GLS(29), and we show that both dose-dependently attenuated cell viability or proliferation as measured by an MTT assay (Fig. 3A). Incubation of RCC cells with CB-839 (from 10 nM to 5,000 nM) for 72 h showed a cell viability IC50 of 740 nM for SN12 cells and 970 nM for 786-O cells (Fig. S2B); thus 1 μM of CB-839 was used in the subsequent in vitro experiments. Since CB-839 showed a higher magnitude of cell viability reduction (see Fig. 3A), and because it is a clinical candidate for ccRCC(30), we used only CB-839 as a GLS inhibitor in all subsequent experiments.
Fig. 3.

CB-839 inhibits RCC cell viability by inducing both cell cycle arrest and apoptosis in SN12 and 786-O RCC cells
A. SN12 and 786-O cells were grown and incubated with DMSO, CB-839 or BPTES at the concentrations indicated for 72 h (n=8 wells/group) and then subjected to MTT assay. Data are mean ±SD. *p<0.001 compared to DMSO control. Results shown are representative of at least three independent experiments.
B. SN12 and 786-O cells were grown and incubated with CB-839 or DMSO (1 μM) for 72 h (n=3/group). Cell cycle populations and total apoptosis were measured by flow cytometry of stained cells. Results shown are representative of at least three independent experiments
C. SN12 cells were grown and incubated with CB-839 at the concentrations indicated for 20 h followed by 4 h H2O2 where indicated (n=3/group). Total apoptosis was measured by Annexin V and 7-AAD staining using flow cytometry. Percentages of total apoptosis are plotted. The results shown are representative of at least three independent experiments. Data are mean ±SD.
D. At the same conditions in C, levels of cleaved PARP were measured by immunoblotting. The results shown are representative of at least three independent experiments.
CB-839 caused cell arrest in G0/G1 (Fig. 3B) and 72 h of treatment significant increased the percentage of apoptotic cells that were annexin V and 7-AAD positive (Fig. 3B), which indicate increased late stage apoptotic and dead cells. To further support the role of the GSH pathway in neutralizing ROS, we incubated SN12 cells with CB-839 for 20 h and then induced oxidative stress by adding H2O2 for 4 h. Under these conditions, CB-839 dose-dependently sensitized RCC cells to H2O2, as evidenced by an increased percentage of apoptotic and dead cells demonstrated both by flow cytometry using annexin V and 7-AAD staining (Fig. 3C and Fig. S3). These data were supported by the observed increase in PARP cleavage under the same conditions (Fig. 3D).
To further validate the effect of CB-839 on oxidative stress biomarkers in vitro, we evaluated oxidative DNA damage by measuring cellular levels of 8-oxodG. Incubation of SN12 and 786-O cells with 1 μM CB-839 for 24 h significantly increased 8-oxodG in these cells (Fig. 4A, left two panels), suggesting that the cells had a reduced capacity to repair ROS-induced damage while in a state of enhanced oxidative stress due to the presence of glutaminase inhibition. A significant increase of 8-oxodG was also detected in tumors from mice treated with CB-839 (Fig.4A, right panel) demonstrating that CB-839 is increasing oxidative stress at the DNA level.
Fig. 4.

Glutaminase inhibition augments oxidative stress in SN12 and 786-O cells and tumor tissue.
A. SN12 and 786-O cells were grown, incubated with 1 μM CB-839 or DMSO for 24 h, and 8-oxodG levels were measured (left panels). Data are mean ±SD. *p<0.05 compared to control (DMSO). Tumor tissues from the second animal experiment (orally dosed with vehicle or CB-839) were harvested and 8-oxodG levels were quantified (right panel). Data are mean ±SEM. *p<0.05 vehicle treated group as compared to CB-839 treated group (n=4).
B. SN12 and 786-O cells were grown and incubated with CB-839 or DMSO at the concentrations indicated for 24 h. NRF2 levels in whole cell lysates were measured by immunoblotting. Densitometry relative to loading controls is shown.
C. SN12 cells were grown and treated with CB-839 or DMSO at the concentrations and time indicated, followed by H2O2 treatment (where indicated) for 4 h. The cells were fixed and subjected to immunofluorescence staining with NRF2 (green) and DAPI (blue), then visualized with confocal laser-scanning microscopy. The results shown are representative of at least two independent experiments.
D. For each treatment in C group, five randomly selected microscopic fields (40×) of NRF2 positively stained cells were counted. Data are mean ±SD. *p<0.05 compared to DMSO control.
We next examined NRF2 expression in our RCC cell model in the presence of the GLS inhibitor. In SN12 and 786-O cells, there were low basal levels of NRF2 protein in DMSO-treated cells, which was dose-dependently augmented after incubation of these cells with CB-839 (Fig.4B). Subcellular localization of NRF2 in SN12 cells after incubation with CB-839 and H2O2 and showed an increase in nuclear NRF2 in CB-839 treated cells, which was more pronounced upon H2O2 treatment (Fig. 4C, D). Thus, in the presence of CB-839, NRF2 orchestrates an enhanced response to the oxidative stress that is unleashed by means of a CB-839-mediated decrease in production of oxidative stress buffers.
CB-839 attenuates RCC tumor growth in the RCC orthotopic mouse model
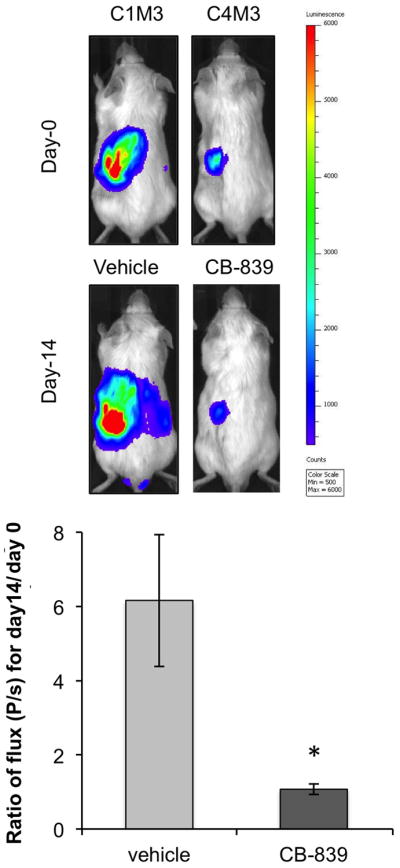
To extend our findings to an in vivo model of ccRCC, we utilized CB-839 in the subcapsular orthotopic mouse model of ccRCC described earlier. In a third in vivo experiment, mice (n=8/group) were dosed orally twice a day with vehicle or 200 mg/kg CB-839 for 2 weeks, and bioluminescence imaging (BLI) was performed weekly (Fig. 5A; Fig. S4A). The change in mean total flux for bioluminescence (photon/second) over the treatment period was calculated as a ratio for each animal (flux at day 14/flux at day 0; Fig. 5B). Treatment with CB-839 significantly inhibited growth of the tumors (Fig.5B). As a general measure of lack of toxicity of this treatment, no mice treated with CB-839 showed a significant weight change (Fig. S4B)
Fig. 5.
CB-839 significantly attenuates tumor growth in an orthotopic RCC mouse model
A. SN12 cells were injected under the left kidney capsule of SCID mice (n=8 per condition; third animal experiment). After 3 weeks two mice were dosed orally twice a day with vehicle or 200 mg/kg CB-839 for 2 weeks. Weekly BLIs was performed to monitor tumor progression. In vivo BLI for one representative mouse per group before and after CB-839 treatment is shown demonstrating significant reduction in tumor growth with CB-839 after 2 weeks. Color scale for all images was set on a minimum of 500 and a maximum of 6000 counts.
B. ROI for all BLI images (n=8 mice per group) before and after treatment were designated inside the primary tumor sites on the left kidney and quantified as a mean of total flux (photons/second (P/s)) using the Living Image software. The ratio of flux (P/s) at day 14/day 0 for each animal was calculated and the average presented for each treatment group. Data are mean ± SEM. *p=0.013.
In light of the fact that FDG-PET is challenging for RCC diagnosis and staging (31,32) we next asked, based on our findings here and in previous publications of glutamine requirements of RCC(19), whether 18F-FGln -PET could be employed for in vivo monitoring of this cancer. After confirming that SN12 as well as 786-O cells uptake 4-[18F]fluoroglutamine in vitro (Fig. 6A) and that CB-839 resulted in tracer retention in SN12 cells (Fig. 6B), we subjected the mice to 18F-FGln -PET and CT scanning immediately prior to starting treatments (Day 0; Fig. S5 and Fig. 6C) and after 2 weeks of CB-839 treatment (Day 14; Fig. S5 and Fig. 6C). The PET images were acquired 4 h after the last dose of CB-839, which has been shown to be sufficient time for CB-839 to be internalized in tumors and other tissues (29). The subcapsular xenografted tumors were visualized by 18F-FGln uptake as demonstrated by significantly higher uptake compared to the contralateral kidney (Figs 6C,D). On day 0, the tumor SUV was 4.8 and the kidneys were 2.5. On day 14 in the vehicle treated animals, the tumor SUV was 5.2 and the kidneys were 3.1. In addition, the kidneys and tumors both increased their 4-[18F]fluoroglutamine uptake after treatment with CB-839 (p=0.026; Fig. 6D) as expected from the in vitro data (see Fig. 6B) as well as a recently published report in breast cancer (37).
Fig. 6.

18F-FGln cell uptake and 4-[18F]fluoroglutamine-PET imaging
A. Intracellular uptake of an 4-[18F]fluoroglutamine tracer after 30 min incubation in SN12 and 786-O RCC cell lines. (n=3 for each cell line). The Y-axis represents % uptake of total radioactivity by the cells. Data are mean ± SD.
B. 4-[18F]fluoroglutamine uptake in SN12 cells after 4 h incubation with 1 μM CB-839 (n=3) or DMSO (n=3) and 30 min with the 4-[18F]fluoroglutamine. The Y-axis represents % of total radioactivity contained in each group of cells. Data are mean ± SD *p<0.05 compared to DMSO control.
C. Representative mouse images from each treatment group are presented. Coronal and axial sections from PET (color) are overlaid on CT images (grayscale). Adjacent to each coronal PET/CT image is the coronal whole body maximum intensity projection generated from the PET. Yellow arrows point to tumors.
D. Comparison of 18F-FGln uptake in the tumors compared to the right normal kidneys at day 0 (n=10) and day 14 of treatment (n=5/group). Two regions of interest (ROIs; 19.06 mm3 ellipsoids) were drawn on the PET images of each mouse, one on the tumor and one on the right kidney (kidney). Mean standardized uptake value (SUV) of 18F-FGln for each ROI was calculated using AMIDE software. Data are mean ± SEM. ***p=0.002 for tumor compared to right kidney.
Discussion
In aerobic conditions, rapidly proliferating cancer cells are invariably exposed to metabolites which produce oxidative stress(49), thus “successful” malignancies and metastases are those which are able to withstand such conditions through the production of intrinsic antioxidants(7,8). Indeed, there are several recent reports which demonstrate that, contrary to lay press reports of antioxidants being beneficial dietary supplements(7), these compounds can in fact accelerate lung cancer progression in mice(13) and promote distant metastases in human melanoma cells(50,51); similar findings have most recently been shown in pancreatic cancer by deletion of malic enzyme 2(52). While ccRCC cells have been shown to require glutamine for growth and survival(19), the direct role of this amino acid in the response of ccRCC cells and kidney cancers to oxidative stress has, prior to the current study, not been described.
While our previous study suggested that the conditionally essential amino acid glutamine is required for production of the oxidative stress “buffers” GSH and GSSG(19), we now show that decreasing intracellular glutamate by the GLS inhibitor CB-839 (by blocking glutamine conversion to glutamate) has the direct effect of decreasing production of these buffers in vitro and in vivo. This in turn leads to an increase in oxidative stress with its resulting increase in DNA damage, which likely serves to attenuate growth of these tumors in vivo. These data are supported by a melanoma model of lymph node metastases, where an opposite approach to ours was used; in that study administration of exogenous antioxidants resulted in increased levels of GSH synthesis (increase in ratio of GSH/GSSG) which was associated with increased metastases(51).
Since cancer cells possess many of the qualities of normal cells, they too can be damaged by ROS. Indeed, for a variety of reasons(53), cancer cells actually generate more ROS than normal cells and hence show more evidence of DNA damage and buffer system engagement (as we showed in this study), requiring them to have a greater antioxidant capacity. Such intrinsic antioxidants are thus required of “successful” cancers to reduce distant ROS damage while simultaneously allowing localized ROS signaling that promotes cell proliferation and survival(8). It is conceivable(7,8) that systemic antioxidants, taken by many individuals in the hope that they are generally beneficial, could ultimately adversely impact ccRCC, thus our data presented here could impact public health with respect to a cancer type that is growing in incidence and is lacking effective therapies.
While there exists a robust and profitable industry which sells antioxidant supplements for a variety of ailments including cancer, there are few positive studies of such supplements in prolonging lifespan of cancer patients(8). That protection from oxidative stress plays a role in cancer progression and metastasis is only recently becoming apparent, and we and others have shown data suggestive that metabolic reprogramming of the glutamine and NADH pathways are responsible for this state of affairs at least in kidney cancer(19,23). Based on our work in this study elucidating the mechanism of their action, additional drugs targeting glutamine reprogramming are ripe for clinical trials; indeed a Phase 1 trial of the glutaminase inhibitor CB-839 was the first salvo in applying this paradigm to RCC(30) (although in that study CB-839 was compared to a combination therapy). In addition, dissuading patients with RCC from taking over-the-counter antioxidants may now be appropriate.
While 18F-FDG-PET is frequently used both to screen for and stage cancers, it has (despite highly reprogrammed aerobic glycolysis(19,54)) been problematic for ccRCC and is therefore not commonly used in the clinic for routine RCC staging(31,32). Furthermore, the use of 18F-FGln -PET has recently been developed for glioma(36,55) and other tumors(35,37). Capitalizing on glutamine reprogramming in antioxidant production in RCC and the inhibition of ccRCC tumor growth by GLS inhibitor CB-839 as described in this study, we evaluated 18F-FGln -PET in our in vivo RCC model and found that it successfully detected ccRCC tumors in our orthotopic mouse model. As proof of the likelihood of using this technique to monitor therapeutic response, we further showed, despite a decrease in tumor growth as evaluated by BLI, an increase in 18F-FGln uptake in response to glutaminase inhibition with CB-839; the latter is consistent both with our cell culture uptake studies for 18F-FGln reported here and a very recent study in breast cancer(37). Our study thus demonstrates that such glutamine dependence can potentially be evaluated using 18F-FGln -PET imaging and could lead to stratification of patients into those whose tumors are more glutamine-avid and are thus more likely to respond to glutaminase inhibition. We also show here that this approach could be amenable to in vivo monitoring of the progress of these tumors to glutaminase inhibition therapy by following the effect on tumoral glutamine in the presence of CB-839 or other glutaminase inhibitors. This is the first time to our knowledge that this technique has been used in identifying and imaging kidney malignancy, under basal as well as therapeutic conditions.
The limitations of our study relate principally to the mouse model and cell line used, since, given the known heterogeneity of RCC(56), it is likely that human tumors will have variable degrees of oxidative stress depending on the makeup of their tumors. Consistent with this, and dependent on the degree of angiogenesis within each tumor, it is possible that CB-839 will have variable penetration into the tumor and hence inconsistent effect on both oxidative stress and tumor growth.
In summary, we have shown in this study that a glutamine-dependent antioxidant effect is present in ccRCC and likely provides this malignancy with a key mechanism for its survival in a hostile host environment. Furthermore, this reprogrammed pathway not only suggests an Achilles' heel that can be exploited by glutaminase inhibitors, but also provides a means to use 18F-FGln -PET imaging for diagnosis, stratification and real-time response to therapy. Continuing translation of CB-839 and other inhibitors of the reprogrammed glutamine pathway to human trials, either singly or in combination with other therapies, has the potential to revolutionize clinical management of a cancer which is increasing in incidence and which currently has woefully limited treatment options.
Supplementary Material
Acknowledgments
We thank Dr. Primo N. Lara for helpful suggestions during the course of this research, Jason S. Lewis and the staff of the MSK Radiochemistry and Molecular Imaging Probe Core for help with all aspects of this study, and Dr. Ouathek Ouerfelli of the MSK Organic Synthesis Core both of the latter at Memorial Sloan Kettering Cancer Center for 18F-FGln precursor. We also thank the staff at the UC Davis Center for Molecular and Genomic Imaging, in particular David Kukis, Jennifer Fung, Charles Smith and Douglas Rowland for radiochemistry and imaging expertise. CB-839 was generously supplied by Calithera Biosciences and the SN12C cells were a generous gift from Robert Kerbel from Sunnybrook Research Institute, Toronto, ON. We thank Dialysis Clinics, Inc., The Jerry and Susan Knapp Cancer Research Fund, and the UC Davis Center for Molecular and Genomic Imaging Pilot Funds for additional support.
Financial support: R.H. Weiss: NIH/NCI grant 1R01CA135401
R.H. Weiss: NIH/NCI grant 1R03CA181837-01
R.H. Weiss: NIH/NIDDK grant 1R01DK082690-01A1
R.H. Weiss: NIH/NCI Cancer Center Support Grant P30 CA093373
S.L. Habib: VA Merit Review grant 2I01BX000924-04A
B. Stewart: NIH/NIGMS grant P41GM103483
Footnotes
Conflicts of interest: none
References
- 1.Day AM, Brown JD, Taylor SR, Rand JD, Morgan BA, Veal EA. Inactivation of a peroxiredoxin by hydrogen peroxide is critical for thioredoxin-mediated repair of oxidized proteins and cell survival. Molecular cell. 2012;45:398–408. doi: 10.1016/j.molcel.2011.11.027. [DOI] [PubMed] [Google Scholar]
- 2.Schieber M, Chandel NS. ROS function in redox signaling and oxidative stress. Current biology: CB. 2014;24:R453–62. doi: 10.1016/j.cub.2014.03.034. [DOI] [PMC free article] [PubMed] [Google Scholar]
- 3.Wu Q, Ni X. ROS-mediated DNA methylation pattern alterations in carcinogenesis. Current drug targets. 2015;16:13–9. doi: 10.2174/1389450116666150113121054. [DOI] [PubMed] [Google Scholar]
- 4.Bielski BH, Arudi RL, Sutherland MW. A study of the reactivity of HO2/O2- with unsaturated fatty acids. The Journal of biological chemistry. 1983;258:4759–61. [PubMed] [Google Scholar]
- 5.Finkel T. Redox-dependent signal transduction. FEBS letters. 2000;476:52–4. doi: 10.1016/s0014-5793(00)01669-0. [DOI] [PubMed] [Google Scholar]
- 6.Jabs T. Reactive oxygen intermediates as mediators of programmed cell death in plants and animals. Biochemical pharmacology. 1999;57:231–45. doi: 10.1016/s0006-2952(98)00227-5. [DOI] [PubMed] [Google Scholar]
- 7.Herraiz C, Crosas-Molist E, Sanz-Moreno V. Reactive oxygen species and tumor dissemination: Allies no longer. Molecular & cellular oncology. 2016;3:e1127313. doi: 10.1080/23723556.2015.1127313. [DOI] [PMC free article] [PubMed] [Google Scholar]
- 8.Chandel NS, Tuveson DA. The promise and perils of antioxidants for cancer patients. The New England journal of medicine. 2014;371:177–8. doi: 10.1056/NEJMcibr1405701. [DOI] [PubMed] [Google Scholar]
- 9.Gorrini C, Harris IS, Mak TW. Modulation of oxidative stress as an anticancer strategy. Nature reviews Drug discovery. 2013;12:931–47. doi: 10.1038/nrd4002. [DOI] [PubMed] [Google Scholar]
- 10.Sabharwal SS, Schumacker PT. Mitochondrial ROS in cancer: initiators, amplifiers or an Achilles' heel? Nature reviews Cancer. 2014;14:709–21. doi: 10.1038/nrc3803. [DOI] [PMC free article] [PubMed] [Google Scholar]
- 11.Gao P, Zhang H, Dinavahi R, Li F, Xiang Y, Raman V, et al. HIF-dependent antitumorigenic effect of antioxidants in vivo. Cancer cell. 2007;12:230–8. doi: 10.1016/j.ccr.2007.08.004. [DOI] [PMC free article] [PubMed] [Google Scholar]
- 12.Patterson RE, White E, Kristal AR, Neuhouser ML, Potter JD. Vitamin supplements and cancer risk: the epidemiologic evidence. Cancer causes & control: CCC. 1997;8:786–802. doi: 10.1023/a:1018443724293. [DOI] [PubMed] [Google Scholar]
- 13.Sayin VI, Ibrahim MX, Larsson E, Nilsson JA, Lindahl P, Bergo MO. Antioxidants accelerate lung cancer progression in mice. SciTranslMed. 2014;6:221ra15. doi: 10.1126/scitranslmed.3007653. [DOI] [PubMed] [Google Scholar]
- 14.Wang H, Liu X, Long M, Huang Y, Zhang L, Zhang R, et al. NRF2 activation by antioxidant antidiabetic agents accelerates tumor metastasis. SciTranslMed. 2016;8:334ra51. doi: 10.1126/scitranslmed.aad6095. [DOI] [PubMed] [Google Scholar]
- 15.Cantor JR, Sabatini DM. Cancer cell metabolism: one hallmark, many faces. Cancer Discov. 2012;2:881–98. doi: 10.1158/2159-8290.CD-12-0345. [DOI] [PMC free article] [PubMed] [Google Scholar]
- 16.Hanahan D, Weinberg RA. Hallmarks of cancer: the next generation. Cell. 2011;144:646–74. doi: 10.1016/j.cell.2011.02.013. [DOI] [PubMed] [Google Scholar]
- 17.Chen L, Cui H. Targeting Glutamine Induces Apoptosis: A Cancer Therapy Approach. IntJ MolSci. 2015;16:22830–55. doi: 10.3390/ijms160922830. [DOI] [PMC free article] [PubMed] [Google Scholar]
- 18.Hensley CT, Wasti AT, DeBerardinis RJ. Glutamine and cancer: cell biology, physiology, and clinical opportunities. JClinInvest. 2013;123:3678–84. doi: 10.1172/JCI69600. [DOI] [PMC free article] [PubMed] [Google Scholar]
- 19.Wettersten HI, Hakimi AA, Morin D, Bianchi C, Johnstone ME, Donohoe DR, et al. Grade-dependent metabolic reprogramming in kidney cancer revealed by combined proteomics and metabolomics analysis. Cancer Res. 2015;75:2541–52. doi: 10.1158/0008-5472.CAN-14-1703. [DOI] [PMC free article] [PubMed] [Google Scholar]
- 20.Wettersten HI, Aboud OA, Lara PN, Jr, Weiss RH. Metabolic reprogramming in clear cell renal cell carcinoma. Nature reviews Nephrology. 2017 doi: 10.1038/nrneph.2017.59. [DOI] [PubMed] [Google Scholar]
- 21.Ballatori N, Krance SM, Notenboom S, Shi S, Tieu K, Hammond CL. Glutathione dysregulation and the etiology and progression of human diseases. BiolChem. 2009;390:191–214. doi: 10.1515/BC.2009.033. [DOI] [PMC free article] [PubMed] [Google Scholar]
- 22.Shim EH, Livi CB, Rakheja D, Tan J, Benson D, Parekh V, et al. L-2-Hydroxyglutarate: an epigenetic modifier and putative oncometabolite in renal cancer. Cancer Discov. 2014;4:1290–8. doi: 10.1158/2159-8290.CD-13-0696. [DOI] [PMC free article] [PubMed] [Google Scholar]
- 23.Wise DR, Thompson CB. Glutamine addiction: a new therapeutic target in cancer. Trends BiochemSci. 2010;35:427–33. doi: 10.1016/j.tibs.2010.05.003. [DOI] [PMC free article] [PubMed] [Google Scholar]
- 24.Hakimi AA, Reznik E, Lee CH, Creighton CJ, Brannon AR, Luna A, et al. An Integrated Metabolic Atlas of Clear Cell Renal Cell Carcinoma. Cancer cell. 2016;29:104–16. doi: 10.1016/j.ccell.2015.12.004. [DOI] [PMC free article] [PubMed] [Google Scholar]
- 25.Katt WP, Lukey MJ, Cerione RA. A tale of two glutaminases: homologous enzymes with distinct roles in tumorigenesis. Future medicinal chemistry. 2017;9:223–43. doi: 10.4155/fmc-2016-0190. [DOI] [PMC free article] [PubMed] [Google Scholar]
- 26.Lee YZ, Yang CW, Chang HY, Hsu HY, Chen IS, Chang HS, et al. Discovery of selective inhibitors of Glutaminase-2, which inhibit mTORC1, activate autophagy and inhibit proliferation in cancer cells. Oncotarget. 2014;5:6087–101. doi: 10.18632/oncotarget.2173. [DOI] [PMC free article] [PubMed] [Google Scholar]
- 27.Gao P, Tchernyshyov I, Chang TC, Lee YS, Kita K, Ochi T, et al. c-Myc suppression of miR-23a/b enhances mitochondrial glutaminase expression and glutamine metabolism. Nature. 2009;458:762–5. doi: 10.1038/nature07823. [DOI] [PMC free article] [PubMed] [Google Scholar]
- 28.Wang JB, Erickson JW, Fuji R, Ramachandran S, Gao P, Dinavahi R, et al. Targeting mitochondrial glutaminase activity inhibits oncogenic transformation. Cancer cell. 2010;18:207–19. doi: 10.1016/j.ccr.2010.08.009. [DOI] [PMC free article] [PubMed] [Google Scholar]
- 29.Gross MI, Demo SD, Dennison JB, Chen L, Chernov-Rogan T, Goyal B, et al. Antitumor activity of the glutaminase inhibitor CB-839 in triple-negative breast cancer. MolCancer Ther. 2014;13:890–901. doi: 10.1158/1535-7163.MCT-13-0870. [DOI] [PubMed] [Google Scholar]
- 30.Meric-Bernstam F, Tannir NMH, J J, Bennett MK. Phase 1 study of CB-839, a small molecule inhibitor of glutaminase (GLS), alone and in combination with everolimus (E) in patients (pts) with renal cell cancer (RCC) JClinOncol. 2016;34 [Google Scholar]
- 31.Aide N, Cappele O, Bottet P, Bensadoun H, Regeasse A, Comoz F, et al. Efficiency of [(18)F]FDG PET in characterising renal cancer and detecting distant metastases: a comparison with CT. EurJ NuclMedMolImaging. 2003;30:1236–45. doi: 10.1007/s00259-003-1211-4. [DOI] [PubMed] [Google Scholar]
- 32.Gofrit ON, Orevi M. Diagnostic Challenges in Kidney Cancer: A Systematic Review of the Role of PET/CT. J Urol. 2016 doi: 10.1016/j.juro.2016.02.2992. [DOI] [PubMed] [Google Scholar]
- 33.Shroff EH, Eberlin LS, Dang VM, Gouw AM, Gabay M, Adam SJ, et al. MYC oncogene overexpression drives renal cell carcinoma in a mouse model through glutamine metabolism. ProcNatlAcadSciUSA. 2015 doi: 10.1073/pnas.1507228112. [DOI] [PMC free article] [PubMed] [Google Scholar]
- 34.Gameiro PA, Yang J, Metelo AM, Perez-Carro R, Baker R, Wang Z, et al. In vivo HIF-mediated reductive carboxylation is regulated by citrate levels and sensitizes VHL-deficient cells to glutamine deprivation. Cell metabolism. 2013;17:372–85. doi: 10.1016/j.cmet.2013.02.002. [DOI] [PMC free article] [PubMed] [Google Scholar]
- 35.Lieberman BP, Ploessl K, Wang L, Qu W, Zha Z, Wise DR, et al. PET imaging of glutaminolysis in tumors by 18F-(2S,4R)4-fluoroglutamine. J NuclMed. 2011;52:1947–55. doi: 10.2967/jnumed.111.093815. [DOI] [PubMed] [Google Scholar]
- 36.Venneti S, Dunphy MP, Zhang H, Pitter KL, Zanzonico P, Campos C, et al. Glutamine-based PET imaging facilitates enhanced metabolic evaluation of gliomas in vivo. SciTranslMed. 2015;7:274ra17. doi: 10.1126/scitranslmed.aaa1009. [DOI] [PMC free article] [PubMed] [Google Scholar]
- 37.Zhou R, Pantel AR, Li S, Lieberman BP, Ploessl K, Choi H, et al. [18F](2S,4R)4-Fluoroglutamine PET Detects Glutamine Pool Size Changes in Triple Negative Breast Cancer in Response to Glutaminase Inhibition. Cancer research. 2017 doi: 10.1158/0008-5472.CAN-16-1945. [DOI] [PMC free article] [PubMed] [Google Scholar]
- 38.Jedeszko C, Paez-Ribes M, Di DT, Man S, Lee CR, Xu P, et al. Postsurgical adjuvant or metastatic renal cell carcinoma therapy models reveal potent antitumor activity of metronomic oral topotecan with pazopanib. SciTranslMed. 2015;7:282ra50. doi: 10.1126/scitranslmed.3010722. [DOI] [PubMed] [Google Scholar]
- 39.Guo S, Duan JA, Qian D, Tang Y, Qian Y, Wu D, et al. Rapid determination of amino acids in fruits of Ziziphus jujuba by hydrophilic interaction ultra-high-performance liquid chromatography coupled with triple-quadrupole mass spectrometry. Journal of agricultural and food chemistry. 2013;61:2709–19. doi: 10.1021/jf305497r. [DOI] [PubMed] [Google Scholar]
- 40.Ganti S, Taylor SL, Abu AO, Yang J, Evans C, Osier MV, et al. Kidney tumor biomarkers revealed by simultaneous multiple matrix metabolomics analysis. Cancer Res. 2012;72:3471–9. doi: 10.1158/0008-5472.CAN-11-3105. [DOI] [PMC free article] [PubMed] [Google Scholar]
- 41.Abu Aboud O, Chen CH, Senapedis W, Baloglu E, Argueta C, Weiss RH. Dual and specific inhibition of NAMPT and PAK4 by KPT-9274 decreases kidney cancer growth. MolCancer Ther. 2016 doi: 10.1158/1535-7163.MCT-16-0197. [DOI] [PMC free article] [PubMed] [Google Scholar]
- 42.Habib SL, Phan MN, Patel SK, Li D, Monks TJ, Lau SS. Reduced constitutive 8-oxoguanine-DNA glycosylase expression and impaired induction following oxidative DNA damage in the tuberin deficient Eker rat. Carcinogenesis. 2003;24:573–82. doi: 10.1093/carcin/24.3.573. [DOI] [PubMed] [Google Scholar]
- 43.Qu W, Zha Z, Ploessl K, Lieberman BP, Zhu L, Wise DR, et al. Synthesis of optically pure 4-fluoro-glutamines as potential metabolic imaging agents for tumors. J AmChemSoc. 2011;133:1122–33. doi: 10.1021/ja109203d. [DOI] [PubMed] [Google Scholar]
- 44.Jones DP. Redox potential of GSH/GSSG couple: assay and biological significance. Methods in enzymology. 2002;348:93–112. doi: 10.1016/s0076-6879(02)48630-2. [DOI] [PubMed] [Google Scholar]
- 45.Zitka O, Skalickova S, Gumulec J, Masarik M, Adam V, Hubalek J, et al. Redox status expressed as GSH:GSSG ratio as a marker for oxidative stress in paediatric tumour patients. Oncology letters. 2012;4:1247–53. doi: 10.3892/ol.2012.931. [DOI] [PMC free article] [PubMed] [Google Scholar]
- 46.Li W, Kong AN. Molecular mechanisms of Nrf2-mediated antioxidant response. Molecular carcinogenesis. 2009;48:91–104. doi: 10.1002/mc.20465. [DOI] [PMC free article] [PubMed] [Google Scholar]
- 47.Shibutani S, Takeshita M, Grollman AP. Insertion of specific bases during DNA synthesis past the oxidation-damaged base 8-oxodG. Nature. 1991;349:431–4. doi: 10.1038/349431a0. [DOI] [PubMed] [Google Scholar]
- 48.Hwang VJ, Kim J, Rand A, Yang C, Sturdivant S, Hammock B, et al. The cpk model of recessive PKD shows glutamine dependence associated with the production of the oncometabolite 2-hydroxyglutarate. AmJPhysiol Renal Physiol. 2015;309:F492–F8. doi: 10.1152/ajprenal.00238.2015. [DOI] [PMC free article] [PubMed] [Google Scholar]
- 49.Gupta SC, Hevia D, Patchva S, Park B, Koh W, Aggarwal BB. Upsides and downsides of reactive oxygen species for cancer: the roles of reactive oxygen species in tumorigenesis, prevention, and therapy. Antioxidants & redox signaling. 2012;16:1295–322. doi: 10.1089/ars.2011.4414. [DOI] [PMC free article] [PubMed] [Google Scholar]
- 50.Piskounova E, Agathocleous M, Murphy MM, Hu Z, Huddlestun SE, Zhao Z, et al. Oxidative stress inhibits distant metastasis by human melanoma cells. Nature. 2015;527:186–91. doi: 10.1038/nature15726. [DOI] [PMC free article] [PubMed] [Google Scholar]
- 51.Le GK, Ibrahim MX, Wiel C, Sayin VI, Akula MK, Karlsson C, et al. Antioxidants can increase melanoma metastasis in mice. SciTranslMed. 2015;7:308re8. doi: 10.1126/scitranslmed.aad3740. [DOI] [PubMed] [Google Scholar]
- 52.Dey P, Baddour J, Muller F, Wu CC, Wang H, Liao WT, et al. Genomic deletion of malic enzyme 2 confers collateral lethality in pancreatic cancer. Nature. 2017;542:119–23. doi: 10.1038/nature21052. [DOI] [PMC free article] [PubMed] [Google Scholar]
- 53.Morry J, Ngamcherdtrakul W, Yantasee W. Oxidative stress in cancer and fibrosis: Opportunity for therapeutic intervention with antioxidant compounds, enzymes, and nanoparticles. Redox biology. 2016;11:240–53. doi: 10.1016/j.redox.2016.12.011. [DOI] [PMC free article] [PubMed] [Google Scholar]
- 54.Perroud B, Ishimaru T, Borowsky AD, Weiss RH. Grade-dependent proteomics characterization of kidney cancer. MolCell Proteomics. 2008;8:971–85. doi: 10.1074/mcp.M800252-MCP200. [DOI] [PMC free article] [PubMed] [Google Scholar]
- 55.Qu W, Oya S, Lieberman BP, Ploessl K, Wang L, Wise DR, et al. Preparation and characterization of L-[5-11C]-glutamine for metabolic imaging of tumors. JNuclMed. 2012;53:98–105. doi: 10.2967/jnumed.111.093831. [DOI] [PubMed] [Google Scholar]
- 56.Gerlinger M, Rowan AJ, Horswell S, Larkin J, Endesfelder D, Gronroos E, et al. Intratumor heterogeneity and branched evolution revealed by multiregion sequencing. NEnglJMed. 2012;366:883–92. doi: 10.1056/NEJMoa1113205. [DOI] [PMC free article] [PubMed] [Google Scholar]
Associated Data
This section collects any data citations, data availability statements, or supplementary materials included in this article.